

Here's a hard truth: 90% of new intraday traders in India blow up their first account within six months.

Rajesh Sharma
محلل فوركس أول ·  India
India
☕ 9 دقائق قراءة
ما ستتعلمه:
- 1The Right Mindset: Indicators Are a Compass, Not a Crystal Ball
- 2The Core Five: Your Intraday Trading Indicators Toolkit
- 3How to Combine Them: A Simple 3-Step Process
- 4Pitfalls I've Fallen Into (So You Don't Have To)
- 5Platforms & Execution: Making It Work on Indian Brokers
- 6When You're Ready to Level Up

Here's a hard truth: 90% of new intraday traders in India blow up their first account within six months. I know, I was almost one of them. The biggest culprit? Indicator overload. We download every free script, slap 15 oscillators on a chart, and then wonder why we're paralyzed when Nifty moves. The secret isn't more tools, it's the right ones used correctly. Let's cut through the noise and talk about the handful of intraday trading indicators that actually help you make decisions, not just decorate your screen.
Before we get to the list, we need to reset expectations. An indicator is a derivative of price. It's lagging, not leading. It tells you what has happened, so you can make a probabilistic guess about what might happen next. Thinking any indicator will give you a 100% signal is a surefire way to lose money.
I learned this the expensive way. Back in 2018, I was obsessed with finding the 'perfect' RSI setting for Bank Nifty. I'd see an RSI reading of 75 and short, convinced a reversal was due. More often than not, the index would just keep rallying to an RSI of 85, stopping me out. I was treating the RSI indicator like a command, not a context clue.
Your primary focus must always be price action and volume. Indicators are there to support that story, to give you confidence in your read. They filter out noise. For intraday, especially in fast markets like Nifty or Bank Nifty futures, simplicity wins. You don't have time to interpret a conflicting mess.
Warning: No indicator works in isolation during news events like RBI announcements or budget speeches. Price goes chaotic, and indicators become meaningless. It's better to sit out.

💡 نصيحة وينستون
An indicator is just a story about past price. Your job is to decide if that story is likely to have a sequel, or if it's about to end.
“90% of new intraday traders in India blow up their first account within six months.”
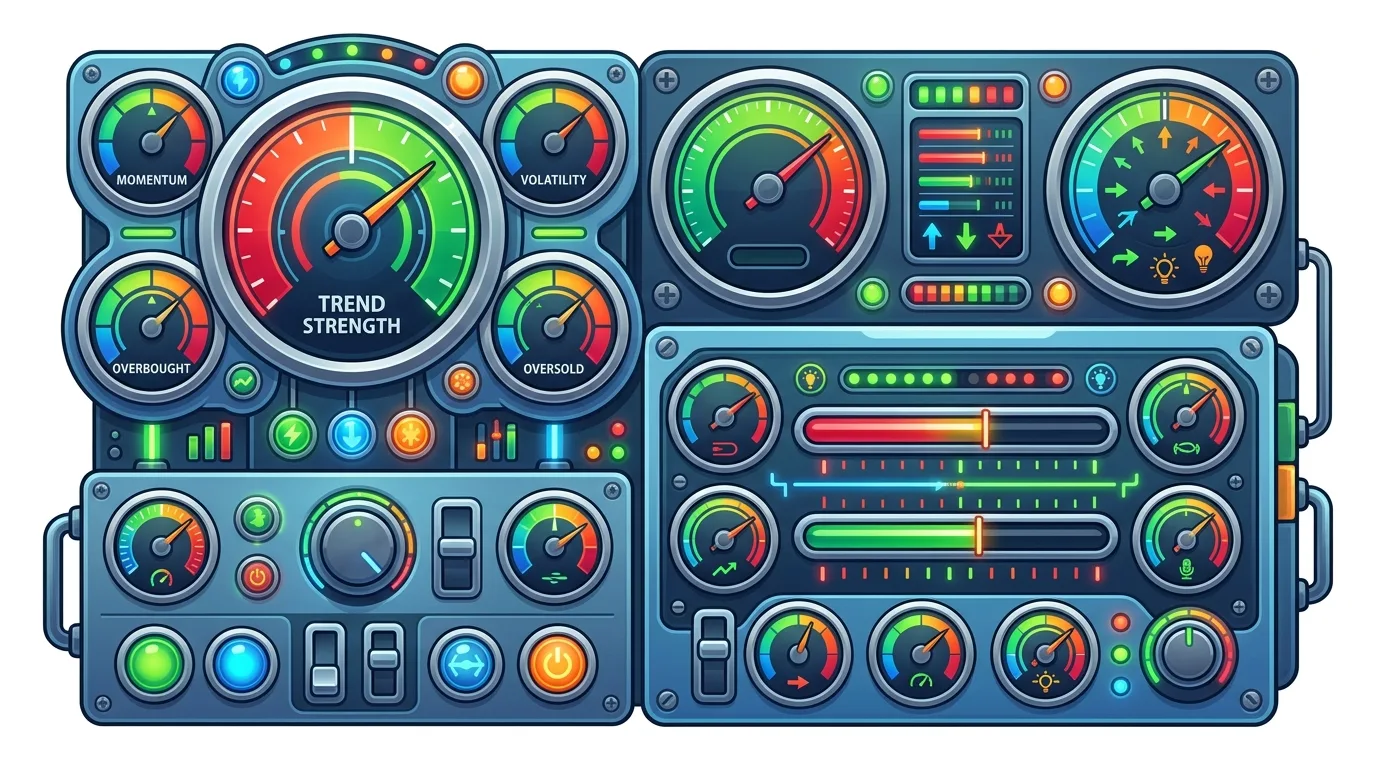
Forget the 50+ indicators in your MT4/MT5 menu. These five, used in combination, cover momentum, trend, volatility, and volume. That's all you need.
1. Exponential Moving Averages (EMAs): The Trend Filter
The 20-period and 50-period EMAs on a 5-minute or 15-minute chart are your foundation. In a strong uptrend, price should respect the 20 EMA as support. The 50 EMA is your broader trend guide. My rule? I only look for long setups when price is above the 50 EMA, and shorts when it's below. It keeps me on the right side of the intraday momentum. A clean cross of the 20 EMA above the 50 EMA can be a powerful signal for a trend day setting up.
2. Relative Strength Index (RSI): The Momentum Gauge
Forget the standard 70/30 overbought/oversold lines for intraday. They get hit too often in strong trends. I use a 14-period RSI but watch for failure swings and divergences. A bearish divergence (price makes a higher high, RSI makes a lower high) while near the 65-70 zone is a much stronger short signal than just an RSI reading of 71. I also use the 50 level as a bull/bear bias line.
3. Moving Average Convergence Divergence (MACD): The Confirmation Machine
The MACD indicator is brilliant for confirming momentum shifts. I don't use the default settings. I change them to (12, 26, 9) for a slightly faster response on intraday charts. I watch for two things: the MACD line crossing the signal line, and more importantly, the histogram crossing above or below the zero line. A histogram crossing above zero while price is above the 20 EMA? That's a high-probability long add signal.
4. Bollinger Bands: Your Volatility Map
Bollinger Bands (20-period, 2 standard deviations) show you where price should be statistically. The bands contract before big moves (the squeeze) and expand during trends. A classic intraday play is a bounce off the middle band (the 20 SMA) in the direction of the trend. Also, a move that starts from one band often travels to the other. If price is riding the upper band, don't try to pick a top. The trend is your friend.
5. Volume: The Truth Teller
It's not a fancy line, but it's the most important indicator. A breakout on high volume is real. A breakout on low volume is fake and likely to reverse. I keep a simple volume bar chart below my main chart. If price is rising but volume is declining, that uptrend is weak and suspect. Most Indian brokers' platforms show volume for indices and stocks clearly.
Example: On a Nifty 5-min chart, price pulls back to the 20 EMA. Volume is low on the pullback (shows lack of selling interest). The RSI holds above 50, and the MACD histogram is ticking up near its zero line. That's a textbook confluence for a long entry.
“The secret isn't more tools, it's the right ones used correctly.”
Here’s my actual workflow for a typical Nifty futures scalping strategy session on a 5-minute chart.
Step 1: Determine the Bias (Trend) I glance at the 1-hour chart first. Is price above or below the 50 EMA? That's my broader bias. Then, I drop to the 5-minute chart. If the 5-min 20 EMA is above the 50 EMA, and price is above both, my intraday bias is bullish. I will only look for long setups or very strong short reversal signals.
Step 2: Wait for the Setup (Confluence) I don't trade just because one indicator flashes. I need at least two, preferably three, agreeing. For a long entry:
- Price touches or slightly dips below the 20 EMA (support).
- RSI is above 50 and ideally bouncing from 40-50 zone.
- MACD histogram is flat or starting to turn up.
- Volume spikes on the bounce (confirmation).
Step 3: Entry, Stop Loss, and Target My entry is on the first strong bullish candle after the confluence. My stop loss goes 1-2 ticks below the recent swing low or below the 50 EMA. My target? Often, I'll look for the opposite Bollinger Band, or a previous high/low. I always use a position size calculator so my risk is never more than 1% of my capital on any single trade. Getting stopped out is part of the game; protecting your capital is the profession.
💡 نصيحة وينستون
If you can't explain your trade setup in one sentence using your indicators ('Price bounced off the 20 EMA with RSI support'), your chart is too cluttered.

“An indicator is a derivative of price. It's lagging, not leading.”
We learn more from our losses. Here are my expensive lessons.
Mistake 1: Chasing Overbought/Oversold. Just because RSI hits 80 doesn't mean you short. In a powerful trend day, RSI can stay above 70 for hours. I once shorted Bank Nifty at an RSI of 82, only to watch it rally another 400 points. The trend, shown by the EMAs, was violently up. I ignored it for a lagging oscillator.
Mistake 2: Ignoring Time of Day. Indicator signals work differently at 9:30 AM vs. 2:30 PM. The first 30 minutes are chaotic. I avoid using indicators then. The sweet spot for clear signals is often between 10:30 AM and 2:00 PM. After 2:30 PM, be cautious of squaring-off volatility.
Mistake 3: Not Adjusting for Instrument. The same RSI reading behaves differently in Nifty, a Reliance stock, and XAU/USD (gold). Nifty trends more cleanly. A stock like Yes Bank might be more volatile and whippy. You need to adjust your expectations and perhaps your indicator settings slightly. Backtest!
Mistake 4: No Exit Plan. I had a perfect long setup in Infosys. Hit my first target, but got greedy. I moved my stop loss to breakeven and watched the trade reverse all the way back to my entry and then into a loss. I turned a winner into a loser. Now, I use a fixed risk-reward (like 1:1.5 or 1:2) and stick to it. Tools that help with multi-level exits are a lifesaver for psychology.

Sticking to a multi-level exit plan is tough psychologically, but a tool like Pulsar Terminal automates partial closures and trailing stops directly on your MT5 chart, removing emotion from the equation.
Pulsar Terminal
أداة MT5 الشاملة: أوامر سحب وإفلات، متعدد TP/SL، تريلينج ستوب، تداول الشبكة، Volume Profile وحماية البروب فيرم. يستخدمها أكثر من 1000 متداول يومياً.

“An indicator is a derivative of price. It's lagging, not leading.”
Your strategy is only as good as your execution. Slippage on market orders during high volatility can kill a scalping strategy.
Most Indian retail traders use their broker's proprietary platform (like Zerodha's Kite, Angel One's SpeedPro) or MT5. The good news is, all the indicators we discussed are available on these platforms. The key is setting up your charts cleanly.
I run a 3-chart layout: Main chart (candles with 20 & 50 EMA, Bollinger Bands), a sub-chart for RSI, and another for MACD. Volume is on the main chart. It's uncluttered.
For those using MT5 (offered by some international brokers serving Indian clients like Exness or IC Markets), you have more customization. You can script alerts for when your specific confluence occurs. This is huge. Instead of staring at the screen, you get a ping.
Pro Tip: Always use a limit order to enter, not a market order. You define the exact price. On volatile days, a market order for Nifty can fill 5-10 points away from what you saw, wrecking your risk calculation from the start.
💡 نصيحة وينستون
The most profitable indicator is the one that tells you when to stop trading for the day. It's called discipline.

“I turned a winner into a loser by moving my stop loss to breakeven out of greed.”
Once you're consistently profitable with the core five, you can explore tools that provide a different lens. Don't add them all at once. Master one new concept at a time.
Volume Profile: This shows you where volume was traded at specific price levels, not just when. It helps identify key support/resistance zones (Points of Control, Value Areas) that are invisible on a normal chart. A breakout above a high-volume node is significant.
VWAP (Volume Weighted Average Price): The benchmark for institutional intraday trading. Many algorithms trade around it. Price above VWAP = bullish intraday bias. Price below VWAP = bearish. Pullbacks to VWAP often offer entries.
Order Flow Tools: These show you the actual buy and sell orders hitting the market. You can see if a large move is driven by aggressive buyers (lifting the offer) or passive selling (hitting the bid). This is advanced but gets you closer to the market's real mechanics.
The biggest upgrade, however, isn't another indicator. It's your discipline. It's journaling every trade, reviewing why you won or lost, and sticking to your plan even when you're bored or frustrated. That's what separates the pros from the hopefuls.

FAQ
Q1What's the best time frame for intraday trading indicators in India?
It depends on your style. For scalping (holding minutes), the 3-minute or 5-minute chart is common. For longer intraday swings (holding hours), the 15-minute chart is ideal. Always check the next higher time frame (e.g., 1-hour) for trend bias. Avoid the 1-minute chart - it's mostly noise.
Q2Should I use the same indicator settings for Nifty and for stocks?
Not always. Nifty 50, being an index, trends smoother. You can often use standard settings (like RSI 14). For more volatile mid-cap or small-cap stocks, you might adjust. Try a slightly slower RSI (like period 21) to filter out false signals. Always backtest on the specific instrument you're trading.
Q3How many indicators should I have on my screen at once?
As few as possible. I recommend 3-4 total. More than that leads to "analysis paralysis" where indicators conflict and you do nothing. The core five from this article are more than enough. A clean chart is a tradable chart.
Q4Why do my indicators give false signals during market opening?
The first 15-45 minutes are for price discovery. Volume is erratic, and institutional orders are flooding in. Indicators calculated on this chaotic data are unreliable. I don't take any indicator-based trades until at least 9:45 AM. Let the market settle first.
Q5Can I automate trading based on these indicators?
Technically, yes, with Expert Advisors (EAs) on platforms like MT5. However, I strongly advise against full automation as a beginner. The market context (news, overall sentiment) matters too much. Use alerts for signals, but keep the final execution as a manual, discretionary check.
Q6Do these indicators work for forex trading as well?
The principles are universal. EMAs, RSI, MACD, and Bollinger Bands work on any liquid chart, like EUR/USD. However, forex pairs have different volatility patterns and are active 24 hours. You may need to adjust your time frames (like using 1-hour charts for intraday forex) and be mindful of different trading sessions (London, New York).
درس البروفيسور وينستون
النقاط الرئيسية:
- ✓Use EMAs (20 & 50 period) to filter your bias.
- ✓RSI divergences are stronger than overbought/oversold lines.
- ✓Wait for 2-3 indicators to agree before entering.
- ✓Never risk more than 1% per trade.
ما مدى فائدة هذا المقال؟
انقر على نجمة للتقييم
رؤى التداول الأسبوعية
تحليلات واستراتيجيات أسبوعية مجانية. بدون رسائل مزعجة.
عن المؤلف
Rajesh Sharma
محلل فوركس أول
أكثر من 10 سنوات في تداول الأسواق الهندية وجنوب آسيا. بدأ بالمشتقات النقدية في NSE قبل الانتقال إلى الفوركس الدولي. متخصص في USD/INR وأزواج الأسواق الناشئة.
التعليقات
تحذير من المخاطر
ينطوي تداول الأدوات المالية على مخاطر كبيرة وقد لا يكون مناسبًا لجميع المستثمرين. الأداء السابق لا يضمن النتائج المستقبلية. هذا المحتوى لأغراض تعليمية فقط ولا ينبغي اعتباره نصيحة استثمارية. قم دائمًا بإجراء بحثك الخاص قبل التداول.
قد يعجبك أيضًا

Cara Trading Forex Sukses: 7 Prinsip dari Trader Profesional
Cara trading forex sukses dengan 7 prinsip trader pro: manajemen modal, disiplin, journal trading, backtest. Data nyata, bukan janji profit palsu.
Jam Trading Forex Terbaik untuk Trader Indonesia: Panduan Lengkap dengan Tabel Waktu
Panduan jam trading forex untuk trader Indonesia. Tabel 4 sesi dunia, jam emas 20:00-00:00, sesi mana yang harus dihindari. Data akurat + tips dari trader berpengalaman.
Top 5 Sàn Forex Uy Tín Nhất 2026: Review Jujur dari Trader Indonesia
Top 5 sàn forex uy tín 2026 untuk trader Indonesia. Review jujur: spread, deposit, withdraw, dukungan lokal. Exness, XM, IC Markets & lebih.
احصل على Pulsar Terminal
جميع هذه الحاسبات مدمجة في Pulsar Terminal مع بيانات حية من حساب MT5 الخاص بك.
احصل على Pulsar Terminal