

You've seen the pretty pictures of dojis and hammers, but do forex candlestick patterns actually work when you're trading from Lagos with a shaky internet connection and watching USD/NGN swing 5% in a week? Let's be honest.

Olumide Adeyemi
West African Trading Pioneer ·  Nigeria
☕ 11 min read
What you'll learn:
- 1What Candlesticks Actually Tell You (And What They Don't)
- 2The 5 Patterns That Actually Matter for Nigerian Traders
- 3The Critical Element Everyone in Nigeria Misses: Context
- 4Trading Candles with Nigerian Realities: Spreads, Brokers & NGN
- 5My Daily Candlestick Routine (From Lagos)
- 6The 3 Biggest Mistakes Nigerian Traders Make with Candlesticks
- 7Where to Go From Here: Sharpening Your Edge
You've seen the pretty pictures of dojis and hammers, but do forex candlestick patterns actually work when you're trading from Lagos with a shaky internet connection and watching USD/NGN swing 5% in a week? Let's be honest. Most of what you read about candlesticks is generic fluff written for a global audience that doesn't face our market's unique chaos. I've traded through CBN policy shocks, liquidity crunches, and everything in between. This isn't about memorizing shapes. It's about understanding what these patterns mean in the context of Nigerian forex trading - where the spread on your pair can eat your profit before the candle even closes.
A candlestick is just a visual snapshot of a battle. The open, high, low, and close for a period tell you who won that round: the buyers or the sellers. That's it. It's not a magic crystal ball.
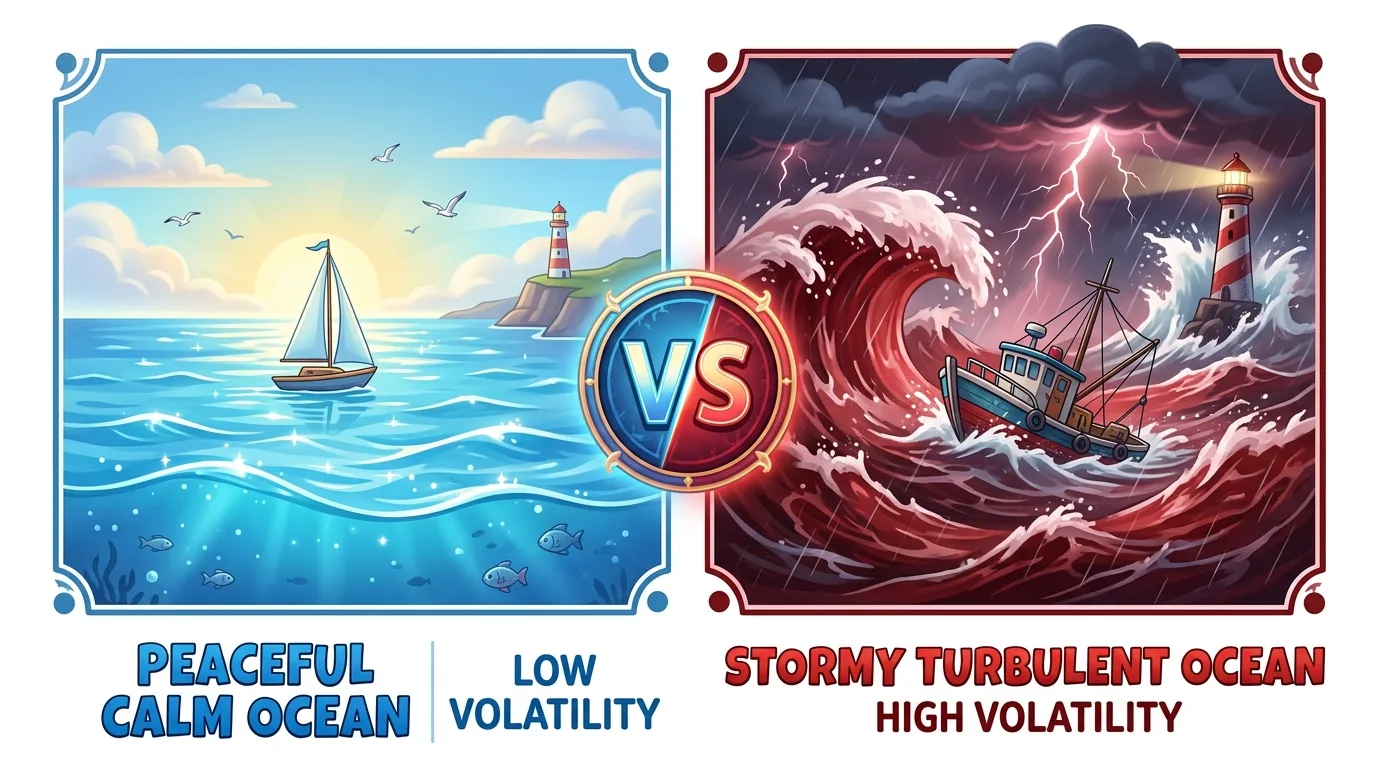
For us in Nigeria, the time frame you choose is everything. Are you looking at a 1-hour chart while the CBN is making an announcement? That candle is pure noise, likely driven by panic and thin liquidity. A daily candle, however, absorbs that intraday chaos and gives you a clearer picture of the genuine market sentiment over a longer period.
Warning: A beautiful bullish engulfing pattern on the EUR/USD chart means nothing if you don't factor in the spread. On some brokers during volatile Naira sessions, the spread on less liquid pairs can be 5-8 pips. Your "reversal" signal needs to overcome that cost just to break even. Always check the live spread before you place a trade based on a pattern. You can use a simple position size calculator to factor this in.
The biggest mistake I see new traders make is treating every doji as a reversal signal. In a strong, trending market - like USD/NGN during a devaluation phase - a doji often just means a brief pause before the trend continues. It's a sign of indecision, not a guaranteed U-turn.

💡 Winston's Tip
A candlestick pattern is a sentence, not the whole story. Read the paragraph of price action around it before you place your trade.
“A candlestick is just a visual snapshot of a battle. The open, high, low, and close for a period tell you who won that round.”
Forget the 50+ patterns in textbooks. You only need a handful, but you need to know them inside out. These are the ones that have consistently given me an edge, especially when trading around Lagos market hours (when European sessions overlap).
The Engulfing Pattern
This is the king of reversal patterns for a reason. A bullish engulfing pattern happens when a small red candle is followed by a large green candle that completely 'engulfs' the body of the previous one. It shows a powerful shift from selling to buying pressure. I caught a great one on GBP/USD in early 2024. After a 3-day dip, a massive bullish engulfing candle formed on the daily chart. I entered at 1.2620, set a stop below the candle's low, and rode it to 1.2850. The key? The pattern formed at a clear support level on the chart, not in the middle of nowhere.
The Pin Bar (Hammer & Shooting Star)
The pin bar, or hammer (bullish) and shooting star (bearish), is all about rejection. The long wick shows the price was pushed hard in one direction (e.g., sellers drove it down), but by the close, buyers fought back to recover most of the loss. I use these constantly for scalping strategy entries on the 15-minute chart during active sessions. Just last week, a perfect shooting star on USD/JPY's 1-hour chart at a resistance level gave a 40-pip short trade.
The Doji
As mentioned, the doji is a trap for the unwary. Its value is in its location. A doji after a long uptrend at a major resistance? Pay attention. A doji in the middle of a consolidation? Ignore it. It tells you the bulls and bears are in a temporary stalemate.
Morning & Evening Star
These are three-candle reversal patterns. The morning star (bullish reversal) is a long red candle, a small-bodied candle (like a doji) that gaps down, then a long green candle that gaps up and closes well into the first candle's body. It's a slow-motion version of the engulfing pattern and can be very reliable on daily charts for swing trading setups.
Inside Bar
This isn't a reversal pattern, but a consolidation signal. A small candle (the 'inside bar') is completely within the range of the previous large candle (the 'mother bar'). It indicates the market is coiling, building energy for a breakout. I love trading breakouts from inside bars, especially on XAU/USD (Gold). You place buy orders above the mother bar's high and sell orders below its low, letting the market choose the direction.

“A bullish pattern at a strong support level is a high-probability trade. The same pattern in the middle of a range is a coin flip.”
A candlestick pattern by itself is about as useful as a car without an engine. It looks right but won't get you anywhere. You must place it in context.
1. Support and Resistance: This is non-negotiable. A bullish pattern at a strong support level is a high-probability trade. The same pattern in the middle of a range is a coin flip. Always know where the key price floors and ceilings are on your chart.
2. The Overall Trend: "The trend is your friend" is a cliché because it's true. A bearish reversal pattern in a strong uptrend is a warning, not a command to go all-in short. It's often better to wait for a pullback in the direction of the trend and use a bullish pattern to re-enter.
3. Market Volatility & News: This is the Nigerian special. Is there a CBN Monetary Policy Committee meeting today? Is there a sudden shift in global oil prices? During these events, candlestick patterns break down. The market is driven by raw news and emotion. I learned this the hard way in 2023, trying to trade a pin bar reversal right as a major CBN policy was leaked. The pattern failed spectacularly, and I took a 2% account loss in minutes. Now, I check an economic calendar before I even look at the charts.
4. Confluence with Indicators: Don't rely solely on candles. Use them with other tools. For instance, a bullish engulfing pattern that also coincides with the RSI indicator coming out of oversold territory? That's a much stronger signal. Or a bearish divergence on the MACD indicator alongside a shooting star? That's your confirmation.
Pro Tip: Before you trade any pattern, ask yourself: "What story is this candle telling, and does it fit the bigger story on the chart?" If a bullish pattern forms right under a massive, multi-month resistance level, the bigger story (resistance) usually wins.
💡 Winston's Tip
If you can't instantly see the pattern without someone drawing a circle around it, it's not a valid pattern. The best setups are obvious.
“A bullish pattern at a strong support level is a high-probability trade. The same pattern in the middle of a range is a coin flip.”
Theory meets reality here, and reality in Nigeria has sharp edges.
Spreads Will Bite You: Let's get specific. You see a perfect 5-pin bar setup on the GBP/JPY cross. You're excited. But if your broker's spread is 7 pips on that pair (common with some offshore brokers popular here), your trade is already at a significant disadvantage the moment you enter. You need the market to move 7 pips just to get to your breakeven point, before the pattern even starts working. This is why I almost exclusively trade major pairs like EUR/USD where spreads are tight, often 0.8-1.2 pips on a good ECN broker.
Broker Execution Matters: A candlestick closes, you click buy... and your order fills 3 pips higher. Slippage during high volatility can distort or completely ruin a pattern-based entry. This is why choosing a broker with reliable, fast execution is critical. I've had better experiences with brokers known for their technology, like Pepperstone or IC Markets, especially when trading around news.
USD/NGN is a Different Beast: If your broker offers it, trading USD/NGN is a lesson in extreme volatility. Candlestick patterns can form and fail in the blink of an eye due to local liquidity issues and CBN interventions. The wicks (shadows) on these candles can be enormous. Trading it requires a wider stop-loss and a stomach for chaos. I treat it more like a volatile commodity than a standard forex pair.
use is a Double-Edged Sword: Nigerian traders are often offered insane use like 1:1000. Using high use on a candlestick pattern trade is a surefire way to get a margin call. A small move against you wipes you out, even if your pattern analysis was technically correct. I never use more than 1:30 use on any pattern trade, no matter how "perfect" it looks.

“Using high use on a candlestick pattern trade is a surefire way to get a margin call.”
Here's exactly what I do, step-by-step. No secrets.
- Start on the Big Picture: I open the daily chart of my 3-4 favorite pairs. I'm not looking for patterns yet. I'm identifying the clear trend and marking major support/resistance levels with horizontal lines.
- Zoom In for Patterns: I switch to the 4-hour and 1-hour charts. Now I scan for the key patterns (engulfing, pin bars) forming near those support/resistance levels I just marked. I ignore all patterns in no-man's-land.
- Check for Confirmation: If I see a promising pattern, I pull up my 2-3 confirmation tools. Usually, I'll glance at the RSI to see if it's overbought/oversold, and maybe check volume if my platform shows it.
- The Spread Check: I look at the live quote. What is the spread right now? If it's wider than average due to the time of day (e.g., late Lagos night when liquidity is low), I might pass on the trade or use a pending order to get a better entry.
- Plan the Trade: I determine my entry (often on a break of the pattern's high/low), my stop-loss (always placed beyond the pattern's extreme), and my take-profit target (usually at the next support/resistance level). I calculate my position size so my risk is never more than 1% of my account.
- Execute and Manage: I place the trade. If it's a swing trade, I might use a trailing stop to lock in profits as the move develops. Managing the trade after entry is as important as finding it.
Example: Let's say my account is $1,000. I see a bearish engulfing on EUR/USD at a resistance level on the 4H chart. My stop-loss is 25 pips above my entry. My 1% risk is $10. A 25-pip risk equals $10. Therefore, my position size should be 0.04 lots. (($10 risk) / (25 pips * $1 per pip for a micro lot)) = 0.04 lots. This precise math keeps you alive.
Manually moving stop-losses to breakeven or trailing a profitable pattern trade is a hassle; Pulsar Terminal automates this directly on your MT5 chart, so you can lock in profits from your candlestick setups without babysitting the screen.
Pulsar Terminal
The all-in-one MT5 companion: drag-and-drop orders, multi-TP/SL, trailing stop, grid trading, Volume Profile, and prop firm protection. Used by 1,000+ traders daily.

“Using high use on a candlestick pattern trade is a surefire way to get a margin call.”
I've made these. My students have made these. Let's save you the money.
1. Chasing Every Pattern: You see a hammer on a 5-minute chart, then a doji on the 15-minute, then an inside bar on the hour. You're trading constantly, getting whipsawed, and paying spreads on every trade. Patience is the ultimate skill. Wait for the high-quality set-up that ticks all the boxes (context, confluence, good spread).
2. Ignoring the Wick (Shadow): The body gets all the attention, but the wick is where the real story is. A long upper wick on a green candle shows buying failed at a higher price. A long lower wick on a red candle shows selling was rejected. These wicks often define your stop-loss level. Placing your stop inside the wick is asking to get stopped out before the move even starts.
3. Not Backtesting: "This looks good" is not a strategy. You need to know the historical success rate of your pattern + context combo. Take a month of historical data for EUR/USD. Go through it candle by candle. When your specific setup occurred (e.g., bullish engulfing at daily support), how often did price go up 50 pips before it went down 25? Do this manually. It's boring, but it builds conviction no YouTube video ever can. This process showed me that evening star patterns on the GBP/USD daily chart had a 65% success rate for a 1:2 risk-reward move over the last year. That's an edge.
💡 Winston's Tip
Your first loss is your best loss. If a pattern fails and hits your stop, don't revenge trade. The market told you your read was wrong. Listen.
“Patience is the ultimate skill. Wait for the high-quality set-up that ticks all the boxes.”
Mastering candlesticks is a lifelong practice, but here's how to accelerate it.
Practice on a Demo Account: Seriously. Don't touch live money until you can consistently identify and logically explain 5 high-quality patterns a week on your demo. Use a demo from a reputable broker like XM or Exness that simulates real spreads.
Build a Trading Journal: Every time you take a pattern trade, screenshot it. Write down: the pattern, the context, your entry/exit, your P&L, and most importantly, what you learned. Was your stop too tight? Did you ignore a key news event? Review this journal weekly.
Understand Price Action: Candlestick patterns are a subset of price action analysis. Start studying concepts like supply and demand zones, order blocks, and market structure. This deeper understanding will make your pattern recognition infinitely better.
Finally, remember that candlestick patterns are a tool for reading market psychology, not a guaranteed win button. In the noisy, volatile world of forex trading from Nigeria, they are one of the best tools you have to add structure to the chaos. But they must be used with discipline, strict risk management, and a deep respect for the local market realities that shape every single candle that forms on your screen.
FAQ
Q1What is the most reliable candlestick pattern for beginners in Nigeria?
The bullish and bearish engulfing patterns. They're visually clear, represent a strong shift in momentum, and work well on higher time frames (like 4-hour or daily charts) where Nigerian market noise is filtered out. Just make sure you trade them at key support or resistance levels, not randomly.
Q2Why do my candlestick patterns fail so often when trading from Nigeria?
Three main reasons: 1) You're trading them without context (in the middle of a chart, not at support/resistance). 2) You're trading on lower time frames (like 1-minute or 5-minute) where spreads and slippage from your broker ruin the setup. 3) You're trading during high-volatility events like CBN announcements, where technical patterns temporarily break down.
Q3Can I use candlestick patterns to trade USD/NGN?
You can, but you must adjust your approach. USD/NGN is incredibly volatile and prone to sudden gaps. Patterns can be huge and messy. Use much wider time frames (daily charts) and much wider stop-losses. Treat it with extreme caution and smaller position sizes than you would for a major pair like EUR/USD.
Q4What time frame is best for candlestick patterns?
It depends on your style. For swing trading, daily and 4-hour charts are best as they filter out intraday noise. For day trading, 1-hour and 15-minute charts can work, but you must be hyper-aware of spreads and execution speed. I recommend beginners start with the 4-hour chart.
Q5Do I need to use indicators with candlestick patterns?
You don't need to, but it helps with confirmation. A pattern is stronger if it aligns with other signals. For example, a bearish pin bar at a resistance level is more convincing if the RSI is also showing overbought conditions (>70). Use 1-2 indicators like RSI or MACD for confluence, not a dozen.
Q6How many pips should I target with a candlestick pattern trade?
There's no fixed number. Your target should be based on the market structure, not a pip dream. Aim for the next logical support or resistance level. Your risk (stop-loss) should be based on the pattern's structure (e.g., placed beyond the pattern's wick). Always aim for a risk-reward ratio of at least 1:1.5 or better.
Q7Are candlestick patterns enough for a full trading strategy?
No. They are an excellent entry and signal-generation tool, but a full strategy requires risk management (position sizing, stop-losses), trade management (when to take profit, trailing stops), and an understanding of market context (trend, key levels). Patterns are the 'what,' your strategy needs the 'when,' 'how much,' and 'why.'
Prof. Winston's Lesson
Key Takeaways:
- ✓Trade patterns only at key support/resistance.
- ✓Factor in the spread before entering any trade.
- ✓Use daily/4H charts to filter Nigerian market noise.
- ✓Never risk more than 1% of your account on a single pattern.
How useful was this article?
Click a star to rate
Weekly Trading Insights
Free weekly analysis & strategies. No spam.
About the Author
Olumide Adeyemi
West African Trading Pioneer
One of Nigeria's most active forex trading educators. 8 years of experience trading from Lagos. Specializes in low-capital strategies and prop firm challenges for African traders.
Comments
Risk Disclaimer
Trading financial instruments carries significant risk and may not be suitable for all investors. Past performance does not guarantee future results. This content is for educational purposes only and should not be considered investment advice. Always conduct your own research before trading.
You Might Also Like

Cara Trading Forex Sukses: 7 Prinsip dari Trader Profesional
Cara trading forex sukses dengan 7 prinsip trader pro: manajemen modal, disiplin, journal trading, backtest. Data nyata, bukan janji profit palsu.
Jam Trading Forex Terbaik untuk Trader Indonesia: Panduan Lengkap dengan Tabel Waktu
Panduan jam trading forex untuk trader Indonesia. Tabel 4 sesi dunia, jam emas 20:00-00:00, sesi mana yang harus dihindari. Data akurat + tips dari trader berpengalaman.
Top 5 Sàn Forex Uy Tín Nhất 2026: Review Jujur dari Trader Indonesia
Top 5 sàn forex uy tín 2026 untuk trader Indonesia. Review jujur: spread, deposit, withdraw, dukungan lokal. Exness, XM, IC Markets & lebih.
Get Pulsar Terminal
All these calculators are built into Pulsar Terminal with real-time data from your MT5 account. One-click position sizing, automatic risk management, and instant calculations.
Get Pulsar Terminal