

I stared at the screen, watching my $1,200 position in EUR/USD bleed out.

James Mitchell
Senior Trading Analyst
☕ 9 min read
What you'll learn:

I stared at the screen, watching my $1,200 position in EUR/USD bleed out. I had three moving averages, the RSI, and the Stochastic all screaming 'oversold' and 'buy.' So I bought. The market didn't care. It kept dropping another 40 pips, triggering my stop-loss. That was the day I realized I was reading the tea leaves, not the market. I had every forex trading indicator known to man on my chart, and they were all lying to me in unison. This guide isn't about throwing more tools at you. It's about learning to use a few, really well.
We've all been there. The chart looks clean, then you add a moving average. Then another. Then the RSI looks interesting at the bottom. Oh, and the MACD is about to cross. Before you know it, your price action is buried under a rainbow of squiggly lines, all giving slightly different signals. That's the trap. Indicators are derivatives of price. They are not crystal balls. They lag. My big loss came from treating a confluence of lagging indicators as a guaranteed signal. The market's momentum was overwhelmingly bearish on the higher timeframes, but my 15-minute chart with five indicators told a prettier story. I listened to the story. My account paid for it.
Warning: More indicators does not equal more clarity. It usually equals more confusion and conflicting signals. Start with a clean chart and add tools only to answer specific questions.
The real shift happened when I started asking: "What question is this indicator answering?" Is the MACD indicator telling me about momentum shift? Is the RSI telling me about potential exhaustion? If you can't answer that, you don't need it. My trading simplified dramatically when I moved from a 'signal-based' approach (indicator says buy, so I buy) to a 'context-based' one (price is in an uptrend, has pulled back to a key area, and now momentum is confirming a resumption).

“Indicators are derivatives of price. They are not crystal balls.”
These are the foundation. You need to know the trend's direction and its strength. Guessing is a sure way to lose.
Moving Averages: The Trend Filter
I use two Exponential Moving Averages (EMAs): the 20-period and the 50-period on the H4 or Daily chart. That's it. No 100, no 200. Their job is simple. Is the price above both? That's a bullish bias. Below both? Bearish bias. In between? It's range-bound or consolidating, and I should probably avoid trend-following trades. The 20 EMA acts as a dynamic support/resistance in strong trends. I once caught a beautiful 180-pip run on GBP/USD by entering on a retest of the rising 20 EMA on the H4 chart. Simple, clean.
Average Directional Index (ADX): The Strength Gauge
This is the most underrated tool. The ADX doesn't tell you direction. It tells you how strong the current trend is. A reading above 25 suggests a worthwhile trend. Below 20, and the market is likely choppy. This one tool saved me from countless losing trades in sideways markets. I'd see a nice breakout, but if the ADX was at 15, I'd pass. Nine times out of ten, it was a fakeout. It keeps you out of bad markets, which is half the battle.
Pro Tip: Don't use moving average crossovers as entry signals. They are painfully slow. Use them to define the market's state. Look for price action signals (like a pin bar or engulfing candle) in the direction of the trend defined by your MAs for your actual entry.

💡 Winston's Tip
An indicator is a servant, not a master. If it conflicts with clear price action or market context, fire the servant.
“The real shift happened when I started asking: 'What question is this indicator answering?'”
This is where most traders, including my past self, go wrong. We see RSI at 30 and think 'cheap, must buy.' But in a strong downtrend, the RSI can stay at 30 or even 20 for weeks. Buying just because something is 'oversold' is like trying to catch a falling knife.
I use the RSI indicator (14-period) with one primary rule: I only take signals that align with the trend. In an uptrend, I look for the RSI to dip to 40 or 50 (not 30) and then start curling back up as a potential entry signal. In a downtrend, I look for rallies to 60 or 50 that fail. This is called 'failure swings' and it's far more reliable than absolute levels.
The Stochastic is similar but noisier. I gave up on it for forex, honestly. It's better for ranging markets on commodities. For forex, RSI does the job. Remember, these are oscillators. They work best in ranging, non-trending markets. In a strong trend, they will give you premature and costly reversal signals. I learned that by trying to short a raging bull trend in AUD/USD because the RSI was at 85. The trend ate my position for breakfast.

“The real shift happened when I started asking: 'What question is this indicator answering?'”
Price moves because of order flow. While true volume data is hard to get in the decentralized forex market, tick volume (the number of price changes) or the Volume Profile can be incredibly insightful.
On-Balance Volume (OBV)
OBV is a simple cumulative volume indicator. The idea is that volume precedes price. If price is making a new high but OBV is failing to make a new high (divergence), it suggests the move is weak and might reverse. I spotted a major top in EUR/GBP in 2022 using this. Price was inching higher, but OBV was rolling over. I went short and rode it down for nearly 300 pips. It's a powerful confirmation (or warning) tool.
Support & Resistance
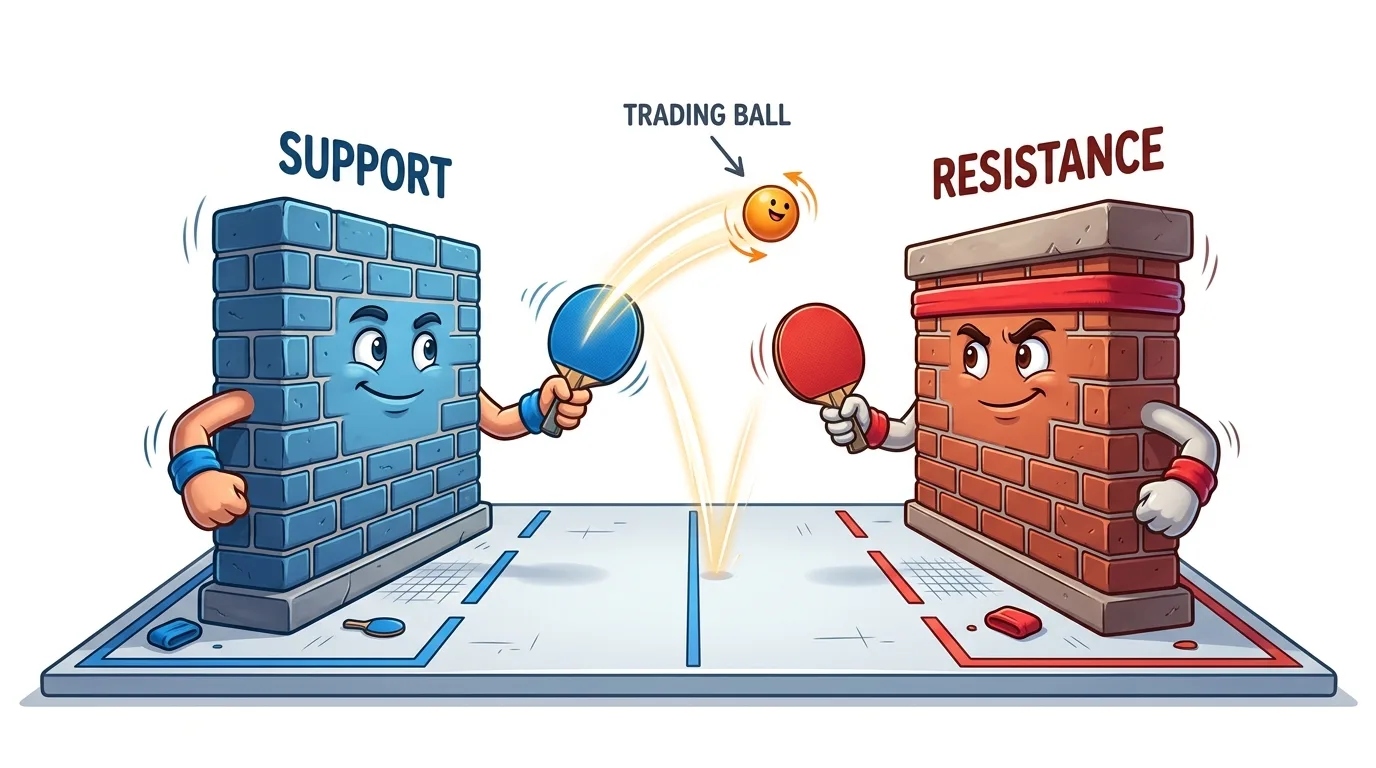
This isn't a flashing indicator, but it's the most important 'tool' you have. Drawing horizontal lines at previous swing highs and lows gives you a map. Indicators tell you when something might happen. Support and resistance tell you where. Combining them is key. I look for my momentum indicator (like RSI) to give a signal at a key support or resistance level. That's a high-probability setup. Never, ever place a trade based on an indicator signal in the middle of nowhere on the chart. Always know where the nearest walls are. Using a position size calculator becomes much more effective when you're placing stops logically behind these levels, not based on an arbitrary number of pips.
💡 Winston's Tip
The ADX reading is your permission slip. Below 20? Stay out of the kitchen. The market is just chopping people up.
“Buying just because something is 'oversold' is like trying to catch a falling knife.”
Here’s a concrete example of how I structure a trade now. It's boring. It's methodical. It works.
- Determine the Trend (H4/Daily Chart): Price above 20 & 50 EMA? ADX above 25? If yes, bullish trend. I only look for buy setups.
- Find a Location (H1 Chart): Wait for price to pull back to a pre-drawn horizontal support level OR to the rising 20 EMA.
- Check for Momentum Confirmation (H1 Chart): As price touches the support/EMA, does the RSI (14) show a reading above 40 and start to curl up? This is my trigger.
- Execute & Manage: Entry is on a small bullish price action candle (like a hammer) after the RSI curl. Stop loss goes a few pips below the support or EMA. Take profit is at the next resistance level.
This isn't sexy. But it gives every trade a reason for being. The trend filter keeps me on the right side. The location gives me a good risk/reward. The momentum confirmation increases the odds of the move starting right then. This is the opposite of my old method of seeing a Stochastic crossover and just jumping in. Your system will be different. Maybe you prefer the MACD indicator for momentum. That's fine. The principle is the same: use layers of confirmation, not a single signal.
Example: My last XAU/USD trade using this: H4 trend bullish (above EMAs, ADX 32). Pullback on H1 to $2325 support (a prior swing high). RSI dipped to 42 and turned up. Entered long at $2327. Stop at $2319 (8 pip risk). Took profit at $2341 (14 pip gain). A clean 1:1.75 risk/reward. Not a home run, but a solid single. I'll take that all day. For more on gold, my XAU/USD guide breaks down its unique behavior.

Managing multiple take-profit levels and a trailing stop manually is stressful, but tools like Pulsar Terminal automate this directly on your MT5 chart, letting you focus on your indicator analysis.
Pulsar Terminal
The all-in-one MT5 companion: drag-and-drop orders, multi-TP/SL, trailing stop, grid trading, Volume Profile, and prop firm protection. Used by 1,000+ traders daily.

“Buying just because something is 'oversold' is like trying to catch a falling knife.”
Even with a system, you'll slip up. Here are the big ones.
- Over-Optimization: Don't tweak your indicator settings after every loss. If you're changing your RSI from 14 to 13 to 12, you're just curve-fitting to past data. It won't work in the future. Pick standard settings and stick with them.
- Ignoring Price Action: The candle sticks are the raw data. An indicator giving a buy signal while a massive bearish engulfing candle is forming is a contradiction. Price action trumps the indicator. Always.
- Using Too Many Timeframes: I stick to three: one for trend (H4/D1), one for timing (H1), and one for precise entry (M15 or M5). Adding the M1, M30, H2, and H12 just creates noise and indecision.
- Forgetting the Spread: Especially on exotics or during news events, a wide spread definition can turn a theoretically good entry into an instant loser. Factor it into your stop distance. This is why I prefer brokers like IC Markets or Pepperstone for their consistently tight spreads on majors.
- Revenge Trading After a Loss: This is the killer. You get stopped out, you're angry, you jump back in on the M1 chart with no plan to 'get your money back.' That's how you turn a $50 loss into a $500 loss. Walk away. The market will be there tomorrow.
💡 Winston's Tip
Your first loss is often your smallest. Re-entering a trade immediately after a stop-out to 'prove the indicator right' is an expensive ego trip.
“The biggest edge you have isn't a secret indicator. It's patience, risk management, and emotional control.”
Forex trading indicators are tools, not trading systems. A hammer doesn't build a house. A carpenter with a plan does. Your job is to be the carpenter. Develop a simple, logical plan that uses one or two indicators to answer specific questions (What's the trend? Is momentum supporting my entry?). Then backtest it. Then trade it with discipline.
The biggest edge you have isn't a secret indicator. It's patience, risk management, and the emotional control to follow your plan. I keep a trading journal where I note not just the trade, but my mindset. Was I impatient? Did I ignore my ADX filter? This self-awareness is more valuable than any new oscillator.
Start simple. Master the 20 & 50 EMA and the ADX. Then add the RSI. Trade that for three months. You'll learn more from that than from downloading 50 custom indicators. Remember, the goal isn't to be right on every trade. The goal is to be profitable over a hundred trades. And that comes from a boring, repeatable process, not from magic lines on a screen. If you're interested in a fast-paced, disciplined approach that uses these principles on very short timeframes, you can explore my thoughts on a scalping strategy.
FAQ
Q1What is the best single forex trading indicator?
There isn't one. But if I had to pick one to use in isolation, it would be the 20-period Exponential Moving Average on the H4 chart. It shows the immediate trend and acts as dynamic support/resistance. It's simple and avoids the lag of more complex tools.
Q2How many indicators should I use on one chart?
Rarely more than three. I typically have two EMAs (20 & 50) and the ADX on my trend-finding chart. On my entry chart, I might have the RSI and horizontal support/resistance lines. Any more and you're creating noise, not clarity.
Q3Why do my indicators work in backtesting but fail in live trading?
This is usually due to over-optimization (curve-fitting) or not accounting for real-world factors like spreads, slippage, and your own psychology. Backtest with standard indicator settings and include a realistic spread in your calculations. The emotional pressure of live money changes everything.
Q4Should I use the same indicator settings for all currency pairs?
Not necessarily. Some pairs are more volatile than others. While I keep core settings (like RSI 14) standard, I might use a slightly longer-period moving average (like a 30 EMA instead of 20) on a choppier pair like GBP/JPY. Test and see what fits the pair's personality.
Q5What's the difference between leading and lagging indicators?
Lagging indicators (like Moving Averages, MACD) follow price. They confirm trends but are slow to signal changes. Leading indicators (like RSI, Stochastic) attempt to predict turns by measuring momentum, but give many false signals. A strong system uses a lagging indicator to define the trend and a leading one for timing entries within that trend.
Q6How do I avoid getting a margin call when using indicators?
Indicators have nothing to do with it. A margin call is a risk management failure. Always use a stop-loss on every trade. Never risk more than 1-2% of your account on a single trade. An indicator might give you a signal, but your position size (use a position size calculator) and stop-loss protect you from ruin.
Q7Can I make a living just trading based on indicators?
Highly unlikely. Indicators are a component of analysis. Making a living requires a full business plan: a tested trading system, strict risk management, professional psychology, and sufficient capital. Relying solely on indicator signals is like trying to drive by only looking in the rear-view mirror.
Prof. Winston's Lesson
Key Takeaways:
- ✓Use 2-3 indicators max per chart.
- ✓ADX > 25 defines a tradable trend.
- ✓RSI signals only matter at key S/R levels.
- ✓Price action always trumps the indicator.
- ✓Risk only 1-2% per trade, always.
How useful was this article?
Click a star to rate
Weekly Trading Insights
Free weekly analysis & strategies. No spam.
About the Author
James Mitchell
Senior Trading Analyst
Based in New York with over 9 years of trading experience. Focuses on major USD pairs, prop firm challenges, and the US regulatory landscape.
Comments
Risk Disclaimer
Trading financial instruments carries significant risk and may not be suitable for all investors. Past performance does not guarantee future results. This content is for educational purposes only and should not be considered investment advice. Always conduct your own research before trading.
You Might Also Like

Cara Trading Forex Sukses: 7 Prinsip dari Trader Profesional
Cara trading forex sukses dengan 7 prinsip trader pro: manajemen modal, disiplin, journal trading, backtest. Data nyata, bukan janji profit palsu.
Jam Trading Forex Terbaik untuk Trader Indonesia: Panduan Lengkap dengan Tabel Waktu
Panduan jam trading forex untuk trader Indonesia. Tabel 4 sesi dunia, jam emas 20:00-00:00, sesi mana yang harus dihindari. Data akurat + tips dari trader berpengalaman.
Top 5 Sàn Forex Uy Tín Nhất 2026: Review Jujur dari Trader Indonesia
Top 5 sàn forex uy tín 2026 untuk trader Indonesia. Review jujur: spread, deposit, withdraw, dukungan lokal. Exness, XM, IC Markets & lebih.
Get Pulsar Terminal
All these calculators are built into Pulsar Terminal with real-time data from your MT5 account. One-click position sizing, automatic risk management, and instant calculations.
Get Pulsar Terminal