

Here's a hard truth most trading gurus won't tell you: 80% of the price movement on your candlestick chart is just market noise designed to shake you out.

David van der Merwe
Emerging Markets Trader ·  South Africa
☕ 9 min read
What you'll learn:
- 1What the Hell Are Renko Charts, Anyway?
- 2The Good, The Bad, and The Ugly for SA Traders
- 3How to Set Up Renko Charts on MT4/MT5 in South Africa
- 4Practical Renko Trading Strategies That Actually Work
- 5The Top 3 Mistakes SA Traders Make with Renko
- 6Best Brokers & Platforms for Renko Trading in SA
- 7The Final Word: Should You Use Renko Charts?

Here's a hard truth most trading gurus won't tell you: 80% of the price movement on your candlestick chart is just market noise designed to shake you out. For a trader in Johannesburg or Cape Town staring at USD/ZAR whipsaws, that noise isn't just annoying, it's expensive. That's where Renko charts come in. They ignore time and focus purely on price movement, filtering out the junk to show you the real trend. I've used them for over a decade, and while they're not a magic bullet, they can save your sanity - and your capital - if you know their brutal limitations.
Forget everything you know about time-based charts. A Renko chart (from the Japanese 'renga', meaning brick) doesn't care if it's 3pm in Sandton or 3am in New York. It only plots a new 'brick' when the price moves a predefined amount. No movement? No new brick. It's that simple.
Let's say you set your brick size to 10 pips on USD/ZAR. The chart will only draw a new green (up) brick once the price moves 10 pips higher from the top of the last brick. A new red (down) brick only prints after a 10-pip drop from the bottom of the last one. Everything in between - all the tiny reversals, the spreads, the meaningless volatility - gets tossed out the window.
Example: If USD/ZAR is at 18.5000 and your brick size is 100 points (0.0100), the price must hit 18.5100 to form a new up brick. A move to 18.5099? Nothing happens on the Renko chart. This forces you to focus on significant moves, which is both its greatest strength and its most dangerous flaw.
The most common mistake I see? South African traders using a tiny brick size on volatile pairs like USD/ZAR or GBP/ZAR. You'll get constant false bricks from normal spread widening. Start with a brick size that's at least 2-3 times the average spread for your chosen pair during your trading session.
The Good: Clarity and Discipline
For trading ZAR pairs, which can be news-driven and jumpy, Renko's noise filtration is a gift. It visually enforces trend discipline. A clean column of green bricks is hard to argue with. It also completely removes the emotional noise of 'wicky' candlesticks. I've found them exceptionally useful for identifying key support and resistance levels on XAU/USD (Gold), a favourite among local traders, as the bricks cluster clearly at turning points.
The Bad and The Ugly: You're Flying Blind
This is the critical part everyone glosses over. Renko charts hide information. You have no idea how long it took to form a brick. That rapid two-green-brick move on USD/ZAR? It could have been a 5-minute spike or a 5-hour grind. You lose all sense of volatility and timing. Most crucially for us, you cannot see the actual, real-time price. The chart shows the brick close, which is lagging. Your broker's price might be at 18.5200, but your Renko chart might still be showing a brick at 18.5100. Placing a market order based on the Renko chart is a fantastic way to get a terrible fill.
Warning: Never, ever use a Renko chart for order entry by itself. Always have a standard candlestick or tick chart open to see the live price and spread. I learned this the hard way early on, entering a EUR/ZAR trade on a Renko breakout, only to be filled 15 pips worse than the brick suggested because of a widening spread. That was a R300 lesson I won't forget.
Also, most common indicators like the RSI indicator or MACD indicator are calculated based on the brick close, not real price action. They work differently, often with more lag.

💡 Winston's Tip
A Renko chart doesn't show you what the market is doing. It shows you what the market *has done*, after a specific filter is applied. Never confuse the map for the territory.
“Renko charts hide information. You have no idea how long it took to form a brick.”
MetaTrader doesn't have built-in Renko charts. You need an indicator. Most decent South African brokers like Exness or IC Markets allow custom indicators on their MT4/MT5 platforms.
- Find a reputable 'Renko Chart Generator' indicator. (A quick web search will yield options, but be cautious of malware).
- Download the
.ex4or.ex5file. - In MT4/MT5, go to File > Open Data Folder. Place the file in the
MQL4/Indicators(orMQL5/Indicators) folder. - Restart your platform. The indicator will now be in your Navigator window under 'Indicators'.
- Drag it onto any chart. A settings box will pop up.
Key Settings for ZAR Trading:
- Brick Size: This is everything. For USD/ZAR, I wouldn't go below 50 points (0.0050). For something slower like EUR/USD, you might use 10 pips. Test different sizes in a demo account.
- Show Wicks: I keep this OFF. The point is to remove that noise.
- Chart Type: Set it to 'Close Price'. This is the most common.
Remember, this indicator will transform your current chart. Don't panic when your normal candles disappear.
Renko charts are a tool for defining the trend and key levels, not a standalone system. Here’s how I integrate them.
Strategy 1: The Trend-Following Bricks
This is Renko's sweet spot. Wait for a clear sequence of bricks in one direction (e.g., 5+ consecutive green bricks). The trend is your friend. Look for a pullback that forms one or two opposite-colored bricks against the trend, then a reversal back to a trend-colored brick. This is your potential entry signal.
My Trade Example: On Gold (XAU/USD), I saw a strong column of green 50-point bricks moving from $1980 to $2020. It then printed two red bricks back to $2010. The next green brick closing above $2015 was my signal. I entered long with a stop loss below the low of the last red brick. I used a simple position size calculator to risk 1% of my account. Took profit at the next key round number, $2030. A clean R2,500 gain by just following the brick structure.
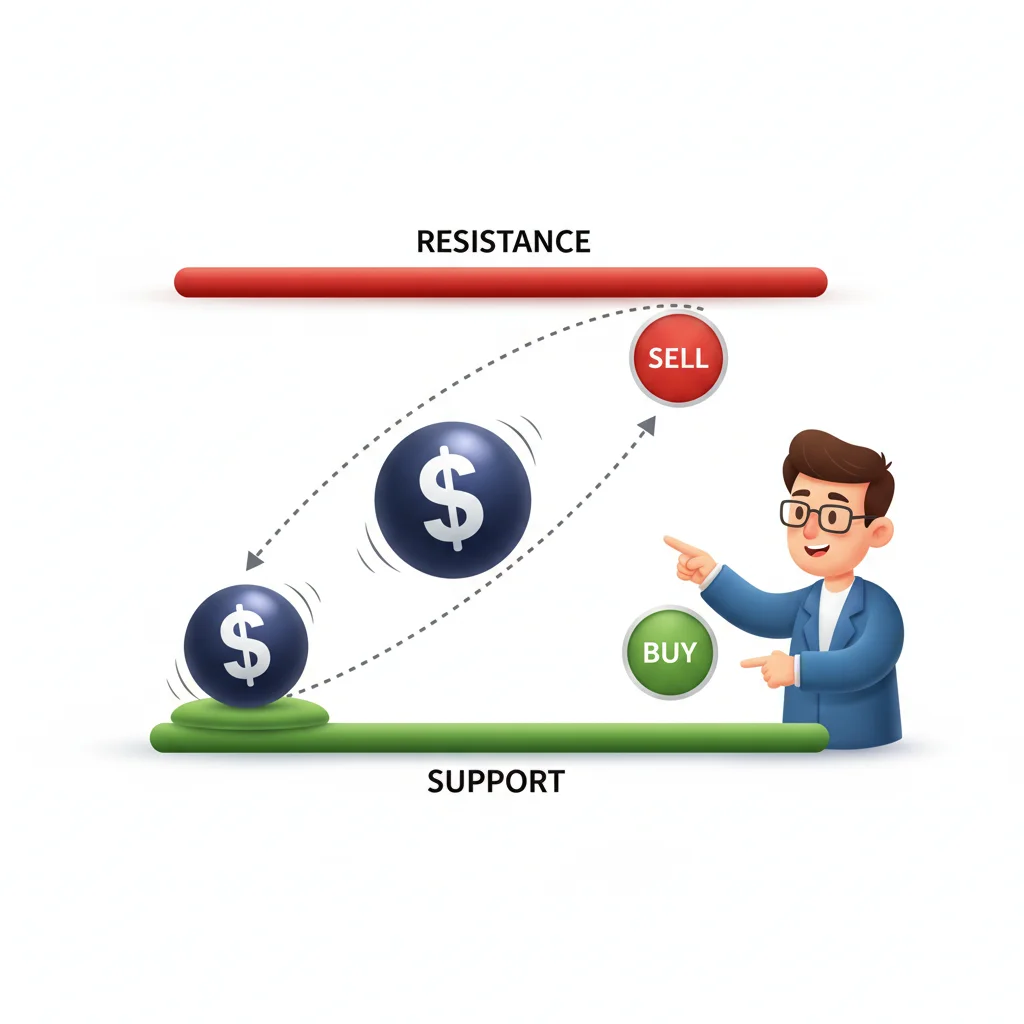
Strategy 2: Support & Resistance (S&R) Clusters
Renko bricks pile up at clear S&R levels like traffic at a robot in Joburg. A cluster of 3 or more bricks at the same approximate price level shows where the market has previously paused. A breakout from such a cluster, confirmed by a new brick closing beyond it, can be a powerful signal.
What Doesn't Work: Scalping and News
Forget about scalping strategy with Renko. The lag will kill you. Also, trading around major SA news (like SARB rate decisions or budget speeches) with Renko is suicidal. The chart won't update fast enough to reflect the violent moves, leaving you dangerously misinformed. Renko is for the quieter, trending periods, perfect for a swing trading approach.
💡 Winston's Tip
If you find yourself constantly changing your Renko brick size, the problem isn't the chart. It's the market regime. In a chop, no brick size will save you. Sometimes the best trade is to walk away.
“Placing a market order based on the Renko chart is a fantastic way to get a terrible fill.”
- Trading Without a Live Price Chart: I've said it before, I'll scream it. Your Renko chart is a filtered snapshot, not a live feed. Always have a 1-minute or tick chart open to see the actual bid/ask before you click 'buy' or 'sell'.
- Using a Brick Size That's Too Small: This turns your beautiful noise filter back into a noise amplifier. On USD/ZAR, if your broker's spread is 15 pips, a 10-pip brick size is meaningless. You'll get a brick reversal every time the spread wobbles. Start big and adjust down only if needed.
- Ignoring the Lag in a Ranging Market: Renko charts are terrible in tight ranges. They'll paint a green brick, then a red brick, then a green brick - chopping you up and generating false signals. In a ranging market, step away from the Renko or significantly increase your brick size to avoid the whip. This is where many blow their accounts, getting margin call after margin call on fake breakouts.
Managing the inherent lag and risk of Renko trading requires precise order tools, which is where a platform like Pulsar Terminal, with its drag-and-drop orders and automated stop-loss management for MT5, becomes essential.
Pulsar Terminal
The all-in-one MT5 companion: drag-and-drop orders, multi-TP/SL, trailing stop, grid trading, Volume Profile, and prop firm protection. Used by 1,000+ traders daily.

Not all brokers are equal for this. You need a platform that supports custom indicators reliably and has stable execution.
| Broker | Why It's Good for Renko | Watch Out For |
|---|---|---|
| IC Markets | Raw spreads, true ECN execution. Minimal requotes, which is vital as Renko signals can be time-sensitive. Allows full customisation. | Their support can be slow during SA hours. |
| Pepperstone | Excellent MT4/MT5 stability. The Razor account has tight spreads on majors, good for EUR/USD Renko trading. | ZAR pairs might have slightly wider spreads than specialists. |
| Exness | Popular locally, often offers ZAR accounts. Easy deposit/withdrawal in Rands. | Be very selective with account type; some have fixed spreads that can distort Renko brick formation. |
| XM | Good for beginners, low minimum deposit. Allows all custom indicators. | Execution speed might not be as fast as the top-tier ECNs, adding to Renko's inherent lag. |
Payment Methods: You'll want a broker that supports Instant EFT (like Ozow or PayFast) or direct bank transfer in ZAR. Avoid funding in a foreign currency if you can; the bank charges will eat your profits.
Pro Tip: Whatever broker you choose, run your Renko setup on a demo account for at least a month. Test different brick sizes on USD/ZAR, EUR/ZAR, and Gold during both London and New York overlaps. You need to see how it behaves with their specific feeds and spreads.
💡 Winston's Tip
The greatest value of a Renko chart for a beginner is psychological. It trains you to ignore the tiny, meaningless fluctuations that trigger most emotional trades. That discipline is worth more than any signal.

“They are the lens that helps you see the forest, but you still need a map and a compass to navigate.”
Renko charts forex trading is a powerful secondary tool, not a primary one. They are the lens that helps you see the forest, but you still need a map (your strategy) and a compass (live price action) to navigate.
I use them daily, but only on one screen of my multi-monitor setup. They give me a gut-check on the overall trend of instruments like EUR/USD or Gold. They help me set wider, more sensible stop losses because I'm not reacting to every tiny candle wick. But I never, ever place a trade based solely on what a Renko brick tells me.
For the disciplined South African trader who is tired of being tricked by market noise, learning Renko is worth the effort. For the impatient trader looking for a secret key to instant profits, you're wasting your time and money. Start on demo, respect the lag, and always - always - keep one eye on the real world price. That's the only way to use this tool without it using you.
FAQ
Q1What is the best Renko brick size for USD/ZAR?
There's no single 'best' size, but a good starting point is 50 to 100 points (0.0050 to 0.0100). This helps filter out the typical spread noise and minor volatility. Test on a demo account during different market sessions to find what gives you clear, tradable trends without excessive lag.
Q2Can I use Renko charts for prop firm challenges?
Very carefully. While they can help with trend discipline, the lag means your entry and exit prices on the challenge dashboard won't match your Renko chart. This can mess with your accuracy calculations. It's safer to use Renko for analysis on a separate chart but execute trades based on a primary time-based chart to ensure precise entries for the challenge rules.
Q3Do Renko charts work on mobile trading apps?
Generally, no. Most mobile apps (like MT4/MT5 mobile) don't support the custom indicators needed to generate Renko charts. You need the desktop version of MetaTrader for reliable Renko charting.
Q4Are Heikin-Ashi charts better than Renko charts?
They're different tools for a similar goal: smoothing noise. Heikin-Ashi is time-based and modifies the open/close/ high/low. Renko is purely price-based. Heikin-Ashi shows more information (time, wicks) but is still smoother than candlesticks. Renko is more extreme in its filtration. Try both to see which suits your psychology better.
Q5Why does my Renko chart look different from a YouTube tutorial?
Three main reasons: 1) Different brick size. 2) Different data feed (your broker's prices vs. theirs). 3) Different 'Renko generator' indicator settings (e.g., using 'Open' vs. 'Close' price). Always focus on the concepts, not trying to replicate their exact chart.
Q6Can I automate trades with Renko chart signals?
Technically yes, with an Expert Advisor (EA), but it's notoriously difficult. The lag and the fact that Renko is a visual transformation of price data (not the primary data feed) makes coding reliable EAs complex. Most attempts result in EAs that trade on outdated information.
Prof. Winston's Lesson
Key Takeaways:
- ✓Renko charts filter noise by plotting bricks only after a fixed price move.
- ✓They hide time, volatility, and the live price - critical information.
- ✓Never trade from a Renko chart alone; always have a live price chart open.
- ✓Use a brick size at least 2-3 times your broker's average spread.
- ✓They are best for confirming trends, not for precise entry timing.
How useful was this article?
Click a star to rate
Weekly Trading Insights
Free weekly analysis & strategies. No spam.
About the Author
David van der Merwe
Emerging Markets Trader
Johannesburg-based trader with 11 years in emerging market currencies. Specializes in ZAR pairs, FSCA-regulated trading, and South African market analysis.
Comments
Risk Disclaimer
Trading financial instruments carries significant risk and may not be suitable for all investors. Past performance does not guarantee future results. This content is for educational purposes only and should not be considered investment advice. Always conduct your own research before trading.
You Might Also Like

Cara Trading Forex Sukses: 7 Prinsip dari Trader Profesional
Cara trading forex sukses dengan 7 prinsip trader pro: manajemen modal, disiplin, journal trading, backtest. Data nyata, bukan janji profit palsu.
Jam Trading Forex Terbaik untuk Trader Indonesia: Panduan Lengkap dengan Tabel Waktu
Panduan jam trading forex untuk trader Indonesia. Tabel 4 sesi dunia, jam emas 20:00-00:00, sesi mana yang harus dihindari. Data akurat + tips dari trader berpengalaman.
Top 5 Sàn Forex Uy Tín Nhất 2026: Review Jujur dari Trader Indonesia
Top 5 sàn forex uy tín 2026 untuk trader Indonesia. Review jujur: spread, deposit, withdraw, dukungan lokal. Exness, XM, IC Markets & lebih.
Get Pulsar Terminal
All these calculators are built into Pulsar Terminal with real-time data from your MT5 account. One-click position sizing, automatic risk management, and instant calculations.
Get Pulsar Terminal