
Candlestick
/ˈkændəlˌstɪk/since 18th century Japanese rice tradingCandlestick — candlestick is a visual snapshot of price action in one timeframe — think of it as a market mood ring that shows if buyers or sellers won the battle.
§1So, what IS a candlestick anyway?
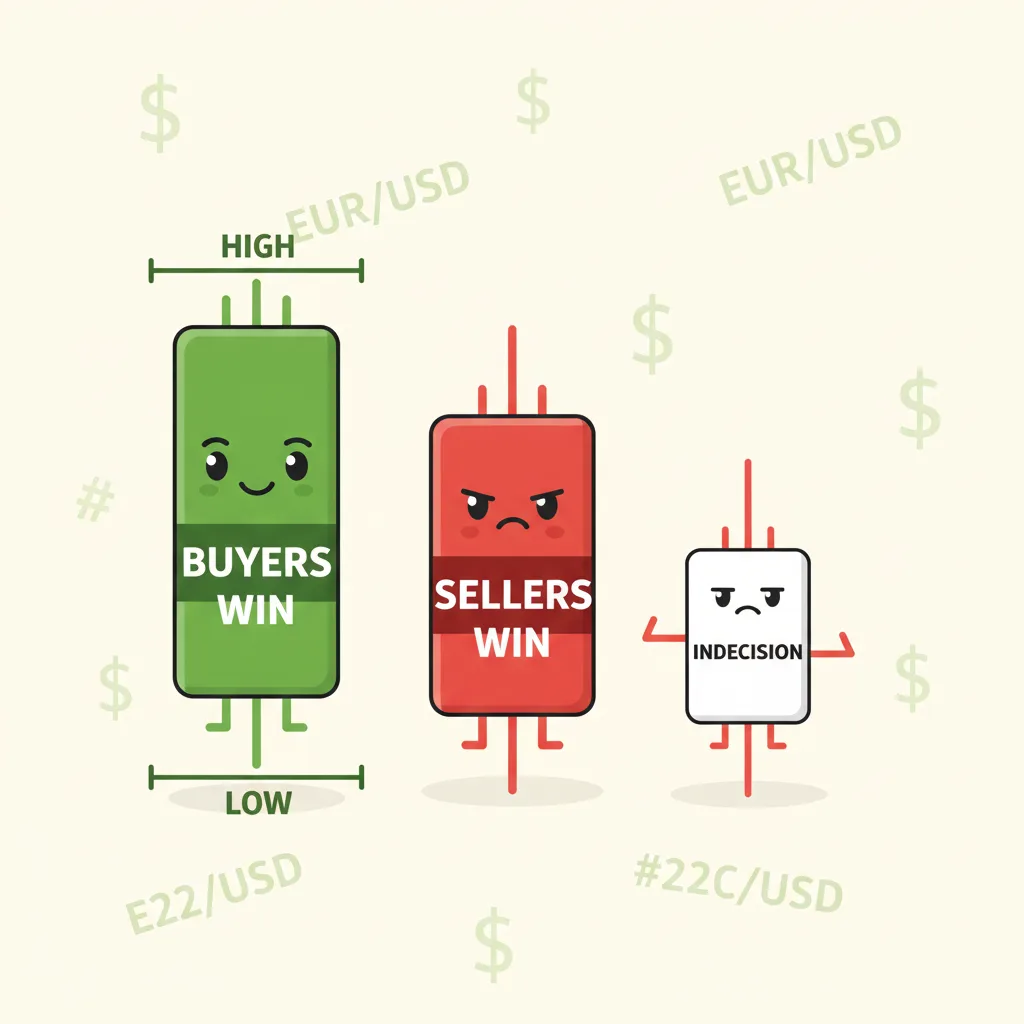
Picture this: you're watching a boxing match, but instead of two fighters, you've got buyers and sellers duking it out in the market. A candlestick is like the round-by-round scorecard that shows you who's winning. It's not just a boring line on a chart — it's a story packed into one neat little rectangle with wicks sticking out. Each candlestick gives you four crucial pieces of information: where the price opened, where it closed, and how high and low it went during that timeframe. The body (that rectangle) shows you the opening and closing prices, while the wicks (or shadows, if you want to sound fancy) show you the extreme highs and lows. Here's the fun part: the color tells you who won the round. Green (or white/hollow) means the buyers pushed the price up — the closing price is higher than the opening. Red (or black/filled) means the sellers dominated — the price closed lower than it opened. Think of it as a market mood ring that changes color based on who's in control. I've seen traders spend hours staring at these things, and trust me, once you learn to read them, you'll start seeing patterns everywhere.
§2The simple math behind the pretty pictures
Now, don't run away — I promise this is simpler than it looks. Candlesticks themselves don't have complex formulas, but there are two numbers you should know how to calculate. First, the range: that's just the high price minus the low price. It tells you how much price movement happened during that timeframe. Second, the body size: that's the absolute difference between the close and open prices (|Close - Open|). This shows you how decisive the victory was for either buyers or sellers. A big body means one side really dominated, while a tiny body means it was a close fight. See? No scary calculus here. Just basic subtraction that tells you whether the market had a dramatic day or just shuffled around indecisively. My first year trading, I thought I needed to memorize dozens of formulas, but really, these two simple calculations give you most of what you need to understand what's happening.
§3
Let's walk through how this actually plays out in real life. Say you're looking at EUR/USD on a 1-hour chart. The candlestick opens at 1.08010 — that's where the battle begins. During that hour, buyers push it up to 1.08150 (the high), but sellers fight back and drive it down to 1.07980 (the low). By the end of the hour, it closes at 1.08110. Since 1.08110 is higher than 1.08010, this is a bullish candlestick — probably green on your chart. The body shows you the fight between 1.08010 and 1.08110, while the wicks show you the extreme territory explored during the battle. Now flip it: same prices, but imagine it opens at 1.08110, touches that same high of 1.08150, drops to 1.07980, but closes at 1.08010. Now the close is lower than the open — that's a bearish red candle. Same price action, different story depending on who won by the closing bell.
§4The weird exceptions nobody warns you about
Okay, here's where things get a little quirky. First, JPY pairs — they just have to be different, right? While most currency pairs use four decimal places (where 0.0001 is a pip), JPY pairs like USD/JPY typically use two decimal places, so a pip is 0.01. Don't worry, your trading platform handles this automatically, but it's good to know why the numbers look different. Second, candle colors aren't set in stone. Some traders customize them — I've seen people use blue and orange, purple and yellow, even rainbow schemes (though that's a bit much before coffee). Modern platforms let you choose whatever makes your brain happy. Third, timeframes matter more than you think. A pattern on a 1-minute chart might be meaningless noise, while the same pattern on a daily chart could signal a major trend change. Oh, and during major news events? Those wicks can get crazy long as prices spike and crash in seconds. Yeah, this is where traders have blown accounts by misreading volatility as a pattern.

§5Three examples that'll make it click
Let's look at some real scenarios. First, that EUR/USD example from earlier: Open 1.08010, High 1.08150, Low 1.07980, Close 1.08110. That's a classic bullish candle — the buyers controlled the close. Range is 1.08150 - 1.07980 = 0.00170 (or 17 pips). Body size is |1.08110 - 1.08010| = 0.00100 (10 pips). Now imagine you see this after a downtrend — it could signal a reversal coming. Second, the bearish version: Open 1.08110, same high and low, Close 1.08010. That's sellers winning by 10 pips. Third, consider a doji — where open and close are nearly identical, creating a tiny or nonexistent body with potentially long wicks. This shows indecision, like both sides fought to a draw. Here's a quick comparison:
| Scenario | Type | Body Size | Key Message |
|---|---|---|---|
| Bullish EUR/USD | Green candle | 10 pips | Buyers won the hour |
| Bearish EUR/USD | Red candle | 10 pips | Sellers won the hour |
| Doji pattern | Tiny body | ~0 pips | Market indecision |
See how each tells a different story?
§6Where this thing even came from
Here's a fun story for you: candlesticks weren't invented by some Wall Street quant in a suit. They came from 18th century Japan, where a rice trader named Munehisa Homma (seriously, that's his name) noticed that prices moved based on human emotions — fear and greed, same as today. He started charting rice prices using these candle-like shapes to visualize the battle between buyers and sellers. His 1755 book, 'The Fountain of Gold,' basically laid the foundation for what we now call market psychology. Fast forward to 1991, when Steve Nison introduced these 'Japanese candlestick charts' to the Western world in his book. Before that, traders in the West were mostly using boring old bar charts. Imagine discovering this whole visual language that had been hiding in plain sight for centuries! Now, candlesticks are everywhere — from forex to stocks to crypto. Not bad for something that started with rice trading, huh?
§7Key takeaways
- Each candlestick tells a story of the battle between buyers and sellers in one timeframe — it's your market scorecard.
- Green/white means buyers won (close > open), red/black means sellers won (close < open) — the colors are your quick mood check.
- Patterns work better on higher timeframes (1-hour+) where there's less noise and more meaningful price action.
- Always use candlestick patterns with other confirmation — never risk your account on a single pretty shape.
- Candlesticks have been around since 18th century Japan, proving that market psychology hasn't changed much in 300 years.
§8Frequently asked questions
QWhat are the main parts of a candlestick?
QWhat do the colors actually mean?
QAre candlestick patterns reliable?
QWhat are some common patterns I should know?
QWhat's the best timeframe for candlestick patterns?
§See also
§References
- Japanese Candlestick Charting Techniques — Steve Nison
- The Fountain of Gold - The Three Monkey Record of Money — Munehisa Homma