
Pullback
/ˈpʊlˌbæk/since 1950s financial context, evolving with modern chartingPullback — pullback is the market taking a quick breather before continuing its main trend — like a runner pausing for water before finishing strong.
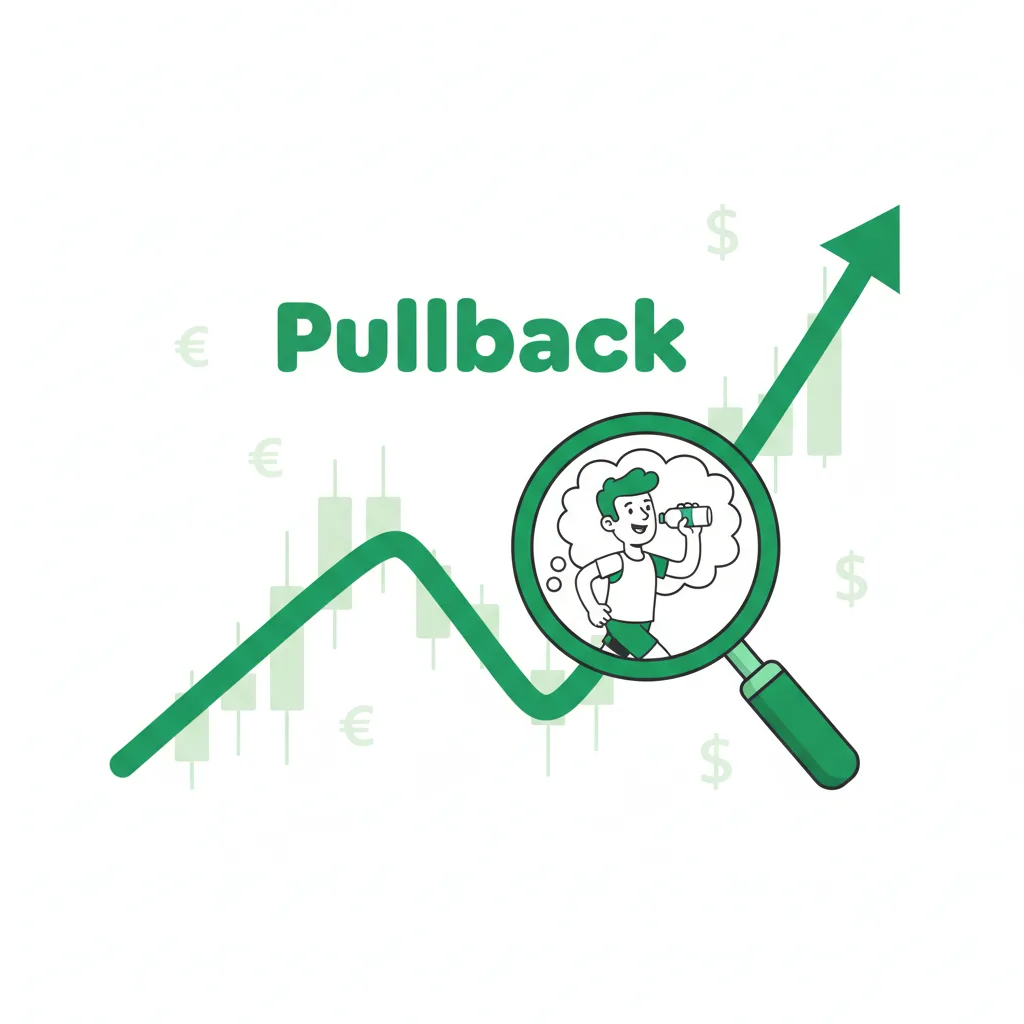
§1So, what IS a pullback anyway?
Picture this: you're watching your favorite currency pair climb steadily higher, making those beautiful higher highs and higher lows. Then suddenly — oops! — it takes a little dip. Your heart skips a beat. Is the party over? Not necessarily! That's probably just a pullback, my friend. Think of it like the market taking a quick water break during a marathon. The runner (the trend) is still headed for the finish line, but they need to catch their breath for a moment. In trading terms, a pullback is a temporary pause or dip against the prevailing trend that doesn't actually change the overall direction. It's the market saying 'Hold on, let me check my shoelaces' before continuing its journey. I've seen traders panic-sell during these moments, only to watch the trend resume without them. Trust me, I lost some good trades my first year thinking every dip was the end of the world!
§2The math (don't worry, it's friendlier than it looks)
Now, I know numbers can make some traders' eyes glaze over, but stick with me — this is simpler than it looks. There's no scary formula like E=mc² for pullbacks. Instead, we use Fibonacci retracement levels as our measuring tape. You've probably seen those golden ratio numbers floating around: 38.2%, 50%, and 61.8%. These aren't random — they're like natural resting spots where pullbacks often pause. Think of them as benches along the market's hiking trail. If the EUR/USD rallies from 1.0800 to 1.1000, then pulls back, we'd look for it to find support around 1.0950 (that's roughly a 50% retracement). The depth tells us how tired the trend is — shallow pullbacks (under 25%) show strength, while deeper ones (to 61.8%) mean the trend might be getting winded.
§3Here's how it plays out in real trading
Let's walk through this step-by-step with a real example. Say you're watching EUR/USD in an uptrend — it's climbed from 1.0800 to 1.1000. Beautiful! Then it dips back to 1.0950. That's your pullback. Now, here's what you do: First, check if this is just a breather or something more serious. Look at the 50-period moving average — is price bouncing off it? Check volume — is it dropping about 20-30% during the dip? If yes, you've likely got a genuine pullback. You could enter near 1.0950, place your stop-loss just below the recent swing low (maybe at 1.0930), and aim for the trend to resume toward 1.1100. That gives you a sweet 1:2.5 risk/reward ratio. See? You're buying the 'sale' before the trend continues its shopping spree.
§4When pullbacks play hard to get
Okay, here's the part where I give you the real talk. Pullbacks aren't always this cooperative. Sometimes the market throws curveballs. First, pullback trading only works in clear trending markets — try it in sideways chop and you'll get chopped up. I've seen traders force pullback entries in ranging markets and, well, let's just say it wasn't pretty. Second, major news events can turn a innocent pullback into a full-blown reversal faster than you can say 'interest rate decision.' And about those Fibonacci levels — sometimes price blows right through them like they're not even there. That's when you need to respect price action more than pretty lines on your chart. Remember: the market doesn't read textbooks!

§5Three examples that'll make it click
Let's look at some concrete scenarios. First, the classic uptrend pullback: EUR/USD rallies from 1.0800 to 1.1000, dips to 1.0950, then resumes to 1.1100. You buy at 1.0950, stop at 1.0930, target 1.1100 — that's 200 pips potential vs 20 risk. Second, the moving average bounce: Price pulls back to the 50-period EMA on the hourly chart and bounces like it's on a trampoline. Third, the breakout retest: EUR/USD breaks above resistance at 1.0850, pulls back to retest it as support, then rockets higher. Here's a quick comparison:
| Scenario | Pair | Entry | Exit | P&L |
|---|---|---|---|---|
| Uptrend Pullback | EUR/USD | 1.0950 | 1.1100 | +150 pips |
| MA Bounce | EUR/USD | 1.0920 | 1.1050 | +130 pips |
| Breakout Retest | EUR/USD | 1.0855 | 1.0950 | +95 pips |
See how each gives you a better entry than chasing the initial move?
§6Where this 'pulling back' idea even came from
The term 'pullback' has been around longer than you might think. It originally meant 'the act of pulling back' way back in the 1660s — think pulling a rope or retreating. By the 1950s, it picked up a military meaning for orderly troop withdrawals. Financial folks probably borrowed it because, let's face it, watching prices retreat can feel like a strategic withdrawal sometimes! The specific trading application evolved alongside technical analysis in the latter 20th century. While markets have always had temporary dips (even during wild times like the Weimar hyperinflation or 2008 crisis), giving it a specific name helped traders distinguish between 'just a breather' and 'the trend is actually changing.' It's one of those concepts that's simple but powerful — once you see it, you can't unsee it on your charts.
§7Key takeaways
- Pullbacks are temporary — they typically last just 3-5 candles before the trend resumes.
- Use Fibonacci levels (38.2%, 50%, 61.8%) as natural resting spots to identify where pullbacks might end.
- Always aim for at least a 1:2 risk/reward ratio — patience here pays off big time.
- This strategy only works in trending markets — don't try it when the market's going sideways!
§8Frequently asked questions
QWhat's the difference between a pullback and a reversal?
QAre pullbacks actually profitable to trade?
QHow do I spot a pullback on my charts?
QDoes this work in sideways markets?
QWhat's the opposite of pullback trading?
§See also
§References
- Pullback: A Comprehensive Trading Briefing — The Trading Mentor Research