
Volatility
Voh-luh-TIL-ih-teesince 1931 (in finance)Volatility — how much and how fast prices jump around — basically the market's mood swings on caffeine.
§1So, what IS volatility anyway?
Picture the market as an ocean. Some days it's a calm lake where prices barely ripple — that's low volatility. Other days, it's a stormy sea with waves crashing everywhere — hello, high volatility! Volatility measures how much and how fast prices move. It's not about direction (up or down), but about the size and speed of those moves. Think of it as the market's energy level. When volatility is high, prices are jumping around like a toddler on sugar. When it's low, they're moving like a sloth on a lazy Sunday. I've seen traders get excited about high volatility because big moves mean big opportunities, but trust me, they've also blown accounts over this — it's like trying to ride a bucking bronco without knowing how to hold on. You'll hear traders say 'the market is volatile today' and what they really mean is 'prices are moving fast and far, so buckle up!'
§2The math (don't run away — it's simpler than it looks!)
Okay, I know 'standard deviation' sounds like something from a scary statistics textbook, but stick with me. Imagine you're measuring how far your dog wanders from your feet during a walk. Some days he stays close (low deviation), other days he chases squirrels everywhere (high deviation). Volatility calculation works similarly. First, you find the average price over a period — that's your 'feet.' Then you measure how far each price point strays from that average, square those differences (so negatives don't cancel positives), average those squares (that's variance), and take the square root. Voilà — standard deviation! The bigger the number, the more your 'dog' (prices) is running around. There's also ATR (Average True Range), which is like measuring the daily 'stretch' of prices — how far they reach from high to low. If EUR/USD has an ATR of 0.0080, it's stretching about 80 pips on average each day. See? Not so scary!
§3Here's how it plays out in real life
Let's say you're watching EUR/USD. Yesterday it closed at 1.0800. Today, during the European session, it jumps to 1.0810, drops to 1.0790, then rallies to 1.0820 — that's volatility in action! Now imagine USD/ZAR. This pair doesn't just wiggle — it does full-on acrobatics. It might open at 18.5000, shoot up to 18.6500, crash to 18.4000, and finish at 18.5500, all in one day. That's 1500 pips of movement! Meanwhile, EUR/CHF might just yawn and move 30 pips total. Here's the thing: volatility isn't constant. It breathes. During Asian session, major pairs often nap (low volatility). When London and New York overlap? The party starts (higher volatility). And when big news hits — like a Fed announcement — volatility can spike like a startled cat. I remember my first year trading, I entered during what I thought was 'normal' movement, only to watch my position swing 200 pips against me in minutes. Lesson learned: always check the market's pulse before jumping in.
§4The weird exceptions nobody warns you about
Okay, let's talk about the market's quirky cousins. First, JPY pairs. While most pairs count pips at the fourth decimal (like EUR/USD at 1.0801), JPY pairs use the second decimal (USD/JPY at 145.50). So a 10-pip move in USD/JPY is 145.50 to 145.60, not 145.50 to 145.5010. Yes, it's weird — just roll with it. Then there's liquidity. Exotic pairs like USD/TRY or GBP/JPY often have lower trading volumes, which means they can jump around more dramatically with less money moving them. It's like trying to turn a speedboat versus an oil tanker. And weekend gaps! The market closes Friday and reopens Sunday/Monday, but the world keeps spinning. If big news hits over the weekend, prices can 'gap' — open at a completely different level than they closed. I've seen traders set weekend orders only to find them filled way beyond where they expected come Monday morning. Always check your risk on Fridays!

§5Three examples that'll make it click
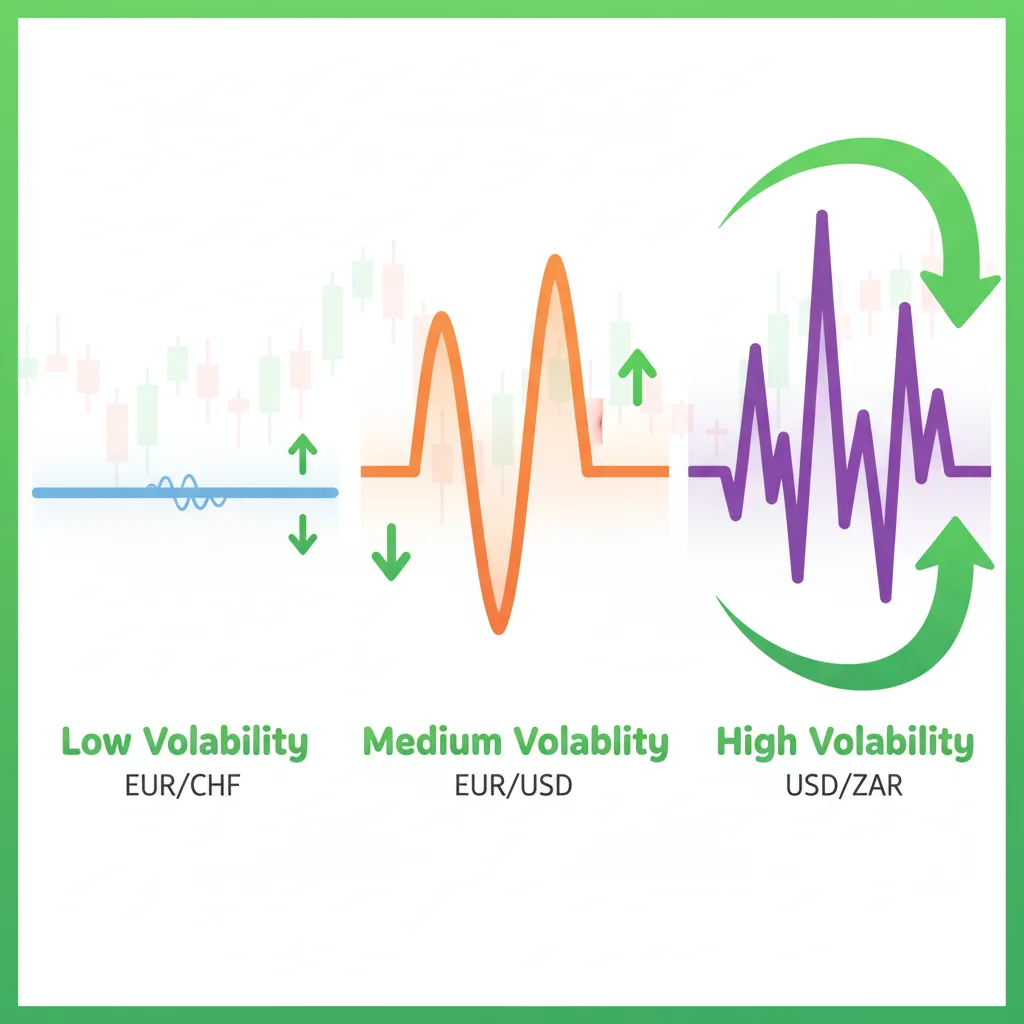
Let's look at three different volatility personalities:
| Scenario | Pair | Typical Daily Range | What It Feels Like |
|---|---|---|---|
| Calm & Steady | EUR/CHF | 20-40 pips | A gentle stroll in the park. Predictable, quiet, maybe a bit boring for thrill-seekers. |
| Moderately Active | EUR/USD | 50-100 pips | A brisk walk with occasional jogging. Enough movement to trade, not enough to give you whiplash. |
| Extreme Acrobat | USD/ZAR | 1000-1500+ pips | Riding a rollercoaster blindfolded. Exciting but dangerous without proper preparation. |
Imagine you're day trading GBP/JPY (nicknamed 'The Dragon' for its fiery moves). It might open at 185.00, surge to 186.50 on UK data, then plunge to 184.00 when risk sentiment shifts — that's 250 pips of volatility in hours! Meanwhile, USD/HKD barely budges thanks to its currency peg, usually stuck between HK$7.7500 and HK$7.7600. The key takeaway? Match your trading style to the pair's personality. Don't try to scalp during EUR/CHF's nap time, and don't swing trade USD/ZAR without expecting some serious turbulence.
§6Where this thing even came from
The word 'volatility' comes from Latin 'volare' — to fly. Originally it described things that evaporated quickly (like they were flying away). By the 1600s, it meant anything prone to sudden change. But finance didn't really embrace it until 1931, when analysts started using it to describe stock market swings. Then history gave us some unforgettable volatility lessons. Black Monday in 1987 saw the Dow drop 22.6% in one day — talk about prices flying downward! The 2008 financial crisis turned markets into rollercoasters for years. And who could forget March 2020? When COVID-19 hit, volatility spiked so high that even veteran traders were wide-eyed. The VIX (the 'fear gauge') shot above 80! Meanwhile, in the extreme category, Weimar Germany's hyperinflation in the 1920s showed what happens when currency volatility goes completely bananas — prices doubling in hours. Today, we measure volatility more precisely, but the human emotions behind it? Those haven't changed much.
§7Key takeaways
- Volatility measures how much and how fast prices move — it's the market's energy level, not its direction.
- High volatility pairs like USD/ZAR can move 1500+ pips daily, while calm ones like EUR/CHF might only move 30.
- Always check volatility before trading — entering a volatile market without a plan is like surfing a tsunami without a board.
- Use tools like ATR to measure volatility objectively; if EUR/USD's ATR is 0.0080, expect about 80 pips of daily movement.
§8Frequently asked questions
QWhat causes forex volatility?
QHow is volatility measured in forex?
QIs high volatility good for trading?
QWhich forex pairs are the most volatile?
QWhich forex pairs are the least volatile?
§See also
§References
- Historical Market Volatility Events — Financial History Archives
- Forex Volatility Metrics and Pairs Analysis — Trading Mentor Research