

I watched my screen, convinced I'd nailed it.

David van der Merwe
Trader des Marchés Émergents ·  South Africa
☕ 11 min de lecture
Ce que vous apprendrez :
- 1What Candle Patterns Are (And What They Definitely Aren't)
- 2The Patterns You Actually Need to Know (South African Context)
- 3The 3 Biggest Mistakes South African Traders Make
- 4Putting It All Together: A Real Trade Plan
- 5SA Regulations & Costs: What Actually Matters for Your Trading
- 6Leveling Up: Confluence and Multi-Timeframe Analysis
- 7Practical Tools & Platforms for South African Traders
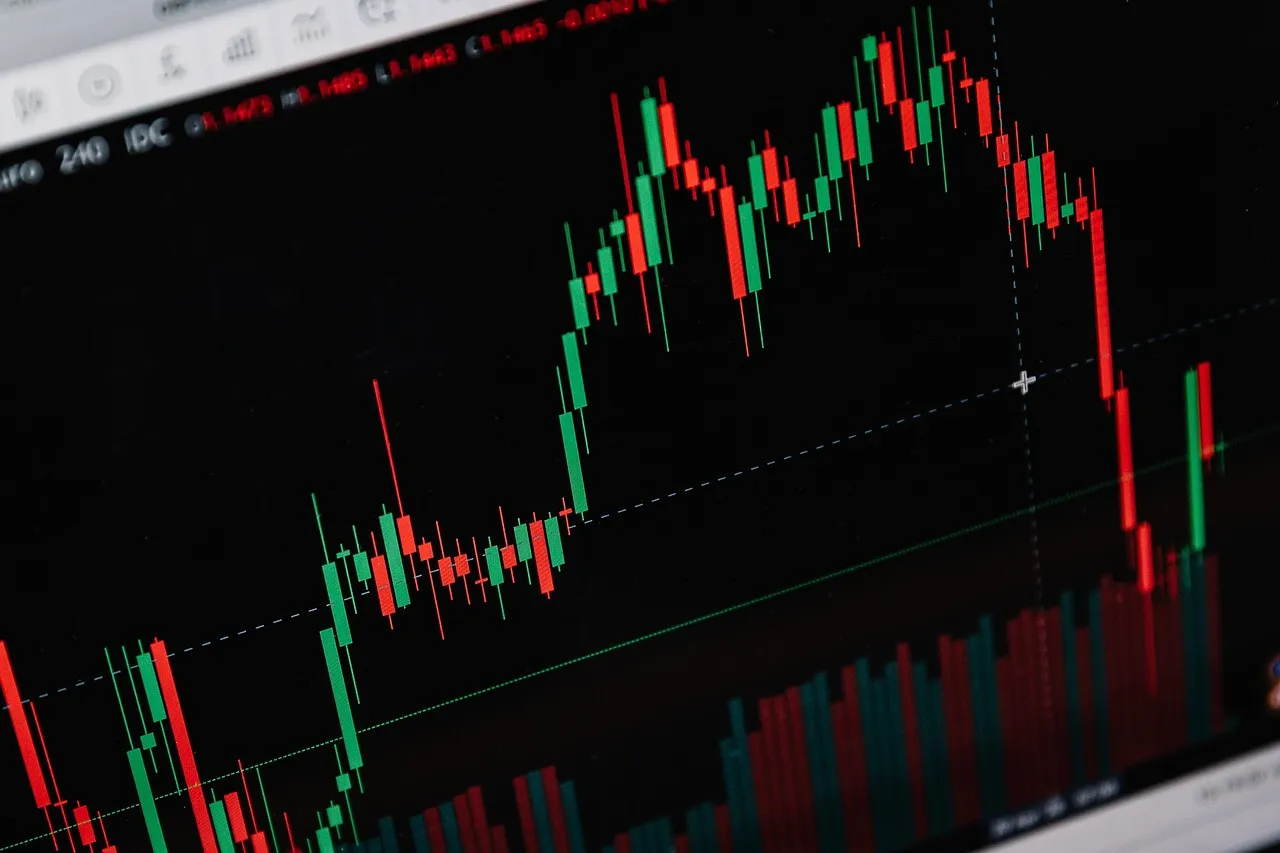
I watched my screen, convinced I'd nailed it. A perfect bullish engulfing pattern on the USD/ZAR daily chart. I went all in, risking 5% of my account. The market didn't just ignore my signal, it reversed and took out my stop loss. That one trade, a R4,200 loss, wasn't about the pattern being wrong. It was about me misunderstanding everything around it: the context, the position size, the fact that a single candle doesn't care about my analysis. Most traders here blow up not because they can't spot a doji or a hammer, but because they treat these patterns like holy scripture instead of the probabilistic, context-dependent clues they are. Let's talk about how to use them properly in our market.
A candle pattern is just a visual representation of the battle between buyers and sellers over a specific time period. The open, high, low, and close tell a story. A long green candle shows buyers dominated. A small candle with wicks on both ends shows indecision. That's it.
They are not crystal balls. They don't predict the future. They give you a snapshot of sentiment at a point in time. The biggest mistake I see from new traders in Johannesburg to Cape Town is treating a pattern as a "trade now" signal. It's not. It's a clue that needs confirmation.
Think of it like seeing brake lights on the N1 highway. It's a signal something might be happening ahead. It doesn't tell you if it's a minor slowdown or a massive crash. You need more information before you slam on your own brakes or change lanes. In trading, that extra information comes from support/resistance, trend, and volume.
Warning: No candle pattern has a 100% success rate. Anyone selling you a system based purely on patterns is lying. The most reliable patterns might work 60-65% of the time in the right context. You need a risk/reward edge to make that profitable.
I learned this the hard way early on. I'd see a hammer at what I thought was support and enter immediately. Half the time, price would just slice right through it. The pattern didn't fail; my understanding of where it was forming did. The location of the pattern is often more important than the pattern itself.

💡 Conseil de Winston
A candle pattern is a symptom, not a cause. Diagnose the market's condition first, then see if the pattern confirms your diagnosis.
“The location of a candle pattern is often more important than the pattern itself.”
You don't need to memorize 50 patterns. You need to know about 10 really well, and understand the two main categories: reversal and continuation.
Reversal Patterns: The Market Might Be Changing Its Mind
These form at the end of a trend. They suggest the prevailing momentum is exhausting.
- Hammer and Hanging Man: Single candle patterns. Small body at the top, long lower wick (hammer at bottom, hanging man at top). The wick should be at least 2x the body. I look for these after a clear downtrend (hammer) or uptrend (hanging man).
- Bullish and Bearish Engulfing: Two-candle patterns. The second candle's body completely 'engulfs' the first. A bullish engulfing after a drop shows buyers aggressively stepping in. This is the pattern that fooled me on USD/ZAR, but I ignored it was happening right at a major psychological resistance level of R19.00.
- Morning and Evening Star: Three-candle patterns. A small indecision candle (the star) gaps away from a long trend candle, then a strong candle confirms the reversal. These are powerful but relatively rare on lower timeframes.
Continuation Patterns: The Trend is Taking a Breather
The trend is still in force, but there's a brief pause.
- Rising/Falling Three Methods: A strong trend candle, followed by 3+ small counter-trend candles that stay within the range of the first candle, then another strong trend candle in the original direction. It shows consolidation before the trend resumes.
- Doji: Open and close are virtually the same. Pure indecision. On its own, it means little. At a key support or resistance level, it becomes a warning sign that momentum is stalling.
Example: Let's say you're trading EUR/USD and you see a bearish engulfing pattern form right at a major resistance level that has held three times before, and the RSI indicator is showing overbought above 70. That's a high-probability context. The pattern is the final piece of evidence, not the only piece.
For trading our local pairs like USD/ZAR, remember they can be more volatile. A hammer on the ZAR might have a much longer wick than on the Euro. You need to adjust your visual expectations for the pair's typical range.
“A pattern is a probability, not a promise. You must define your stop loss and position size before you enter.”
After mentoring traders here for years, the blow-ups follow a pattern.
- Trading Patterns in Isolation: This is the killer. Seeing a hammer on the 5-minute chart and entering without checking the daily trend. If the daily chart is in a strong downtrend, that 5-minute hammer is likely just a tiny pullback, not a reversal. Always trade in the direction of the higher timeframe trend. A pattern against the trend is a low-probability setup.
- Ignoring the Spread on Exotic Pairs: You spot a perfect doji signaling a reversal on EUR/ZAR. You enter. But the spread is 14 pips. For the trade to even go breakeven, the market has to move 14 pips in your favor before it moves 1 pip in your direction. Many patterns need immediate momentum to work. A wide spread can eat that momentum alive before your trade gets going. Always factor in the spread definition and costs, especially with brokers offering ZAR accounts.
- No Clear Risk Management: "This pin bar looks so good, I'll just risk a bit more." Famous last words. A pattern is a probability, not a promise. You must define your stop loss and position size before you enter. Using a position size calculator is non-negotiable. I don't care how perfect the evening star looks, if risking 5% on it would blow your account in 20 losses, you're gambling. The FSCA's 30:1 use limit helps, but you can still over-use a small account easily.
My own painful lesson on mistake #1: I was scalping GBP/USD during the London session. I saw a beautiful bullish engulfing on the 15-minute chart and entered long. What I missed was that on the 1-hour chart, price had just been rejected from a massive resistance level. My "perfect" pattern failed in 20 minutes. I lost R800. The pattern was fine. My tunnel vision was the problem.

“A pattern is a probability, not a promise. You must define your stop loss and position size before you enter.”
Let's walk through a disciplined approach using a pattern. We'll use a hypothetical trade on XAU/USD (Gold), a popular asset here.
Step 1: The Big Picture. Open the daily chart. Is gold in an uptrend, downtrend, or range? Let's say it's in a clear uptrend, making higher highs and higher lows. Our bias is to look for buy opportunities.
Step 2: Find a Potential Zone. Zoom to the 4-hour chart. Look for areas of previous support, or where price might pull back to a rising trendline. Let's say price is pulling back towards a previous resistance level that should now act as support, around $2320.
Step 3: Wait for the Pattern and Confirm. On the 1-hour chart, price approaches $2320. We wait. A hammer forms right on that level. Good sign. Now, we don't buy yet. We wait for the next candle to close above the hammer's high. This is our confirmation candle. That's the trigger.
Step 4: Define the Trade Mechanics.
- Entry: Buy stop order placed 1 pip above the high of the hammer, triggered on confirmation.
- Stop Loss: Place 1 pip below the low of the hammer. Let's say that's a 15-pip risk.
- Take Profit: We aim for a risk-reward ratio of at least 1:2. So, our target is 30 pips above entry.
- Position Size: Our account is R20,000. Our risk per trade rule is 1%. That's R200 risk. With a 15-pip stop loss, and a pip value on XAU/USD of roughly R10 for a mini lot, we can calculate our lot size. (R200 risk) / (15 pips * R10 per pip) = 1.33 mini lots. We round down to 1.3 lots.
This process forces patience and removes emotion. The pattern was just the entry signal. The trend, support level, and risk management did the heavy lifting. For more on trading gold, our XAU/USD guide breaks down its unique behavior.
💡 Conseil de Winston
The most expensive candle you'll ever see is the one you trade out of desperation, not plan. If you're forcing a pattern to fit, you've already lost.
“Confluence gives you reasons to trade; risk management gives you the right to stay in the game.”
You can know every pattern in the book, but if you don't understand the rules of the game here, you'll get hurt.
FSCA is Your Friend: Only use brokers regulated by the Financial Sector Conduct Authority. This isn't a suggestion. It ensures client money segregation, fair treatment, and gives you a recourse if things go wrong. Check their FSP number. Brokers like IG, AvaTrade, and Exness have local FSCA licenses.
The 30:1 use Limit: This is a good thing for retail traders. It prevents the insane 500:1 use that can vaporize an account in seconds. Even at 30:1, you can over-use. On a R10,000 account, 30:1 gives you R300,000 in buying power. One bad trade with too much size can still do massive damage.
The Real Cost: Spreads & Commissions This is critical for pattern trading. If your profit target is 20 pips, a 5-pip spread on USD/ZAR means the market has to move 25 pips for you to make 20. It changes the math. Compare brokers:
| Broker (FSCA Regulated) | Typical EUR/USD Spread | Typical USD/ZAR Spread | Key Model |
|---|---|---|---|
| IC Markets | 0.0 - 0.1 pips + commission | ~5 pips | Raw/ECN |
| Exness | From 0.0 pips | From 5 pips | Raw/ECN & Standard |
| XM | From 0.8 pips | Wider | Commission-free |
| Plus500 | ~1.3 pips | Wider | Spread-only, CFD focus |
For frequent scalping strategy on patterns, low spreads are crucial. For longer-term swing trading, a slightly wider spread matters less.
Tax (SARS): This isn't a trading cost, but a reality. Profits are income. Keep a detailed log of every trade. The pattern might get you into the trade, but your trade journal is what keeps you out of trouble with SARS.
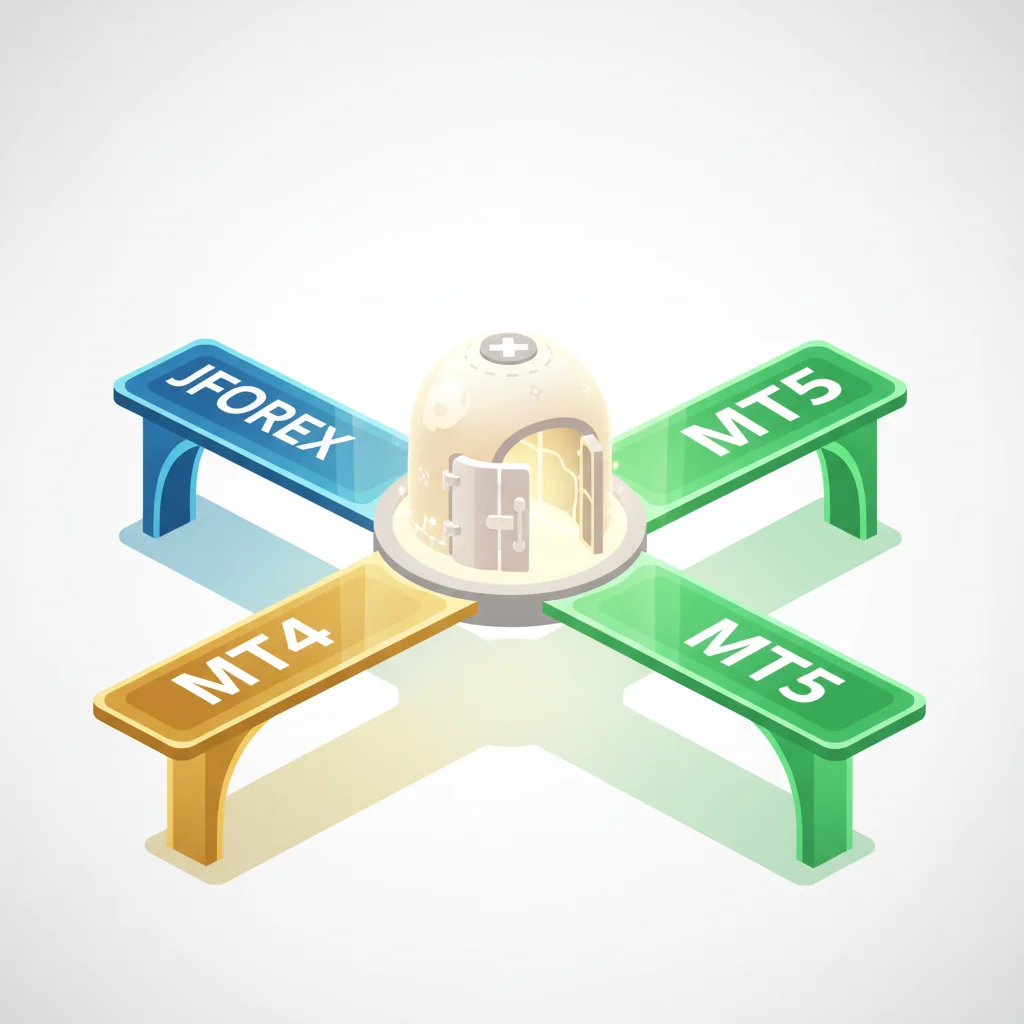
Executing a precise trade plan from a candle pattern often requires advanced order types, which Pulsar Terminal seamlessly adds to your MT5 platform for better risk management.
Pulsar Terminal
L'outil MT5 tout-en-un : ordres glisser-déposer, multi-TP/SL, trailing stop, grid trading, Volume Profile et protection prop firm. Utilisé quotidiennement par 1 000+ traders.

“Confluence gives you reasons to trade; risk management gives you the right to stay in the game.”
This is where you graduate from being a pattern spotter to a trader.
Confluence means multiple technical factors agreeing at the same point. A single bullish pattern gives you one reason to buy. Confluence gives you three or four. Look for:
- A candle pattern (e.g., Bullish Engulfing).
- At a key support level (previous swing low, Fibonacci 61.8% retracement).
- With a momentum indicator like the MACD indicator showing a potential bullish crossover.
- And maybe a trendline support touch.
The more factors that line up, the higher the probability of the trade working. But remember, nothing is guaranteed. This is why you still need a stop loss.
Multi-Timeframe Analysis (MTFA): I use a simple 3-tier system.
- High (Daily/4H): Determines the trend. Only take pattern trades in the direction of this trend.
- Medium (1H/4H): Finds the trade setup and key levels.
- Low (15M/1H): Finds the precise entry pattern and trigger.
A bearish pattern on your low timeframe while the high timeframe is strongly bullish? It's probably just a pullback. Avoid it, or if you're advanced, look for a much smaller counter-trend opportunity with tight risk.
Pro Tip: Don't chase patterns. If you miss the entry confirmation candle, let it go. There will always be another setup. The market is not going anywhere. Revenge trading after a missed pattern is a sure path to a margin call.
💡 Conseil de Winston
Your broker's spread is part of the pattern's anatomy. A 10-pip wide spread on USD/ZAR is like a 10-pip headwind before you even start. Factor it into your risk or choose a different pair.
“The FSCA's 30:1 use limit helps, but you can still over-use a small account with poor position sizing.”
You need the right environment to spot and act on these patterns.
MetaTrader is King: MT4 and MT5 are ubiquitous for a reason. Their charting is excellent for candle analysis. Most FSCA-regulated brokers offer them. You can easily adjust candle timeframes, add indicators for confluence, and set alerts.
Broker Platforms: Some brokers like IG or Plus500 have their own powerful platforms. Test them out on demo accounts. See which one feels intuitive for you to quickly analyze candles and place trades.
The Game Changer (When Used Correctly): While MT5 is great, managing complex trades with multiple take-profit levels or trailing stops can be clunky. This is where a tool designed to enhance MT5 becomes valuable.
Payment & Accounts: Use a broker that offers ZAR accounts and local bank transfer deposits/withdrawals. It saves you from double currency conversion fees. Depositing Rands into a USD account adds an invisible cost to every trade you take.
Start with a demo account. Practice spotting patterns and defining your trade plans for a month. Then move to a small live account. The goal in the beginning is not to make money, but to execute your plan correctly. The profits will follow if your process is sound.
FAQ
Q1What is the most reliable forex candle pattern?
There isn't one single 'most reliable' pattern. Success depends entirely on context. However, multi-candle reversal patterns like the bullish/bearish engulfing or morning/evening star, when confirmed and occurring at major support/resistance levels, tend to have higher statistical probability. Remember, even the best pattern fails often enough that you must use a stop loss.
Q2How many pips should I target with candle patterns?
There's no fixed number. Your target should be based on the market structure, not the pattern. Look for the next logical area of resistance (for a buy) or support (for a sell). The key is that your potential reward (in pips) should be meaningfully larger than your risk (the distance to your stop loss). Aim for a minimum risk-reward ratio of 1:1.5, with 1:2 or better being ideal.
Q3Can I use candle patterns alone to trade forex profitably?
Almost certainly not. Using patterns alone is like driving while only looking at the brake lights of the car in front of you. You need to see the whole road (trend), know the rules (support/resistance), and have a plan for a crash (risk management). Patterns are a valuable entry tool, but they are just one component of a complete trading strategy.
Q4Are candle patterns different on South African Rand (ZAR) pairs?
The patterns themselves are the same, but their behavior can be different due to higher volatility and wider spreads. A pin bar on USD/ZAR might have much longer wicks than on EUR/USD. You must account for the wider spread when calculating your risk and potential reward, as it can significantly impact the viability of short-term pattern trades.
Q5What timeframe is best for trading candle patterns?
It depends on your style. Swing traders might use 4-hour or daily charts for higher-probability, lower-frequency setups. Scalpers might use 5 or 15-minute charts. The most important principle is multi-timeframe analysis: use a higher timeframe to determine the trend, and a lower one to fine-tune your entry. Never trade a pattern on a low timeframe that goes against the higher timeframe trend.
Q6Do I need to pay tax on profits from trading forex candle patterns in South Africa?
Yes. The South African Revenue Service (SARS) views consistent forex trading profits as income, not capital gains. You are required to declare this income and will be taxed at your marginal income tax rate. It is crucial to keep detailed records of all trades, deposits, and withdrawals for tax purposes.
Q7How do I avoid fakeouts with candle patterns?
Use confirmation. Don't trade the pattern as it forms; wait for the next candle to close in the direction you expect. Also, trade with confluence. A pattern at a clear, tested support level is stronger than one in the middle of nowhere. Finally, accept that fakeouts are part of the game. A good pattern with a proper stop loss will see you take a small, controlled loss on a fakeout, not a catastrophic one.
La leçon du Prof. Winston
Points clés:
- ✓Trade patterns with the higher timeframe trend, not against it.
- ✓Always wait for a confirmation candle to close before entering.
- ✓Calculate position size based on risk (%), not hope.
- ✓Wider spreads on ZAR pairs require larger profit targets.
- ✓A pattern plus support/resistance is powerful; a pattern alone is weak.
Cet article vous a-t-il été utile ?
Cliquez sur une étoile
Analyses Trading Hebdo
Analyses et stratégies hebdo gratuites. Pas de spam.
À propos de l'auteur
David van der Merwe
Trader des Marchés Émergents
Trader basé à Johannesbourg avec 11 ans d'expérience sur les devises des marchés émergents. Spécialisé dans les paires ZAR, le trading régulé par la FSCA et l'analyse du marché sud-africain.
Commentaires
Avertissement sur les risques
Le trading d'instruments financiers comporte des risques importants et peut ne pas convenir à tous les investisseurs. Les performances passées ne garantissent pas les résultats futurs. Ce contenu est fourni à titre éducatif uniquement et ne constitue pas un conseil en investissement. Effectuez toujours vos propres recherches avant de trader.
Vous aimerez aussi

Cara Trading Forex Sukses: 7 Prinsip dari Trader Profesional
Cara trading forex sukses dengan 7 prinsip trader pro: manajemen modal, disiplin, journal trading, backtest. Data nyata, bukan janji profit palsu.
Jam Trading Forex Terbaik untuk Trader Indonesia: Panduan Lengkap dengan Tabel Waktu
Panduan jam trading forex untuk trader Indonesia. Tabel 4 sesi dunia, jam emas 20:00-00:00, sesi mana yang harus dihindari. Data akurat + tips dari trader berpengalaman.
Top 5 Sàn Forex Uy Tín Nhất 2026: Review Jujur dari Trader Indonesia
Top 5 sàn forex uy tín 2026 untuk trader Indonesia. Review jujur: spread, deposit, withdraw, dukungan lokal. Exness, XM, IC Markets & lebih.
Obtenir Pulsar Terminal
Tous ces calculateurs sont intégrés dans Pulsar Terminal avec des données en temps réel de votre compte MT5. Dimensionnement de position en un clic, gestion automatique des risques et calculs instantanés.
Obtenir Pulsar Terminal