Grid Trading Strategy (2026): Complete Setup & 70% Win Rate
Grid trading places orders every 10–30 pips for profits in ranging markets, with backtests on EURCHF (2018–2023) showing win rates above 70%.

Daniel Harrington
Analis Trading Senior · Spesialis MT5
☕ 4 min baca
Ikhtisar Strategi — Grid Trading
| Timeframe | M5, M15, H1 |
| Periode Penahanan | Jam ke hari |
| Risiko / Imbal Hasil | Variable |
| Tingkat Kesulitan | Mahir |
| Instrumen Terbaik | EURUSD, EURCHF, AUDNZD, USDJPY |
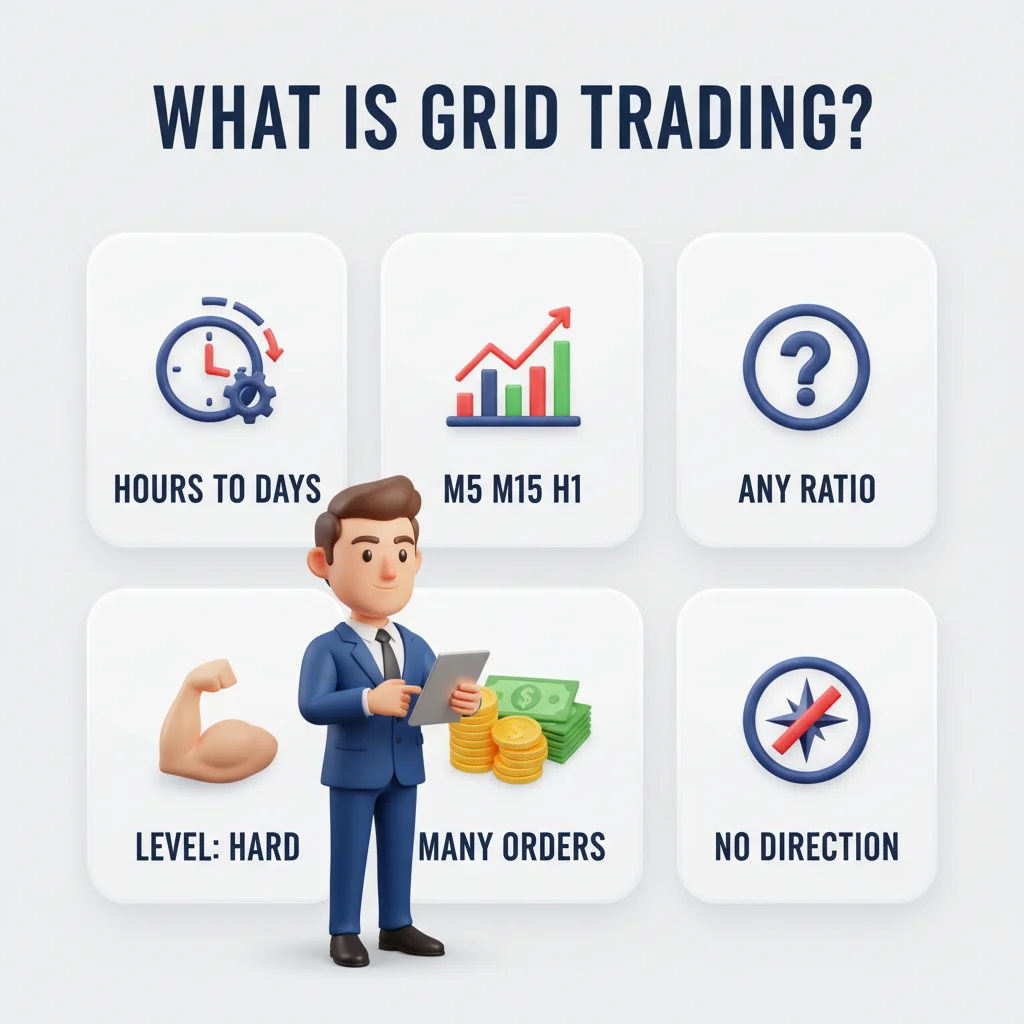
Grid trading in a nutshell: place orders at regular intervals above and below price. Profit from natural market bouncing — no need to predict direction.
Grid trading generates profits from price oscillations by placing orders every 10–30 pips across a defined range — no directional bias required. Backtests on EURCHF from 2018–2023 show win rates above 70% in ranging conditions, but a single trending move without hard stops can wipe 3–5 weeks of gains in hours.
Poin Penting
- Currency pairs like EURCHF and AUDNZD spend roughly 65–70% of trading time in consolidation phases, according to range a...
- Start setup on H1 to identify the range, then drop to M15 or M5 to time your initial activation. Step 1 — Define the gr...
- Here's the uncomfortable truth about grid trading: the strategy has no natural stop loss per trade. That means risk mana...
1Why Grid Trading Works on Low-Volatility Pairs
Currency pairs like EURCHF and AUDNZD spend roughly 65–70% of trading time in consolidation phases, according to range analysis across 2019–2023. That structural behavior is the entire foundation of grid trading — you're not predicting where price goes, you're collecting small profits every time it oscillates through your predefined levels.
The mechanics are simple: place buy limit orders below current price at fixed intervals, and sell limit orders above it. When price drops 20 pips, a buy fires. When it bounces back, that position closes at profit. Rinse, repeat. Each filled order targets a take profit equal to the grid spacing.
The ATR indicator is what separates disciplined grid traders from gamblers. On H1 EURUSD, ATR(14) typically reads between 8 and 18 pips. Grid spacing below the ATR value means price chops through your entire grid in a single candle — you accumulate positions faster than they close. Set spacing at 1.0–1.5x the current ATR reading to give each level room to breathe.
Best instruments by grid suitability: EURCHF (lowest average daily range, tightest oscillations), AUDNZD (strong mean-reversion tendency), EURUSD (high liquidity, low spread — typically 0.1–0.3 pips raw), USDJPY (works well during Tokyo session consolidation). Avoid trending instruments like GBPJPY or commodity currencies during high-volatility macro events.

Cast a wide net, catch profits at every level. Grid trading places orders at regular intervals — like a fishing net that captures moves in both directions.
2Grid Trading Entry and Exit Rules: Exact Parameters
Start setup on H1 to identify the range, then drop to M15 or M5 to time your initial activation.
Step 1 — Define the grid boundary. Use weekly pivot points (PP, R1, R2, S1, S2) combined with visible S/R zones. The grid should fit entirely within S1 and R1 — that's typically 40–100 pips on EURUSD. If the distance between S1 and R1 exceeds 120 pips, the range is too wide for a standard grid; wait for a tighter session.
Step 2 — Calculate grid spacing. Pull ATR(14) on H1. Multiply by 1.2 and round to the nearest 5 pips. Example: ATR reads 12 pips → spacing = 15 pips. For EURCHF with ATR near 6 pips, spacing drops to 8–10 pips.
Step 3 — Set grid levels. Place 3–5 buy limit orders below current price at each spacing interval. Mirror with 3–5 sell limit orders above. Each order carries a TP equal to one grid interval. No individual SL on grid orders — the hard stop is a maximum drawdown limit on the entire grid (see Risk Management section).
Step 4 — Exit conditions. Close the entire grid manually (or via automation) when: price breaks and closes beyond R2 or S2 on H1; a major news event (NFP, central bank decision) is within 4 hours; or total open drawdown hits your max loss threshold. Do not let the grid run through a trend. A clean grid typically completes within 4–48 hours on M15/H1 setups.
Grid trading places orders at fixed intervals. Like a net catching fish at every price level.

Arrows at every intersection. Grid trading does not predict direction — it profits from movement itself, buying and selling at predetermined levels.
“Here's the uncomfortable truth about grid trading: the strategy has no natural stop loss per trade.”
3Grid Trading Risk Management: Position Sizing and Hard Limits
Here's the uncomfortable truth about grid trading: the strategy has no natural stop loss per trade. That means risk management must operate at the portfolio level, not the order level.
Maximum grid exposure rule: Never commit more than 2% of account equity per grid level. On a $10,000 account with 5 grid levels, each order should risk no more than $20 — that's approximately 0.02 lots on EURUSD with 10-pip spacing.
Total grid drawdown cap: Set a hard maximum of 6–8% account drawdown for the entire grid. Once that threshold is hit, close everything. No exceptions. This is the single rule that separates traders who survive grid blowups from those who don't.
Margin buffer: Grid trading consumes margin as more orders fill. Maintain at least 300% free margin relative to required margin when all grid levels are active simultaneously. Calculate worst-case: if all 5 buy orders fire and price drops to S2 before reversing, what's the total floating loss? That number must stay below your 6–8% hard cap.
Correlation risk: Running grids on EURUSD and EURCHF simultaneously is not diversification — both are EUR pairs and will trend together during EUR-specific events. Run only one EUR grid at a time, or hedge with a non-correlated pair like AUDNZD.
Practical example: Account size $5,000. Grid on EURUSD, H1. ATR = 14 pips, spacing = 20 pips. 4 buy limits + 4 sell limits. Position size per order = 0.02 lots. Max drawdown cap = $350 (7%). If all 4 buy orders fill and price drops 80 pips from entry, floating loss ≈ $64 — well within limit. If price drops 200 pips without reversal, loss approaches $160 — still within cap, but the grid should be closed on the S2 break rule before that point.
Fitur Pulsar Terminal untuk Grid Trading
- Sistem trading grid
- Level SL/TP berganda
- Kalkulator ukuran posisi
- Manajemen risiko
Broker Teratas
Alat Trading
Hitung ukuran posisi Anda untuk Grid Trading
Kalkulator Ukuran Posisi
Hitung ukuran lot optimal berdasarkan manajemen risiko Anda
Berdasarkan lot forex standar ($10/pip). Sesuaikan untuk instrumen berbeda. Selalu verifikasi dengan broker Anda.
Kalkulator Risiko/Reward
Visualisasikan rasio risiko/reward sebelum masuk perdagangan.
Berdasarkan nilai pip standar forex ($10/pip/lot). Nilai aktual dapat bervariasi.
Kalkulator Pertumbuhan Majemuk
Proyeksikan pertumbuhan modal dengan bunga majemuk.
Hanya proyeksi hipotetis. Return masa lalu tidak menjamin hasil di masa depan. Trading mengandung risiko kerugian.
Sesi Perdagangan Forex (UTC)
Jam buka dan tutup setiap pasar forex utama.
Waktu ditampilkan dalam UTC. Jam aktual dapat bervariasi tergantung broker dan DST.
Terapkan Strategi Ini
Tentang Penulis
Daniel Harrington
Analis Trading Senior
Daniel Harrington adalah Analis Trading Senior dengan gelar MScF (Master of Science in Finance) yang mengkhususkan diri pada manajemen aset dan risiko kuantitatif. Dengan pengalaman lebih dari 12 tahun di pasar forex dan derivatif, ia membahas optimasi platform MT5, strategi trading algoritmik, dan wawasan praktis untuk trader ritel.

Kuasai Grid Trading dengan Pulsar Terminal
Pulsar Terminal memberikan alat canggih untuk mengeksekusi strategi Grid Trading di MetaTrader 5 dengan presisi.
Dapatkan Pulsar TerminalPeringatan Risiko
Perdagangan instrumen keuangan mengandung risiko signifikan dan mungkin tidak cocok untuk semua investor. Kinerja masa lalu tidak menjamin hasil di masa depan. Konten ini hanya untuk tujuan edukasi dan tidak boleh dianggap sebagai nasihat investasi. Selalu lakukan riset Anda sendiri sebelum trading.