
Resistance
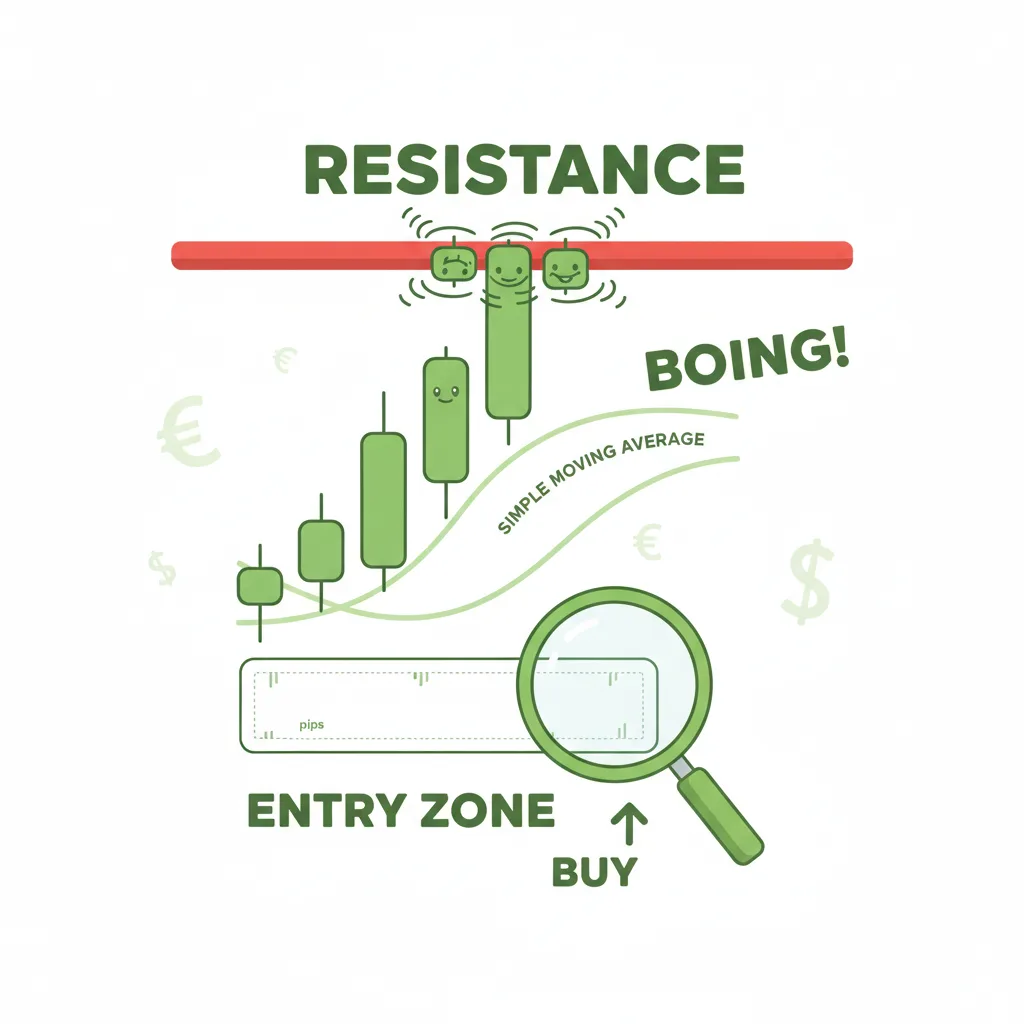
ri-ZIS-tunssince Early 20th century charting eraResistance — that price ceiling where an uptrend hits a wall of sellers and struggles to climb higher — think of it as the market's 'nope, not today' level.
§1So, what IS resistance anyway?
Okay, picture this: you're at a party, and the price of EUR/USD is trying to climb the stairs to the next floor. But there's a bouncer at the top step saying 'sorry, full up here!' That bouncer? That's resistance. It's not some magical line — it's simply a price level where enough traders think 'hey, this is getting expensive, time to sell' that their collective selling pressure stops the uptrend in its tracks. I've seen traders blow accounts because they didn't respect these levels. Think of it as the market's collective memory: 'Last time we got to 1.1500, things got ugly, so let's not do that again.' It's where supply finally overwhelms demand, and the party pauses. Pretty simple, right? But oh boy, does it matter.
§2The math (don't worry, it's friendlier than it looks)
Here's the secret: there's no single 'resistance formula' you plug numbers into. Nope! Instead, we use tools that hint at where resistance might form. Think of them like weather forecasts — not perfect, but super helpful. Pivot points take yesterday's high, low, and close to project today's potential ceilings. Moving averages (like the 200-day MA) create dynamic resistance that slopes with the trend — imagine a moving ceiling that adjusts as prices dance. Fibonacci retracements draw horizontal lines at key percentages (38.2%, 50%, 61.8%) between swings. The cool part? These aren't rigid lines but zones — typically 20-50 pips wide on EUR/USD daily charts. So you're looking for areas, not laser-precise numbers. Simpler than it sounds, I promise!
§3Here's how you actually spot resistance in real life
Let's walk through this together. First, pull up a chart — say EUR/USD daily. Look for places where price tried to rally but got slapped back down multiple times. See that level around 1.1500 where it peaked three times last month? That's classic resistance. Now, check if round numbers like 1.2000 are nearby — traders love those psychological levels. Next, draw a trendline connecting those swing highs; if it slopes down, that's dynamic resistance. Finally, add a 200-day moving average — if price is below it and bouncing off, that's resistance too. You'll see zones, not single lines. For GBP/USD, resistance zones might be 30-60 pips wide because it's feistier. The key? Multiple confirmations. If two tools point to the same area, that bouncer is probably real.
§4The weird stuff nobody warns you about
Alright, time for the exceptions — because markets love to be cheeky. First, false breakouts: price briefly pops above resistance then crashes back down, like a fake high-five. Wait for a candle to close above before celebrating. Second, role reversal: once resistance breaks decisively, it often flips to become support. Mind-blowing, right? That old ceiling becomes your new floor. Third, dynamic resistance from moving averages or trendlines — these move, so you can't just set and forget. Fourth, repeated testing can actually weaken resistance as orders get eaten up. And yes, JPY pairs like USD/JPY quote with two decimals instead of four, so your 'pip' thinking shifts slightly. But hey, that's trading — always keeping you on your toes!

§5Three real examples that'll make it click
Let's get concrete. Example 1: EUR/USD struggles at 1.1500 multiple times. You sell near 1.1490, place a stop-loss just above 1.1520 (beyond the zone), and ride the drop. Example 2: GBP/USD hits 1.33860, bounces, then later faces resistance at 1.3500. That's your new ceiling. Example 3: USD/CHF can't break 0.8250 for weeks — that's strong resistance. Here's a quick comparison:
| Scenario | Pair | Resistance Level | What Happened | Why It Matters |
|---|---|---|---|---|
| Classic Ceiling | EUR/USD | 1.1500 | Price rejected 3x | Strong historical level |
| Psychological | EUR/USD | 1.2000 | Round number stall | Traders place orders here |
| Dynamic | Any pair | 200-day MA | Price bounces off sloping line | Moving resistance adapts |
See? Real prices, real reactions. My first year, I ignored these and learned the hard way — don't be me!
§6Where this whole resistance thing came from
Let's take a quick history trip. Traders have been drawing lines on charts since, well, forever — but resistance really took off in the 20th century as technical analysis evolved. Picture old-school traders noticing that prices kept hitting a ceiling and reversing. They called it 'resistance' from the Latin 'resistentia' (to stand against), which is pretty literal — prices standing against further gains. This wasn't just lines on paper; it reflected the timeless tug-of-war between supply and demand. As charting tools improved, concepts like pivot points and moving averages added math to the art. Today, it's fundamental — but it all started with simple observation: markets have memory, and ceilings matter. Not bad for a concept older than your grandpa's trading journal!
§7Key takeaways
- Resistance zones are typically 20-50 pips wide on EUR/USD daily charts — they're areas, not thin lines.
- Once broken, resistance often becomes support — that old ceiling turns into your new floor.
- Use multiple tools to confirm resistance: historical peaks, moving averages, and round numbers like 1.2000.
- False breakouts are common — wait for a candle close above resistance before calling it a breakout.
§8Frequently asked questions
QWhat does trade resistance mean?
QHow do you identify resistance levels?
QHow do traders use resistance in their strategy?
QWhat happens when resistance is broken?
QWhat's the difference between support and resistance?
§See also
§References
- Technical Analysis of the Financial Markets — New York Institute of Finance
- BabyPips School of Pipsology — BabyPips