

I got absolutely wrecked on a EUR/USD trade back in 2019.

James Mitchell
Analista de Trading Sênior
☕ 12 min de leitura
O que você vai aprender:
- 1What Is the 3 Ducks System? No Fluff, Just the Rules
- 2Why ATR is the 3 Ducks' Best Friend (And My Early Mistake)
- 3My ATR Period Recommendation: What Actually Works on Charts
- 4Putting It All Together: A Real Trade Example (XAU/USD)
- 5Common Pitfalls and How to Avoid Them
- 6Broker Considerations for US Traders
- 7Refining Your Edge: Next Steps

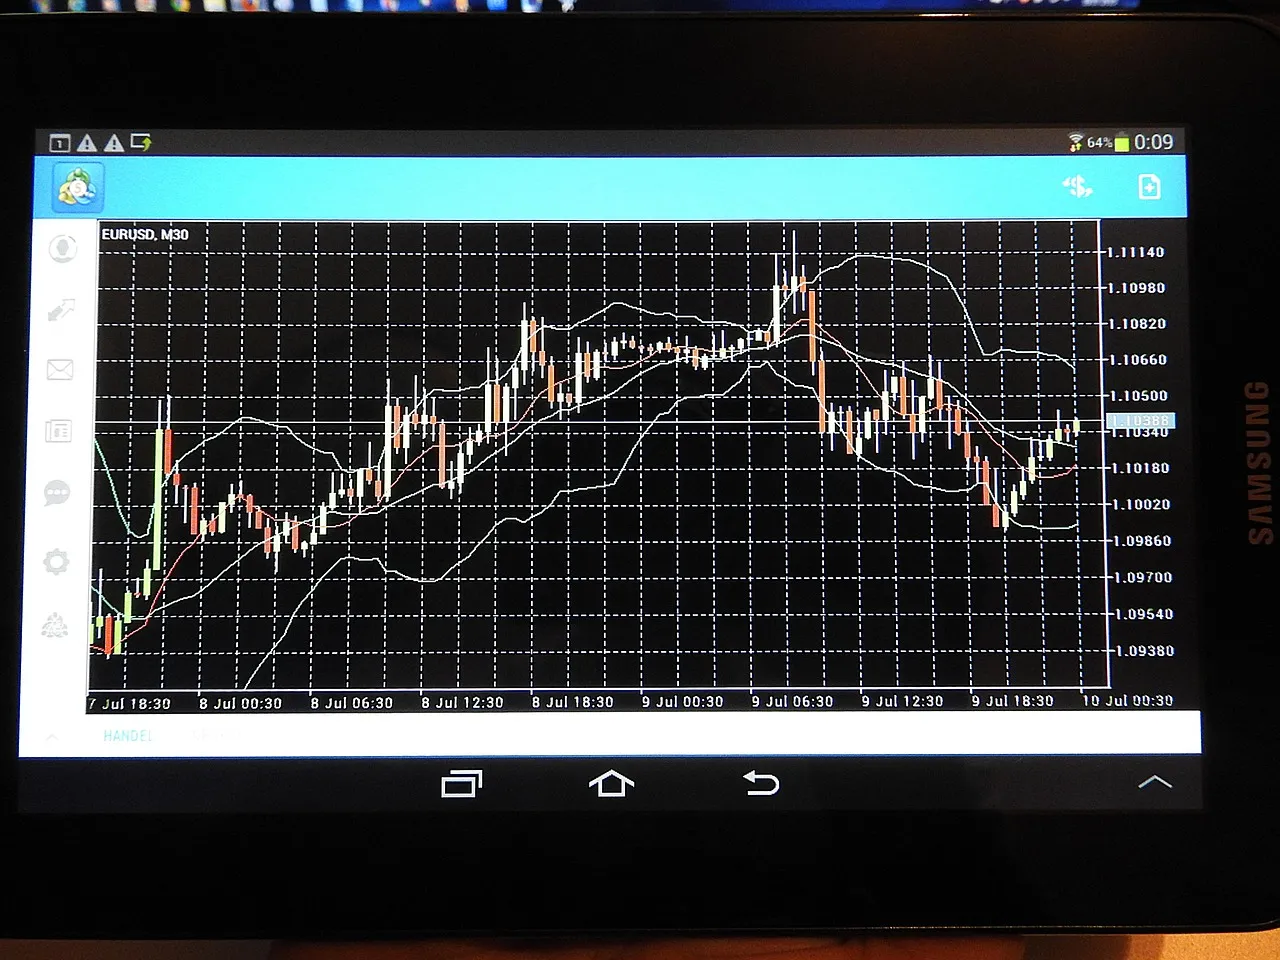
I got absolutely wrecked on a EUR/USD trade back in 2019. I had a perfect 3 Ducks setup on the 4H, 1H, and 5M charts, price was above the 60 SMA on all three. I entered long at 1.1250, feeling like a genius. Then, a routine US jobs report came out, volatility spiked, and my fixed 30-pip stop-loss got taken out instantly. Price reversed and then shot right back up to my original target without me. I lost $300 on a trade that would have made $450. That painful lesson taught me the 3 Ducks tells you when to trade, but it doesn't tell you how much the market can move. That's where getting the right ATR period recommendation for forex trading becomes non-negotiable.
Forget complex theories. The 3 Ducks system, created by Andy Perry, is a pure trend-following method. It's brutally simple, which is why it works when you stick to it. The core idea is that a strong trend shows itself on multiple timeframes. You're waiting for all your charts to 'line up' and quack in the same direction.
Here’s the setup, exactly how I run it:
- The First Duck (Mama Duck): The 4-hour chart. This defines the major trend. I use a 60-period Simple Moving Average (SMA). If price is above it, the long-term bias is up. Below it, bias is down.
- The Second Duck (Papa Duck): The 1-hour chart. This confirms the trend's direction on a medium-term basis. Same 60 SMA rule applies.
- The Third Duck (Baby Duck): The 5-minute or 15-minute chart. This is for your entry trigger. You only take trades in the direction the first two ducks are pointing.
The Only Signal You Need: For a buy, price must be above the 60 SMA on the 4H, 1H, AND your entry chart (5M/15M). For a sell, price must be below the 60 SMA on all three. That's it. No exceptions. If one chart is out of alignment, you sit on your hands. This discipline filters out a ton of noise and keeps you on the right side of the bigger moves.
Warning: The biggest mistake I see? Traders trying to be clever and taking a 'counter-trend' entry because the 5-minute chart looks oversold, even when the 4H trend is strong against them. The 3 Ducks is not a reversal system. It's a 'go with the flow' system. Fighting it is a sure way to lose money.

💡 Dica do Winston
The 60 SMA isn't a magnet. Price will oscillate around it. Your job is to wait for the *cluster* of closes on one side across all timeframes, not just a single touch.
“The 3 Ducks tells you when to trade, but the ATR tells you how much room the market needs to breathe.”
My failed EUR/USD trade I mentioned earlier? That was a classic case of using a static stop-loss in a dynamic market. A 30-pip stop might be fine on a calm Tuesday afternoon but it's a death sentence during a high-impact news event. The 3 Ducks gives you direction, but it says nothing about the market's current mood or volatility. That's a fatal gap.
Enter the Average True Range (ATR). This indicator doesn't care if price is going up or down. It only measures how much price is moving, on average, over a given period. It tells you the market's current level of 'energy.'
How ATR Fixes the 3 Ducks' Weak Spot
When you get a perfect 3 Ducks alignment, you know you have a high-probability trend trade. The ATR tells you how much room that trend needs to breathe. Using it for your stop-loss means your trade has a volatility-adjusted buffer. On a quiet day, your stop will be tighter. On a volatile day, it widens out, preventing you from being stopped out by normal, noisy price swings that don't actually break the trend.
I learned this the hard way. After that EUR/USD loss, I started placing stops at 2x the daily ATR. On another trade, GBP/USD, the ATR was only 50 pips. My 100-pip stop felt huge, but the market chopped around in a 90-pip range for hours before finally taking off in my direction. That stop held, and the trade was a winner. The ATR gave the trade the space it needed.
Using a tool like a position size calculator that incorporates ATR is a game-saver. It lets you adjust your lot size so that a wider, ATR-based stop doesn't blow up your account. You risk the same dollar amount whether the ATR is 30 pips or 100.

“A static stop-loss in a dynamic market is like bringing a knife to a gunfight.”
Here’s where most blog posts get it wrong. They just parrot 'use the default 14-period ATR.' For the 3 Ducks system, that's often not optimal. The period you choose dictates what 'average' volatility you're measuring.
After years of testing and losing money with the wrong settings, here’s my breakdown:
| ATR Period | What It Measures | Best For in 3 Ducks | My Verdict |
|---|---|---|---|
| 7-10 Periods | Short-term, recent volatility. Very reactive. | 5-minute chart entries. Captures the immediate noise you need to avoid. | My top pick for the 'Baby Duck' (entry chart). It's fast enough to adapt to changing intraday conditions. |
| 14 Periods (Default) | The standard 'medium-term' volatility. | A decent, all-purpose setting if you only want one ATR on your screen. | It's okay, but not ideal. It can be a bit slow for 5M entries and a bit noisy for 4H trend assessment. |
| 20-25 Periods | Longer-term average volatility. Smoother. | The 4-hour 'Mama Duck' chart. Helps set a stop-loss that respects the trend's broader volatility. | My recommendation for the trend-defining chart. It ignores short-term spikes and gives you the big picture. |
My Specific Setup:
- On my 4H chart: I use a 22-period ATR. It's smooth and helps me understand the overall volatility environment of the trend I'm trying to follow.
- On my 5M entry chart: I use a 9-period ATR. It's snappy and gives me a real-time sense of how wild the price action is at the moment I'm clicking 'buy' or 'sell.'
Pro Tip: Don't just look at the ATR line's value. Watch its slope. If the ATR on your 5-minute chart is rising sharply as you get a signal, pause. It means volatility is expanding, often right before a big move or a reversal. It might be better to wait for it to settle, even if the Ducks are aligned.
“A static stop-loss in a dynamic market is like bringing a knife to a gunfight.”
Let's walk through a live trade I took last month on gold (XAU/USD). This is where the ATR period recommendation for forex trading (and CFDs) turns into real dollars.
The Setup (All times in EST):
- Mama Duck (4H Chart): Price was above the 60 SMA. Trend bias: UP. The 22-period ATR readout was $18.50. This meant the average daily range for gold was about $18.50.
- Papa Duck (1H Chart): Price was also above the 60 SMA. Confirmation: UP.
- Baby Duck (5M Chart): Price pulled back to the 60 SMA and bounced. All three Ducks were aligned long. My 9-period ATR on this chart was $4.20.
The Entry & Risk Management:
- I entered the buy at $2,332.40 per ounce.
- For my stop-loss, I used the 5M chart's ATR. I placed my stop at 1.8 x ATR below my entry. $4.20 * 1.8 = ~$7.56. I rounded down and set my stop at $2,324.80 (a $7.60 stop).
- My profit target was a 2:1 risk-to-reward ratio. I placed my take-profit at $2,347.60 (a $15.20 gain).
- Using my position size calculator, with a $5,000 account balance and a 1% risk ($50), my stop distance of $7.60 meant I could buy 0.66 lots. ($50 / $7.60 = ~6.58, /10 for mini lots = 0.66).
The Result: The trade ran for about 6 hours. Price dipped after entry but never came close to my ATR-based stop. It hit my target just after the London open. Net profit: $100.32.
Why did this work? The 4H ATR told me the trend had significant room to move ($18.50 average). The 5M ATR gave me a stop-loss that was appropriate for the intraday noise. A fixed 10-point stop would have been hit. A fixed 20-point stop would have meant risking more money than necessary. The ATR made it precise. For more on trading gold, check out our XAU/USD guide.
💡 Dica do Winston
Write down your ATR stop calculation (Period x Multiple) on a sticky note. Seeing it physically before every trade prevents emotional adjustment mid-trade.


“Your best edge isn't a secret indicator; it's the discipline to follow a simple, rules-based system like 3 Ducks through both wins and losses.”
I've blown up a small account or two figuring this out, so learn from my errors.
Pitfall 1: Ignoring Higher Time Frame Context. You get a perfect 3 Ducks buy signal on EUR/USD on the 5M chart... but the weekly chart is smack in the middle of a massive resistance zone. The 3 Ducks is mechanical, but you're not a robot. Always do a quick sanity check on the daily or weekly. If there's a huge obvious level, maybe wait for a break or avoid the trade. Our EUR/USD guide covers key levels.
Pitfall 2: Using ATR for Take-Profit Targets. This is a subtle one. While ATR is great for stops, using it for profit targets can cut winners short. Trends can run much farther than recent volatility suggests. I prefer a fixed risk-to-reward (like 1:2 or 1:3) or trailing my stop with the trend once I'm in profit.
Pitfall 3: Trading During Low Volatility. When the 4H ATR is at multi-week lows, the 3 Ducks system often produces whipsaws. The trends are weak and choppy. I've sat through days of tiny losses in these conditions. Now, if the ATR is extremely low, I just reduce my position size by half or skip trades until volatility expands. Indicators like the MACD indicator or RSI indicator can sometimes help confirm momentum in these flat markets, but it's best to just trade less.
Pitfall 4: Not Adjusting for the Pair. The ATR value for EUR/JPY is naturally larger than for EUR/CHF. A 1.5x ATR stop on one is not the same dollar risk as on the other. Always, always calculate your position size based on the dollar value of your ATR stop, not just the pip distance. This is the number one cause of inconsistent risk.
Managing multiple ATR-based stop-losses and take-profit levels across several 3 Ducks trades is far easier with a tool like Pulsar Terminal, which lets you drag and drop orders directly on your MT5 charts.
Pulsar Terminal
A ferramenta MT5 tudo-em-um: ordens drag-and-drop, multi-TP/SL, trailing stop, grid trading, Volume Profile e proteção prop firm. Usado diariamente por 1.000+ traders.

“Your best edge isn't a secret indicator; it's the discipline to follow a simple, rules-based system like 3 Ducks through both wins and losses.”
Trading in the US is a different ballgame. We're limited to brokers regulated by the CFTC and NFA, like OANDA, FOREX.com, and IG US. This is actually a good thing - your money is safer. But it affects how you trade the 3 Ducks.
Spreads & Execution: During volatile periods (like when your 3 Ducks signal hits), spreads can widen. An ATR-based stop that's 15 pips away might effectively become a 17-pip stop if the spread balloons. I factor in a typical spread for the pair when calculating my stop distance. If EUR/USD usually has a 1-pip spread, I might use (1.8 x ATR) + 1 pip.
No Hedging: A key US rule: you can't hedge. You can't have a long and short position open on the same pair at the same time. This changes how you might manage a losing 3 Ducks trade. You can't just flip to a short on a smaller timeframe. You must close the losing trade first. It forces discipline, but it also removes a potential risk-management tactic.
Platform Choice: You'll likely be on MetaTrader 4/5 or the broker's own platform. Make sure you can easily apply multiple timeframes and custom ATR periods. The good US brokers like OANDA have strong platforms for this style. I've found their execution to be reliable for the quick entries the 3 Ducks sometimes requires on the 5-minute chart.
Remember, your broker is your lifeline. A few dollars in extra spread or a slippage-filled execution can turn a winning 3 Ducks + ATR strategy into a loser. Do your homework. Read our deep dives on FOREX.com and other regulated options to find the best fit for active trading.
“I use a 9-period ATR for the 5-minute entry chart and a 22-period ATR for the 4-hour trend chart. This two-speed approach is what made the system click for me.”
The 3 Ducks with my ATR settings is a complete, strong system. But the real work begins now: building your experience.
1. Backtest & Forward Test: Don't risk real money yet. Go back on your charts and find 50 past 3 Ducks signals. Apply the 9-period ATR stop on the 5M chart. How many would have hit your stop before the target? Use a demo account for a month and track every trade in a journal. Note the ATR value at entry every single time.
2. Integrate Price Action: The system gets even better when you add simple price action. I look for my 5M entry to coincide with a retest of a previous support/resistance level or a small bullish/bearish candlestick pattern right at the 60 SMA. It just adds another layer of confirmation.
3. Manage the Trade: Your job isn't done at entry. If the trade goes in your favor by 1.5x your risk, I often move my stop to breakeven. It turns a potential loser into a risk-free trade. For longer holds, you can consider a trailing stop based on a slower ATR (like the 22-period) to lock in profits on a swing trading scale.
4. Know When to Walk Away: This system works best in trending markets. It will lose money in ranging, choppy markets. If you get 2-3 stopped-out trades in a row, check the higher timeframes. Is the market just chopping sideways? If yes, turn off your screens. Go for a walk. The best trade is sometimes the one you don't take. Preserving capital for the next clear trend is a skill in itself.
Start simple. Master the basic alignment and the ATR stop. Once that's second nature, then you can start adding your own nuances. But the core - three timeframes, one moving average, and a volatility-adjusted stop - is powerful enough on its own.

FAQ
Q1Can I use the 3 Ducks system for scalping?
You can, but I wouldn't recommend it as your primary method. The 3 Ducks is a trend-following system, and trends need a bit of time to develop. Trying to use it on, say, a 1-minute chart for scalping strategy will result in a lot of whipsaws and false signals. It's better suited for trades that last several hours to a few days.
Q2What's the best time of day to trade the 3 Ducks system?
The sweet spot is during overlapping market sessions when volatility and volume are high - like the London-New York overlap (8 AM to 12 PM EST). This is when trends are most likely to get established and follow through. Trading during the dead zone of the Asian session often leads to weak, choppy moves that can stop you out easily.
Q3Why a 60-period SMA and not a 50 or 200?
The 60-period is the system's rule. It's not magic, but it's a medium-term average that smooths out noise without being too laggy. I've tested 50 and 200. Fifty was too jumpy on the 4H chart, giving false alignments. Two hundred was too slow, causing you to miss most of the move. Sixty is a good compromise that Andy Perry landed on through testing, and in my experience, it works.
Q4How do I calculate my position size with an ATR stop?
First, determine your ATR stop distance in pips. Let's say your 5M chart ATR is 10 pips and you use a 2x multiple: your stop is 20 pips. Next, decide your risk per trade (e.g., 1% of a $10,000 account = $100). The value per pip depends on your lot size (1 standard lot = ~$10/pip for EUR/USD). To risk $100 with a 20-pip stop: $100 / 20 pips = $5 per pip. That means you'd trade 0.5 standard lots. Always use a position size calculator to do this precisely.
Q5Is the 3 Ducks system profitable?
It can be, but it's not a 'set and forget' money printer. No system is. Its profitability depends entirely on your discipline in waiting for perfect alignments, your skill in using ATR for risk management, and your ability to avoid trading in ranging markets. My own results improved dramatically once I integrated the ATR stops. It has positive expectancy when you stick to the rules and manage your losses tightly.
Q6Can I use this on stocks or crypto?
Absolutely. The principle is universal. I've used it on S&P 500 ETFs and Bitcoin. Just remember: adjust your ATR multiples because the volatility of these assets is much higher than most forex pairs. A 2x ATR stop on Bitcoin might be a $2,000 move - you need to size your position accordingly to avoid a margin call.
Lição do Prof. Winston
Pontos-chave:
- ✓Use a 9-period ATR on your 5-minute entry chart for stops.
- ✓Apply a 22-period ATR on your 4-hour chart for trend context.
- ✓Set stops at 1.5x to 2.5x your 5-minute ATR value.
- ✓Never trade against the 4-hour 60 SMA trend.
- ✓Always calculate position size based on dollar risk of your ATR stop.
Quão útil foi este artigo?
Clique em uma estrela
Insights de Trading Semanal
Análises e estratégias semanais grátis. Sem spam.
Sobre o autor
James Mitchell
Analista de Trading Sênior
Sediado em Nova York com mais de 9 anos de experiência em trading. Focado nos principais pares USD, desafios de prop firms e o cenário regulatório dos EUA.
Comentários
Aviso de risco
A negociação de instrumentos financeiros envolve riscos significativos e pode não ser adequada para todos os investidores. O desempenho passado não garante resultados futuros. Este conteúdo é apenas para fins educacionais e não deve ser considerado aconselhamento de investimento. Sempre conduza sua própria pesquisa antes de negociar.
Você também pode gostar

Cara Trading Forex Sukses: 7 Prinsip dari Trader Profesional
Cara trading forex sukses dengan 7 prinsip trader pro: manajemen modal, disiplin, journal trading, backtest. Data nyata, bukan janji profit palsu.
Jam Trading Forex Terbaik untuk Trader Indonesia: Panduan Lengkap dengan Tabel Waktu
Panduan jam trading forex untuk trader Indonesia. Tabel 4 sesi dunia, jam emas 20:00-00:00, sesi mana yang harus dihindari. Data akurat + tips dari trader berpengalaman.
Top 5 Sàn Forex Uy Tín Nhất 2026: Review Jujur dari Trader Indonesia
Top 5 sàn forex uy tín 2026 untuk trader Indonesia. Review jujur: spread, deposit, withdraw, dukungan lokal. Exness, XM, IC Markets & lebih.
Obter Pulsar Terminal
Todas essas calculadoras estão integradas ao Pulsar Terminal com dados em tempo real da sua conta MT5.
Obter Pulsar Terminal