Swing Trading Strategy Guide: H4 & D1 Timeframes
Master swing trading on H4 and D1 charts. Learn entry rules, RSI/MACD setups, 1:2–1:3 risk:reward targets, and how to execute with Pulsar Terminal.

Daniel Harrington
Senior Trading Analyst · MT5 Specialist
☕ 3 min read
Strategy Overview — Swing Trading
| Timeframes | H4, D1 |
| Holding Period | Days to weeks |
| Risk / Reward | 1:2 - 1:3 |
| Difficulty | intermediate |
| Best Instruments | EURUSD, GBPUSD, XAUUSD, US30, BTCUSD |
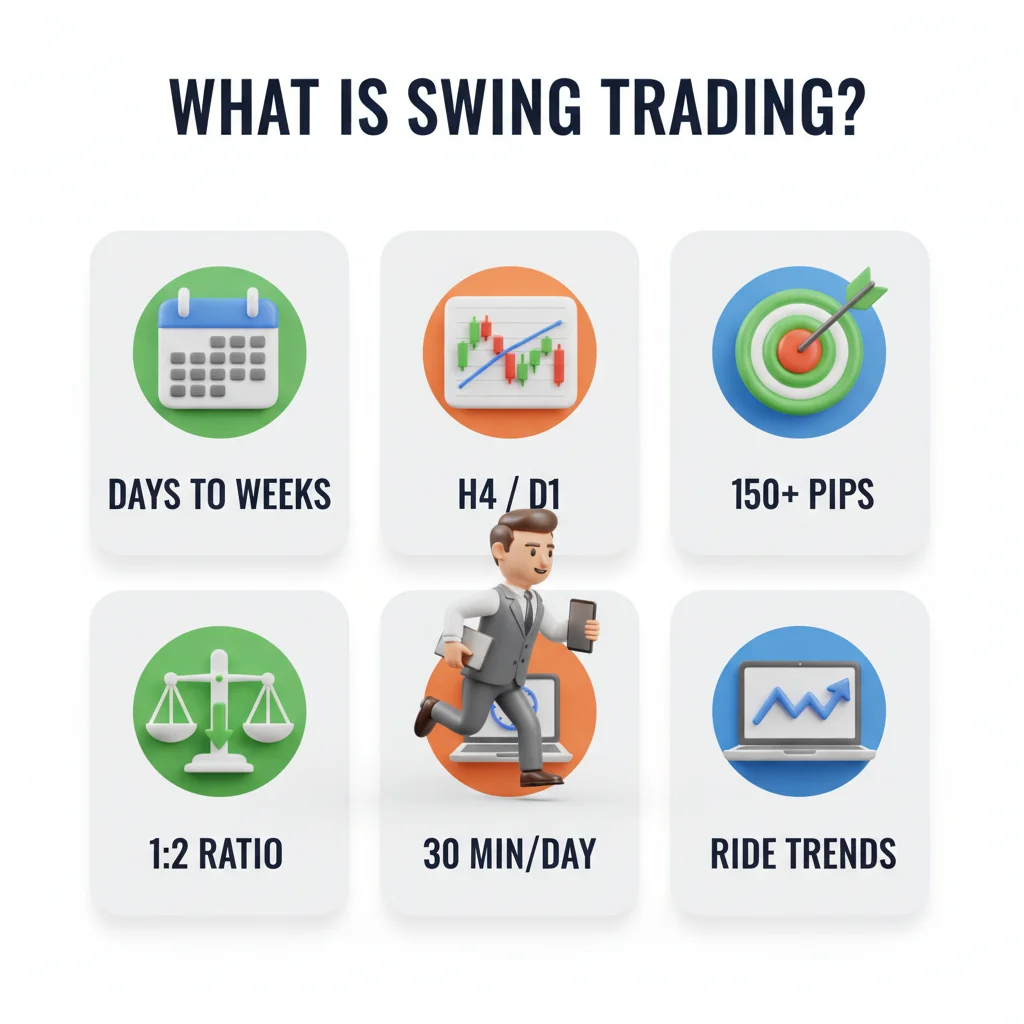
Swing trading in a nutshell: hold for days to weeks on H4/D1 charts, target 150–400 pips with a 1:2 risk-reward, and only spend 30–60 minutes per day on analysis.
Swing trading targets multi-day price moves lasting 2 to 14 days, with studies showing that disciplined swing traders on major pairs like EURUSD can capture 150–400 pip moves per setup. The strategy sits between day trading's exhausting screen time and position trading's months-long waits — giving you meaningful profit potential while only requiring 30–60 minutes of chart analysis per day.
Key Takeaways
- Markets don't move in straight lines. Even during strong uptrends, price routinely retraces 38%–61.8% of the prior impul...
- Every swing trade requires three confirmations before entry. Miss one, skip the trade. Step 1 — Identify the Trend on D...
1Why Swing Trading Works: The Market Structure Edge
Markets don't move in straight lines. Even during strong uptrends, price routinely retraces 38%–61.8% of the prior impulse move before continuing higher — a pattern so consistent it forms the backbone of Fibonacci retracement analysis, formalized in modern technical trading since the 1980s.
Swing trading exploits this rhythm. The core premise: price alternates between impulse moves (strong directional thrusts) and corrective moves (pullbacks or consolidations). Your job is to enter near the end of a correction and ride the next impulse.
The H4 and D1 timeframes are the sweet spot for this approach. H4 filters out the noise that destroys intraday traders, while D1 confirms the broader trend context. A setup that aligns on both timeframes carries significantly higher probability than one visible only on lower charts.
Fundamental catalysts matter here too. A swing trade held for a week will intersect with economic releases — NFP, CPI, central bank decisions. These events don't invalidate technical setups; they amplify them. A technically sound EURUSD long entry placed two days before a dovish Fed statement can deliver 200+ pips in a single session. The combination of technical timing and fundamental tailwind is what separates swing trading from pure pattern recognition.
The risk:reward profile of 1:2 to 1:3 means you can be wrong on 40% of trades and still grow your account. That mathematical cushion is the strategy's most underappreciated feature.

Pendulum precision. Swing trading captures the natural oscillation of price between levels — enter at the extremes, exit at the middle, repeat the rhythm.

Swing from vine to vine. Swing trading catches multi-day moves by jumping between key levels — each swing is an opportunity, each vine a new trade.
2Swing Trading Entry and Exit Rules: Step-by-Step Setup
Every swing trade requires three confirmations before entry. Miss one, skip the trade.
Step 1 — Identify the Trend on D1 Use a 50-period EMA and 200-period EMA. Price above both EMAs = bullish bias. Price below both = bearish bias. Only take trades in the direction of the D1 trend.
Step 2 — Wait for a Pullback On the H4 chart, wait for price to retrace into the 38.2%–61.8% Fibonacci zone of the most recent impulse leg. This is your entry window, not a trigger.
Step 3 — Confirm with RSI and MACD RSI (14-period) should be between 40–50 in an uptrend (showing the pullback has cooled momentum without turning bearish). MACD histogram should be contracting or showing a bullish crossover on H4. Both conditions together form your trigger.
Entry Execution Place a limit order at the 50% Fibonacci level with a stop-loss 10–15 pips below the 61.8% level (for longs) or above it (for shorts). This tight placement keeps risk defined.
Example — XAUUSD Long (2024 Setup) Gold was trending above its D1 200 EMA throughout Q1 2024. On a pullback to $2,160 (the 50% Fibonacci retracement of the February impulse), H4 RSI reached 44 and MACD began crossing bullish. Entry at $2,163, stop at $2,148 (15-point risk), target at $2,193–$2,208 (30–45 point reward). That's a clean 1:2 to 1:3 setup on a single corrective move.
Exit Rules Target 1 (1:2 R:R): Close 50% of the position. Target 2 (1:3 R:R): Close remaining 50% or trail the stop. Exit immediately if price closes below the 61.8% Fibonacci level on H4 — the setup is invalidated regardless of time held.

Swing trading captures multi-day moves. Less screen time than day trading, more action than position trading.
Pulsar Terminal Features for Swing Trading
- Multiple SL/TP levels
- Breakeven automation
- Chart patterns
- Trailing stop
Top Brokers
Trading Tools
Calculate your position size for Swing Trading
Position Size Calculator
Calculate optimal lot size based on your risk management
Based on standard forex lot ($10/pip). Adjust for different instruments. Always verify with your broker.
Risk/Reward Calculator
Visualize your risk-to-reward ratio before entering a trade.
Based on standard forex pip value ($10/pip/lot). Actual values may vary by instrument and broker.
Compound Growth Calculator
Project your capital growth with compound returns.
Hypothetical projections only. Past returns do not guarantee future results. Trading involves risk of loss.
Forex Trading Sessions (UTC)
When each major forex market opens and closes.
Times shown in UTC. Actual hours may vary by broker and DST adjustments.
Apply This Strategy
About the Author
Daniel Harrington
Senior Trading Analyst
Daniel Harrington is a Senior Trading Analyst with a MScF (Master of Science in Finance) specializing in quantitative asset and risk management. With over 12 years of experience in forex and derivatives markets, he covers MT5 platform optimization, algorithmic trading strategies, and practical insights for retail traders.

Master Swing Trading with Pulsar Terminal
Pulsar Terminal gives you the advanced tools you need to execute Swing Trading strategies on MetaTrader 5 with precision.
Get Pulsar TerminalRisk Disclaimer
Trading financial instruments carries significant risk and may not be suitable for all investors. Past performance does not guarantee future results. This content is for educational purposes only and should not be considered investment advice. Always conduct your own research before trading.