

Here's a hard truth: 95% of the MT4 indicators you can download are pure noise.

David van der Merwe
เทรดเดอร์ตลาดเกิดใหม่ ·  South Africa
☕ 10 นาทีอ่าน
สิ่งที่คุณจะได้เรียนรู้:
- 1The MT4 Indicator Addiction (And How to Break It)
- 2The Core Four: Indicators That Actually Earn Their Keep
- 3Setting Up MT4 for South African Reality
- 4From Indicators to Income: A Simple Daily Routine
- 5Classic Mistakes (I've Made Them All)
- 6Next Steps: When You've Mastered the Basics
- 7Your Edge Isn't in the Software
Here's a hard truth: 95% of the MT4 indicators you can download are pure noise. They're colourful distractions that make you feel like you're analysing the market while quietly draining your account. In South Africa, where rand volatility and load-shedding can scramble your plans, you need tools that cut through the chaos, not add to it. This isn't about finding a magic bullet. It's about building a simple, strong toolkit that works when the power's out and your internet is crawling.
I get it. You download MT4, and the first thing you do is head to the MQL5 market or some forum. Before you know it, your chart looks like a Christmas tree from hell - lines, clouds, arrows, and oscillators everywhere. You think more information equals more insight. It doesn't. It equals paralysis.
I made this exact mistake in 2015. I had a chart with a moving average ribbon, three different stochastic oscillators, and a custom 'Supertrend' indicator. I was so busy looking for the perfect confluence of signals that I missed a clean, obvious breakout on USD/ZAR. The trade would have netted me over R8,000. Instead, I was frozen, watching 14 different lines argue with each other.
Warning: Most custom, paid-for indicators are just repackaged versions of free ones with a fancy GUI. They're sold on hope, not results.
The goal isn't to collect indicators; it's to filter price action. Your job is to reduce uncertainty, not decorate your screen. Start by wiping your charts clean. I mean it. Go to a blank chart with just the candlesticks or bars. Can you see where price is going? If not, no indicator will save you.
“95% of the MT4 indicators you can download are pure noise.”
After blowing up a small account and wasting two years, I narrowed my focus down to four types of tools. These aren't flashy, but they're the bedrock of clear analysis.
1. Simple Moving Averages (The Trend Filter)
Forget the exotic ones for now. The 50-period and 200-period Simple Moving Average (SMA) on the daily chart are your best friends. In South Africa, we're often trading cross-pairs like EUR/ZAR or GBP/ZAR. These pairs can trend for months. The 200 SMA tells you the long-term direction. The 50 SMA shows you the medium-term momentum. Price above both? Bias is up. Price below both? Bias is down. It's not a signal to buy or sell. It's a filter to keep you on the right side of the market. I use this every single day before I even think about a trade.
2. The Relative Strength Index (The Gauge, Not The Trigger)
The RSI indicator is probably the most misused tool in MT4. People sell when it's 'overbought' at 80 and buy when it's 'oversold' at 20. That's a great way to get run over by a strong trend. I use it differently. I look for divergence. If USD/ZAR makes a new high but the RSI makes a lower high, that's a warning the uptrend is losing steam. It's a context tool, not an entry signal. Combine that with your SMA filter, and you're starting to think in probabilities.
3. Bollinger Bands® (The Volatility Meter)
These aren't for picking tops and bottoms. Bollinger Bands expand and contract with volatility. In a quiet market, the bands squeeze tight. That's often a precursor to a big move. When price starts pushing outside the bands, it tells you the move has momentum. My rule? Never sell just because price hits the upper band in a strong uptrend. Wait for a reversal candle or other confirmation inside the band.
4. The MACD (The Momentum Confirmation)
The MACD indicator is fantastic for confirming trend changes. I ignore the histogram most of the time. I watch for the MACD line (the fast one) to cross above or below the signal line (the slow one), especially if it happens near the 'zero' line. A cross above zero often confirms a shift from a bearish to a bullish phase. It's slow, but that's why it's reliable. Don't use it for scalping strategy; it's too laggy. It's perfect for swing trading the daily charts.
Pro Tip: Don't change your indicator settings every week. Pick a setting (like a 14-period RSI or 20-period Bollinger Bands with 2 standard deviations), backtest it, and stick with it for at least 100 trades. Consistency beats optimisation.

💡 เคล็ดลับจาก Winston
A professor once told me, 'A man with one watch knows the time. A man with two is never sure.' Pick one indicator for trend, one for momentum. Trust them.
“Your job is to reduce uncertainty, not decorate your screen.”
Trading from SA isn't like trading from London. You have to build for resilience.
Chart Timeframes: Your internet might drop. Your screen might freeze. Because of this, I avoid super-fast timeframes. My primary chart is the 1-hour. It gives me enough detail without the noise of a 5-minute chart. I use the daily for trend (with my SMAs) and the 1-hour for timing. The 15-minute is for fine-tuning entry. That's it.
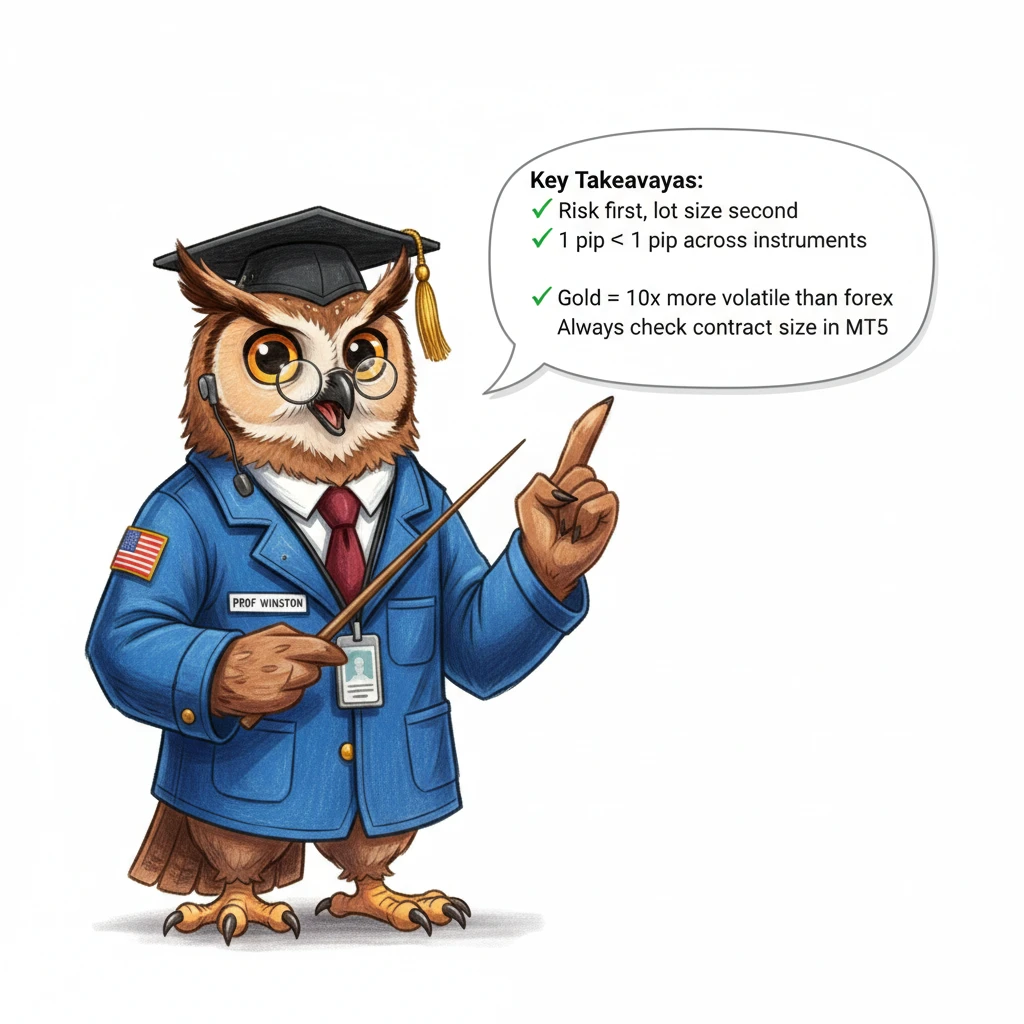
Dealing with Spreads: When trading major pairs like EUR/USD, the spread is tight. But when you trade ZAR pairs, the spread can be 5-10 times wider. A 50-pip spread on USD/ZAR is normal. You must factor this into your position size calculator. If your profit target is only 80 pips, a 50-pip spread means the market has to move 130 pips in your favour just for you to break even. It's brutal. This is why I often stick to major forex pairs and trade the rand via USD/ZAR only when volatility is high and the potential move is large.
Broker Choice is Critical: You need a broker with a solid MT4 offering, reliable servers, and fair pricing. I've used Exness for their tight spreads on majors and IC Markets for their raw pricing model. Both have local deposit options, which is a must. Avoid any broker that doesn't have a clear FSCA registration. It's your money. Protect it.
Visual Setup: Dark background (saves your eyes during those late-night sessions). Candlesticks in plain white/green/red. My 50 SMA is blue, my 200 SMA is red. RSI at the bottom. Keep it clean. If your chart looks like a rainbow, you've gone wrong.
“Your job is to reduce uncertainty, not decorate your screen.”
Indicators don't make money. Processes do. Here's my non-negotiable 20-minute pre-market routine.
- Check the Daily: I open my USD/ZAR, EUR/USD, and XAU/USD charts. Where is price relative to my 50 and 200 SMA? That sets my bias for the day. Bullish, bearish, or ranging.
- Check the 1-Hour: I look at the same pairs. Is the 1-hour trend aligned with the daily bias? If yes, I have a potential trade direction. If no, I'm extra cautious - it's a correction or reversal period.
- Apply the RSI/MACD: On the 1-hour, I look for RSI divergence or a MACD crossover that supports my bias. This is my confirmation.
- Find the Level: I ignore indicators here. I look at the chart and find the nearest obvious support or resistance level - yesterday's high/low, a round number, a clear swing point.
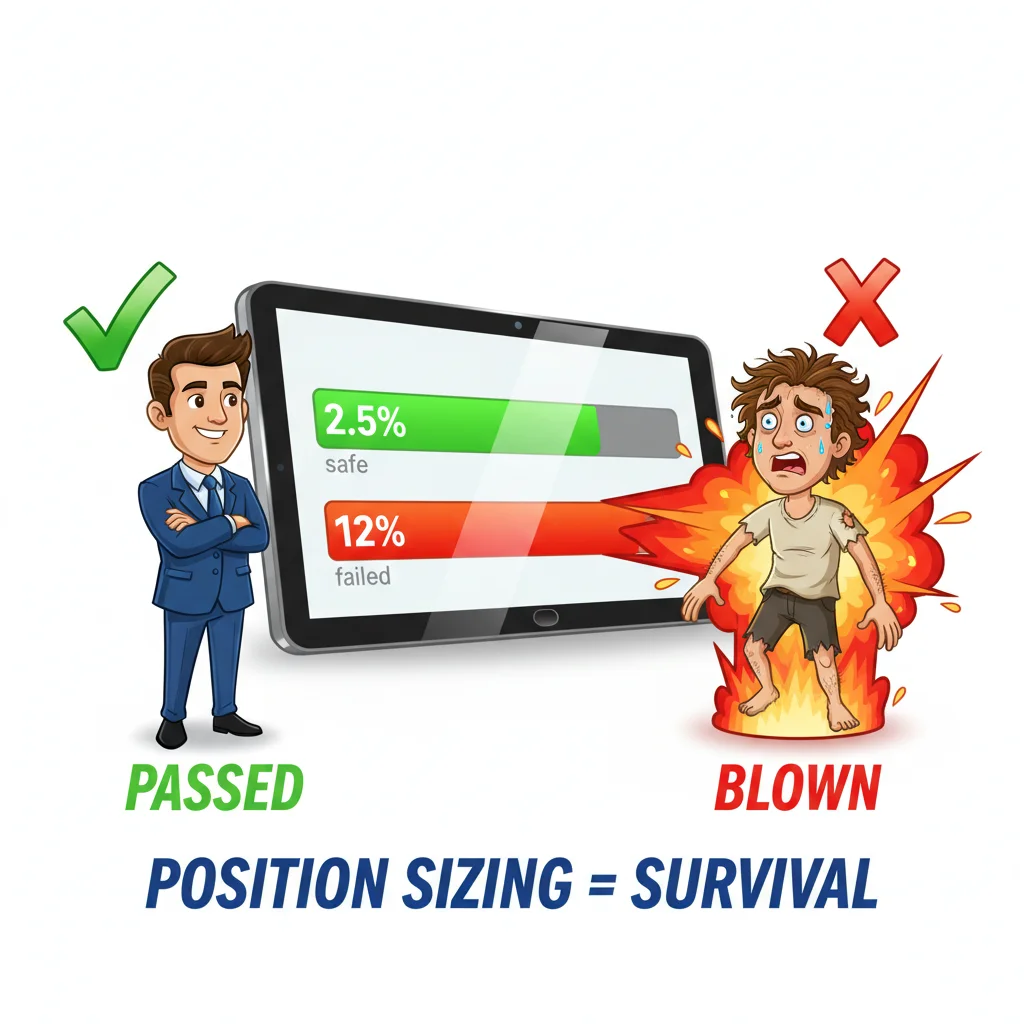
- Plan the Trade: If my bias is up, and I get confirmation near support, I plan a buy. I calculate my entry, stop-loss (always beyond that support level), and take-profit. I use my position size calculator to ensure my risk is never more than 1% of my account. I write this down on a physical notepad.
Then I wait. I don't force the trade. If it doesn't come to me, I do nothing. This routine works because it's mechanical. It removes emotion, which is the number one killer of South African trading accounts.
💡 เคล็ดลับจาก Winston
In my lab, we'd run an experiment 100 times before drawing a conclusion. Do the same with your indicator setup. 100 trades. No tweaking. Then review.
“A small R400 loss is better than a R4,000 one that triggers a margin call.”
Let me save you some time and money.
Pitfall 1: Chasing the Lag. All indicators lag. They are calculations based on past price. Buying because the RSI just crossed above 30 means you're buying after a move has already started. You're late. Use indicators to set a scene, not to give you a green light.
Pitfall 2: Over-Optimisation. You backtest a strategy with a 21-period EMA and it works great. You try a 20-period EMA and it's even better! This is a fantasy. You're just fitting a curve to past data. In live markets, the difference between a 20 and 21 EMA is meaningless. Pick standard settings and move on.
Pitfall 3: Ignoring the Spread. As mentioned, this is a ZAR-trader killer. You see a 30-pip move on your chart and think you've made money. If the spread was 25 pips, your real profit is 5 pips. Before you enter any trade, know the exact spread definition your broker is quoting at that moment.
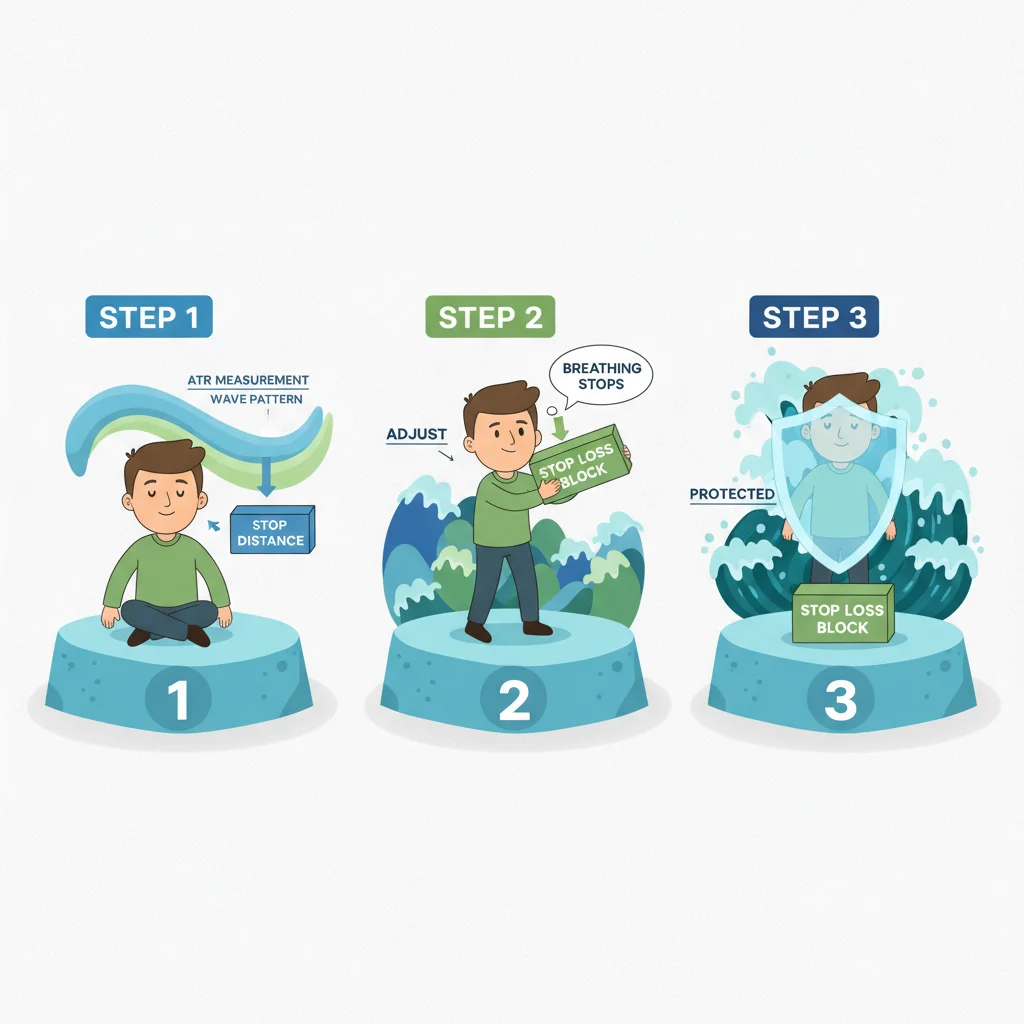
Pitfall 4: No Stop-Loss Discipline. You place a trade based on your beautiful indicator setup. It goes against you. 'But the MACD is still bullish,' you think, and you move your stop-loss further away. You've just broken your system. Your stop-loss is part of the system. Moving it is admitting your analysis was wrong. Take the loss. A small R400 loss is better than a R4,000 one that triggers a margin call.
Example: You have a R20,000 account. Your 1% risk is R200. On a USD/ZAR trade, your stop-loss is 50 pips. Each pip on a mini lot (10,000 units) is worth ~R0.70. To risk R200, you can trade: R200 / (50 pips * R0.70) = 5.7 mini lots. Round down to 5 mini lots. That's your position size. No guesswork.
Manually moving stop-losses based on shifting indicator readings is emotional and error-prone. Pulsar Terminal automates advanced stop-loss and take-profit logic, like trailing stops and breakeven triggers, directly on your MT5 charts, enforcing the discipline your system needs.
Pulsar Terminal
เครื่องมือ MT5 ครบวงจร: ลากวางคำสั่ง, multi-TP/SL, trailing stop, grid trading, Volume Profile และการป้องกัน prop firm ใช้งานโดยเทรดเดอร์กว่า 1,000 คนทุกวัน

“A small R400 loss is better than a R4,000 one that triggers a margin call.”
Once you're consistently executing your simple routine for 6 months, you can explore concepts that add depth, not complexity.
Multiple Time Frame Analysis: This is where the magic happens. I use a three-timeframe model: Daily (Trend), 4-Hour (Momentum), 1-Hour (Entry). All three must agree. If the daily trend is up, but the 4-hour and 1-hour are showing strong sell signals, I stay out. It keeps you out of bad trades.
Price Action Synthesis: Start 'reading' the candles themselves. A long bullish candle closing near its high after a pullback to the 50 SMA is a powerful signal. A small 'doji' candle after a big move suggests indecision. Learn to marry this with your indicator readings. For instance, a bearish RSI divergence plus a shooting star candle at resistance is a much stronger sell signal than either alone.
Market Profile & Volume: This is where tools beyond standard MT4 indicators come in. Understanding where most trading activity happened during a session (the 'point of control') can show you true areas of value. While MT4's volume data is limited, the concept is vital. It helps you understand why price is respecting a certain level, not just that it is.
The key is to add these one at a time. Don't jump into market profile while you're still trying to remember your RSI settings. Mastery is a slow grind.
💡 เคล็ดลับจาก Winston
Complex systems fail in unpredictable ways. Your trading system is no different. Simplicity is strong. Complexity is fragile.
“Your edge as a South African trader isn't a secret indicator. It's your ability to stick to a simple plan when load-shedding hits.”
After 12 years, I can tell you the best indicator on MT4 is the one between your ears. Discipline. Patience. Emotional control. No amount of code can give you that.
Your edge as a South African trader isn't a secret indicator. It's your ability to stick to a simple plan when load-shedding hits, when the rand spikes on a political headline, and when your favourite setup hasn't appeared for a week. It's logging your trades in a spreadsheet, reviewing your losses without ego, and having the guts to press the button when your system tells you to.
Start with the Core Four. Build your routine. Respect the spread. Manage your risk like your financial life depends on it - because it does. MT4 is just the toolbox. You are the craftsman. Now go build something solid.
Pro Tip: Once a month, do a 'blank chart' week. Trade only using support/resistance lines and candlestick patterns you draw yourself. It will sharpen your price action reading more than any indicator ever could.

FAQ
Q1What are the best free forex indicators on MT4 for beginners?
Stick to the ones that come pre-installed: Moving Averages (50 & 200 SMA), RSI, and Bollinger Bands. They're free, universally understood, and teach you the core concepts of trend, momentum, and volatility without the confusion of flashy custom tools.
Q2How many indicators should I have on my MT4 chart?
Fewer than you think. I run with three at most: two moving averages on the main chart and one oscillator (like RSI) in a sub-window. If you need more than that to make a decision, your trade idea isn't strong enough. Clutter leads to confusion.
Q3Why do my indicators give different signals on different timeframes?
Because they're calculating based on different data sets. A 1-hour RSI looks at the last 14 hours of price action. A daily RSI looks at the last 14 days. They will rarely be in sync. This is why you must define a primary timeframe for your trend bias and only use others for confirmation or entry timing.
Q4Are paid MT4 indicators worth it for a South African trader?
Almost never. I've wasted thousands of rands on them. They promise the world but are almost always built on standard formulas. The 'secret algorithm' is usually a common indicator with smoothed inputs. Invest that money in education or simply add it to your trading capital instead.
Q5How do I stop indicator repainting on MT4?
Repainting is when an indicator changes its past signals. It's a flaw in many custom scripts. The only surefire way to stop it is to avoid those indicators altogether. Stick to mainstream, non-repainting indicators like the ones mentioned in this guide. Test any new indicator on a demo account by letting it run and marking its signals to see if they change.
Q6Can I make a living trading forex in South Africa using just MT4 indicators?
No. Indicators are just one component. Making a living requires a full business plan: rock-solid risk management (using a position size calculator), impeccable psychology, a proven strategy, and sufficient capital. The indicator is the screwdriver in the toolkit. You can't build a house with just a screwdriver.
Q7My broker offers MT5. Should I switch from MT4 for the better indicators?
MT5 has more built-in indicators and timeframes, but the core principles are identical. Don't switch hoping for better tools to save you. If you're not profitable on MT4, you won't be on MT5. Master the basics first. The platform is not your edge.
บทเรียนจาก Prof. Winston
สรุปสาระสำคัญ:
- ✓Use only 2-3 core MT4 indicators maximum.
- ✓Always factor in the spread, especially on ZAR pairs.
- ✓Risk no more than 1% of your capital per trade.
- ✓Backtest any setup for at least 100 trades.
- ✓The platform is not your edge; your discipline is.
บทความนี้มีประโยชน์แค่ไหน?
คลิกดาวเพื่อให้คะแนน
ข้อมูลเชิงลึกการเทรดรายสัปดาห์
การวิเคราะห์และกลยุทธ์รายสัปดาห์ฟรี ไม่มีสแปม
เกี่ยวกับผู้เขียน
David van der Merwe
เทรดเดอร์ตลาดเกิดใหม่
เทรดเดอร์ประจำโจฮันเนสเบิร์ก มีประสบการณ์ 11 ปีในสกุลเงินตลาดเกิดใหม่ เชี่ยวชาญคู่ ZAR การเทรดภายใต้กฎระเบียบ FSCA และการวิเคราะห์ตลาดแอฟริกาใต้
ความคิดเห็น
คำเตือนความเสี่ยง
การซื้อขายตราสารทางการเงินมีความเสี่ยงสูงและอาจไม่เหมาะสำหรับนักลงทุนทุกคน ผลการดำเนินงานในอดีตไม่ได้รับประกันผลลัพธ์ในอนาคต เนื้อหานี้มีวัตถุประสงค์เพื่อการศึกษาเท่านั้นและไม่ควรถือเป็นคำแนะนำในการลงทุน โปรดทำการวิจัยของคุณเองก่อนการซื้อขาย
คุณอาจชอบสิ่งนี้

Cara Trading Forex Sukses: 7 Prinsip dari Trader Profesional
Cara trading forex sukses dengan 7 prinsip trader pro: manajemen modal, disiplin, journal trading, backtest. Data nyata, bukan janji profit palsu.
Jam Trading Forex Terbaik untuk Trader Indonesia: Panduan Lengkap dengan Tabel Waktu
Panduan jam trading forex untuk trader Indonesia. Tabel 4 sesi dunia, jam emas 20:00-00:00, sesi mana yang harus dihindari. Data akurat + tips dari trader berpengalaman.
Top 5 Sàn Forex Uy Tín Nhất 2026: Review Jujur dari Trader Indonesia
Top 5 sàn forex uy tín 2026 untuk trader Indonesia. Review jujur: spread, deposit, withdraw, dukungan lokal. Exness, XM, IC Markets & lebih.
รับ Pulsar Terminal
เครื่องคำนวณทั้งหมดนี้ถูกสร้างไว้ใน Pulsar Terminal พร้อมข้อมูลเรียลไทม์จากบัญชี MT5 ของคุณ
รับ Pulsar Terminal