Accelerator Oscillator (AC): Bill Williams' Early Warning Momentum Tool
Accelerator Oscillator measures the acceleration or deceleration of the Awesome Oscillator, providing early warning of momentum changes before price reacts.

Daniel Harrington
Senior Trading Analyst · MT5 Specialist
☕ 16 min read
Settings — AC
| Category | oscillator |
| Default Period | null |
| Best Timeframes | H1, H4, D1 |
Most momentum indicators tell you what price is doing right now. The Accelerator Oscillator tells you what momentum is about to do next. Developed by Bill Williams and introduced in his 1995 book Trading Chaos, the AC measures whether the current market driving force is speeding up or slowing down. In practical terms, it acts as an early warning system that sits one step ahead of the Awesome Oscillator, which itself already sits ahead of raw price action. If the AO is like reading the speedometer of a car, the AC is like watching the driver's foot on the gas pedal. You see the intention before the speed changes.
Key Takeaways
- Bill Williams built the Accelerator Oscillator on a simple but powerful idea: before price changes direction, momentum c...
- The color coding on the AC histogram is where most misunderstandings happen. Traders who come from RSI or MACD backgroun...
- Bill Williams did something unusual with the AC. He created a mechanical signal system based on counting colored bars. N...
1The Indicator That Predicts the Awesome Oscillator
Bill Williams built the Accelerator Oscillator on a simple but powerful idea: before price changes direction, momentum changes direction. And before momentum changes direction, the acceleration of momentum changes direction. The AC captures that earliest shift.
The math behind the AC is surprisingly straightforward. It starts with the Awesome Oscillator, which is the difference between a 5-period SMA and a 34-period SMA, both applied to the median price (High + Low) / 2. The AC then subtracts a 5-period SMA of the AO from the AO itself.
AC = AO - SMA(AO, 5)
What this formula isolates is the acceleration component of momentum. When the AO is rising faster than its own 5-period average, the AC is positive and climbing. When the AO starts rising more slowly — even if it is still rising — the AC begins to drop. This is the key insight that makes the AC valuable. It does not wait for momentum to actually reverse. It detects the moment momentum begins losing steam.
On your chart, the AC appears as a histogram oscillating above and below a zero line. Green bars appear when the current bar's value is higher than the previous bar. Red bars appear when it is lower. This color system reflects direction of change, not absolute value. You can have green bars below zero and red bars above zero, which is an important distinction that trips up newer traders.
The zero line itself has a specific meaning. When the AC sits above zero, the overall acceleration favors the bulls. When below zero, it favors the bears. But unlike some oscillators, crossing zero is not a standalone trading signal. Williams was quite clear about this: the zero line tells you context, not action.
In MetaTrader 5, the indicator comes pre-installed under Insert, then Indicators, then Bill Williams, then Accelerator Oscillator. No custom installation required, no parameters to adjust. Williams designed the 5/34 structure as fixed values, not suggestions you should optimize. Changing the periods defeats the mathematical relationship the AC relies on.
Where the AC really earns its keep is in multi-indicator setups. Williams intended it to work alongside the Awesome Oscillator, the Alligator, and Fractals as parts of a unified system. Used alone, the AC can be noisy. Used as the timing mechanism within a broader framework, it becomes remarkably precise at catching momentum shifts one to three bars before they become obvious on the price chart.
Think of it this way: the Alligator tells you if a trend exists. The AO tells you how strong it is. The AC tells you whether that strength is growing or fading. Each layer adds resolution to the picture, like zooming into a microscope one click at a time.
A practical example helps clarify the relationship. Suppose EUR/USD is in an uptrend. The AO is above zero and rising — momentum is bullish and increasing. Now the AC starts printing red bars while still above zero. The AO has not turned yet. Price has not reversed. But the acceleration that was driving momentum upward has started to weaken. This is the AC doing exactly what it was built to do: giving you advance notice that the engine behind the trend is losing a cylinder. Whether you tighten your stop, take partial profits, or prepare a counter-trade setup depends on your strategy. The point is that you received that information before the AO or price action delivered it.
This early-warning characteristic makes the AC particularly valuable on H1 and H4, where the signal-to-noise ratio is favorable enough that those advance warnings translate into actionable edges rather than just extra noise.

The AC is basically a crystal ball for the Awesome Oscillator — it sees momentum shifts before they happen.
2AC Color Rules: Green Bars Above Zero vs Below Zero
The color coding on the AC histogram is where most misunderstandings happen. Traders who come from RSI or MACD backgrounds expect green to mean bullish and red to mean bearish. The AC does not work that way.
A green bar simply means the current histogram value is higher than the previous bar. A red bar means the current value is lower. This is a directional comparison between two consecutive bars, not an absolute reading. You can absolutely see red bars in bullish territory above zero, and green bars in bearish territory below zero.
This distinction matters because it changes how you read the indicator entirely.
Green Bars Above Zero
This is the strongest bullish configuration. The AC is positive, meaning acceleration favors upward momentum, and the histogram is expanding, meaning that acceleration is increasing. When you see consecutive green bars above zero, bulls are firmly in control and gaining power. Pullbacks during this condition tend to be shallow. New buy signals in this zone require only two consecutive green bars for confirmation, because the broader momentum context already supports the direction.
Red Bars Above Zero
This is where things get interesting. The AC is still positive, so the overall momentum acceleration still favors bulls. But the red bars mean that acceleration is declining. Bulls are still in the lead, but their grip is loosening. This condition often precedes one of two outcomes: either the deceleration is temporary and green bars resume, confirming trend continuation, or the deceleration deepens until the histogram crosses below zero, confirming a momentum shift.
Williams imposed a strict rule here. When you see red bars, you do not buy. Period. Even if the AC is above zero and the trend looks bullish on the price chart. The rationale is that buying into decelerating momentum puts you on the wrong side of the acceleration curve. Wait for green bars to return before considering longs.
Green Bars Below Zero
This is the recovery scenario. The AC is negative, meaning bears have the overall acceleration advantage, but the green bars indicate that bearish acceleration is fading. Each green bar below zero brings the histogram closer to the zero line, signaling that a potential shift is building. Buying below zero requires more confirmation because you are trading against the prevailing acceleration. Williams required three consecutive green bars in this zone before entering a long position.
Red Bars Below Zero
This is the mirror of green bars above zero. Bears are in control and gaining power. Each consecutive red bar pushes the histogram further into negative territory. Short positions are favored, and sell signals only require two consecutive red bars for confirmation since you are trading with the prevailing acceleration.
The golden rule Williams established is worth tattooing on your monitor: never buy when the current bar is red, and never sell when the current bar is green. No exceptions. This single filter eliminates a surprising number of poor entries. It sounds almost too simple, but it forces you to trade with acceleration rather than against it.
One common mistake is fixating only on color while ignoring the histogram's position relative to zero. A single green bar below zero is not bullish. It is just less bearish than the bar before it. Context matters. The color tells you the direction of change. The position relative to zero tells you the broader momentum environment. You need both pieces of information to make a sound trading decision.
Here is a quick mental model. Imagine a ball thrown into the air. Above zero is going up, below zero is coming down. Green bars mean the ball is accelerating in the current direction. Red bars mean it is decelerating. A red bar above zero is a ball still going up but slowing down — it has not reversed yet, but gravity is winning.

When AC bars turn green above zero, it's your traffic light to go long!
“Bill Williams did something unusual with the AC.”
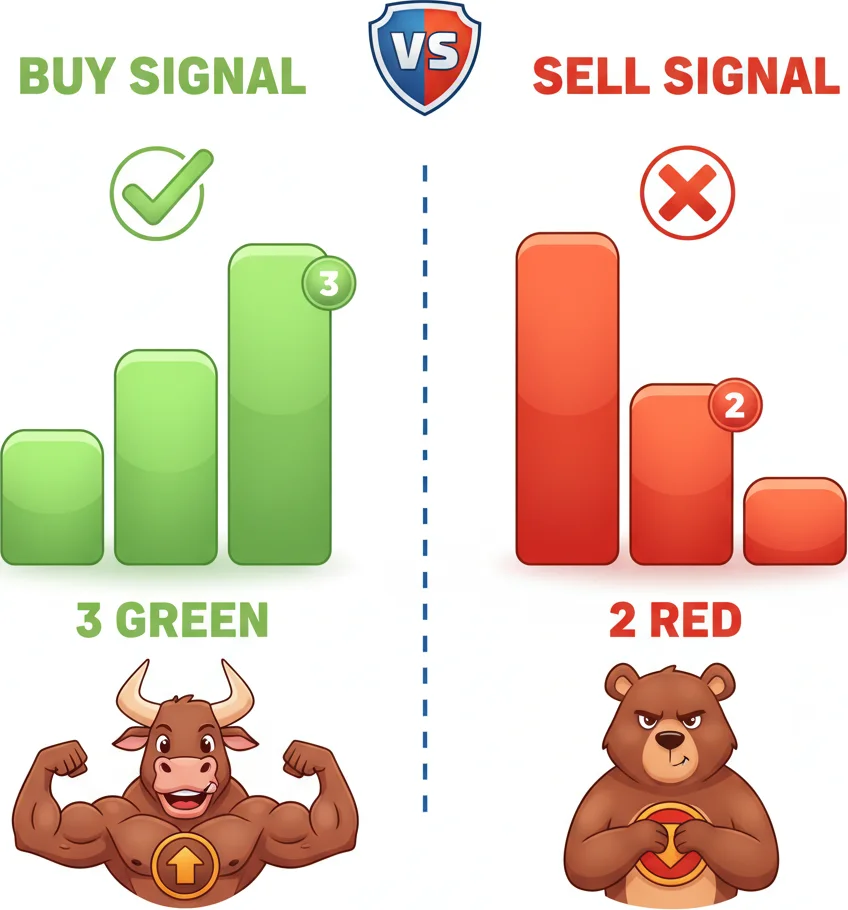
3AC Buy and Sell Signals: The Bar-Counting Method
Bill Williams did something unusual with the AC. He created a mechanical signal system based on counting colored bars. No pattern recognition required. No subjective interpretation. Just count the bars and follow the rules.
This bar-counting method is the core trading application of the Accelerator Oscillator, and it adjusts its confirmation requirements based on whether you are trading with or against the prevailing momentum context.
Buy Signals: Trading With Momentum (AC Above Zero)
When the AC histogram is above the zero line, overall acceleration favors the bulls. To enter a long position in this environment, you need two consecutive green bars. The logic is straightforward. Momentum is already on your side, so less confirmation is needed. The first green bar shows acceleration resuming. The second confirms it was not a one-bar fluke. Enter on the close of the second green bar.
Buy Signals: Trading Against Momentum (AC Below Zero)
When the AC is below zero, you are trying to catch a reversal from bearish to bullish acceleration. This is inherently riskier, so Williams added an extra bar of confirmation. You need three consecutive green bars below zero before entering long. The first bar shows deceleration in bearish momentum. The second shows it is sustained. The third provides the extra confirmation that a genuine shift is underway, not just a temporary pause in the selling pressure.
Sell Signals: Trading With Momentum (AC Below Zero)
With the histogram below zero, bears have the acceleration advantage. A sell signal requires two consecutive red bars. Same logic as the above-zero buy signal but in reverse. Momentum is on your side, so two bars of confirmation is sufficient.
Sell Signals: Trading Against Momentum (AC Above Zero)
Selling when the AC is above zero means shorting into bullish acceleration. Three consecutive red bars above the zero line are required. The extra bar accounts for the higher probability that bullish acceleration will resume and knock you out.
Here is the complete reference table:
| Signal | AC Position | Bars Required | Color |
|---|---|---|---|
| Buy | Above zero | 2 bars | Green |
| Buy | Below zero | 3 bars | Green |
| Sell | Below zero | 2 bars | Red |
| Sell | Above zero | 3 bars | Red |
Practical Execution Tips
The bar count must be consecutive. If a green sequence is interrupted by even one red bar, the count resets to zero. This can be frustrating on choppy timeframes like M5, where the histogram flips color every other bar. It is one reason why M15, H1, and H4 are the recommended timeframes for this method.
Entry timing matters more than you might think. Williams specified that the entry should occur on the close of the confirming bar, not during its formation. A bar can be green for 90% of its duration and turn red right at the close, invalidating the signal. Wait for the bar to close before committing your capital.
Stop-loss placement is not defined by the AC itself. Williams used Fractals for stop placement, positioning stops beyond the most recent Fractal in the opposite direction of the trade. If you do not use Fractals, placing stops beyond the nearest swing high (for shorts) or swing low (for longs) works as a practical alternative.
Position Sizing Consideration
When entering against momentum (the 3-bar setups), Williams recommended smaller position sizes than when trading with momentum (the 2-bar setups). The logic is sound: you are less certain of the signal, so you risk less on it. A common approach is to use your full position size on with-momentum signals and half-size on against-momentum signals.
The bar-counting method is deliberately mechanical, and that is its strength. It removes the emotional component of trade entry and forces discipline. You either have the right number of consecutive bars or you do not. No maybe, no close enough, no I think it looks bullish.
One honest note: this system will miss the very beginning of moves. By the time two or three bars have confirmed the signal, price has already moved some distance. That is the tradeoff Williams accepted. You sacrifice the first portion of a move in exchange for higher confirmation that the move is real. For most retail traders, that is a trade worth making. Catching 70% of a real move beats catching 100% of a false one.
Three green bars above zero? That is your go signal. Two reds below? Time to sell. The AC keeps it simple.
4AC + AO: Using Both Bill Williams Oscillators Together
Using the Accelerator Oscillator without the Awesome Oscillator is like checking the weather forecast without looking out the window. You can follow the data, but you are missing a layer of context. Williams designed these two indicators to work as a pair, and using them together adds a confirmation layer that significantly improves signal quality.
The Awesome Oscillator shows you the current state of momentum. Is the short-term momentum stronger or weaker than the long-term baseline? The AC shows you the direction that momentum is heading. Is it gaining or losing force? When both indicators align, you have a high-conviction setup. When they diverge, caution is warranted.
The Ideal Bullish Setup
The strongest buy configuration occurs when the AO is above its zero line and rising (green bars), while the AC is also above its zero line and printing green bars. This tells you that momentum is positive and the force driving that momentum is increasing. Trends in this state tend to be persistent and pullbacks tend to be shallow.
A practical entry point within this configuration is when the AO pulls back slightly, creating a saucer pattern (two red bars followed by a green bar, all above zero), and the AC simultaneously shows two consecutive green bars. The AO saucer confirms a brief momentum pause has ended. The AC green bars confirm acceleration is resuming. This dual confirmation is one of the cleanest entries the Williams system produces.
The Ideal Bearish Setup
The mirror applies. AO below zero with red bars plus AC below zero with red bars creates the strongest bearish alignment. Enter on an AO saucer pattern below zero (two green bars then a red bar) when the AC simultaneously prints two consecutive red bars. Both oscillators agree the bearish momentum is regaining speed.
Divergence Between AC and AO
This is where the real analytical value emerges. When the AO is still rising above zero but the AC has started printing red bars or has crossed below zero, you have early divergence. Momentum is still bullish, but the acceleration driving it has reversed. This does not mean the trend is over. It means the current thrust is losing power and a correction or reversal becomes more probable.
Traders who rely solely on the AO would stay long in this scenario because AO is still positive. Adding the AC gives you the warning that the foundation of that bullishness is cracking. You might not exit the trade immediately, but you would tighten your stop, take partial profits, or stop adding to the position.
The reverse divergence is equally useful. If the AO is below zero and falling but the AC starts printing green bars, the bearish acceleration is weakening even though raw momentum is still negative. This is often the first hint that a bottom is forming. Short traders who only watch the AO see continued bearish momentum. Short traders who also watch the AC see that the selling pressure is losing urgency.
Practical Workflow on H1 and H4
On H4, use the AO to establish the momentum direction. If AO is above zero and green, you have a bullish context. Then drop to H1 and use the AC bar-counting method for precise entries. The H4 AO acts as your directional filter. The H1 AC acts as your timing mechanism.
This two-timeframe approach addresses the main weakness of each indicator used alone. The AO alone on H1 generates too many zero-line crosses that go nowhere. The AC alone on H4 generates signals but lacks the momentum context to know which ones are worth taking. Together, each compensates for the other's blind spot.
Adding the Alligator for a Complete Williams System
Williams' full system used the Alligator indicator as the trend filter above both oscillators. The Alligator is a set of three smoothed moving averages (Jaw, Teeth, Lips) that shows whether a trend exists and its direction. When the Alligator is open with the Lips above the Teeth above the Jaw, a bullish trend is active. Only then do you look for AO and AC buy signals.
This three-layer system — Alligator for trend, AO for momentum, AC for acceleration — is one of the most complete pre-built trading systems available in MT5. You may not use all three layers every time, but understanding how they fit together helps you decide which signals to trust and which to let pass.
Even if you do not adopt the full Williams methodology, the AO plus AC combination alone is one of the more underrated dual-indicator setups in retail trading. It will not win you any points for originality at a trading forum, but it works — and in trading, working quietly beats looking impressive loudly.

When both AC and AO scream 'buy' together, the market's about to catch fire!
“No indicator has a 100% hit rate, and the AC is no exception.”
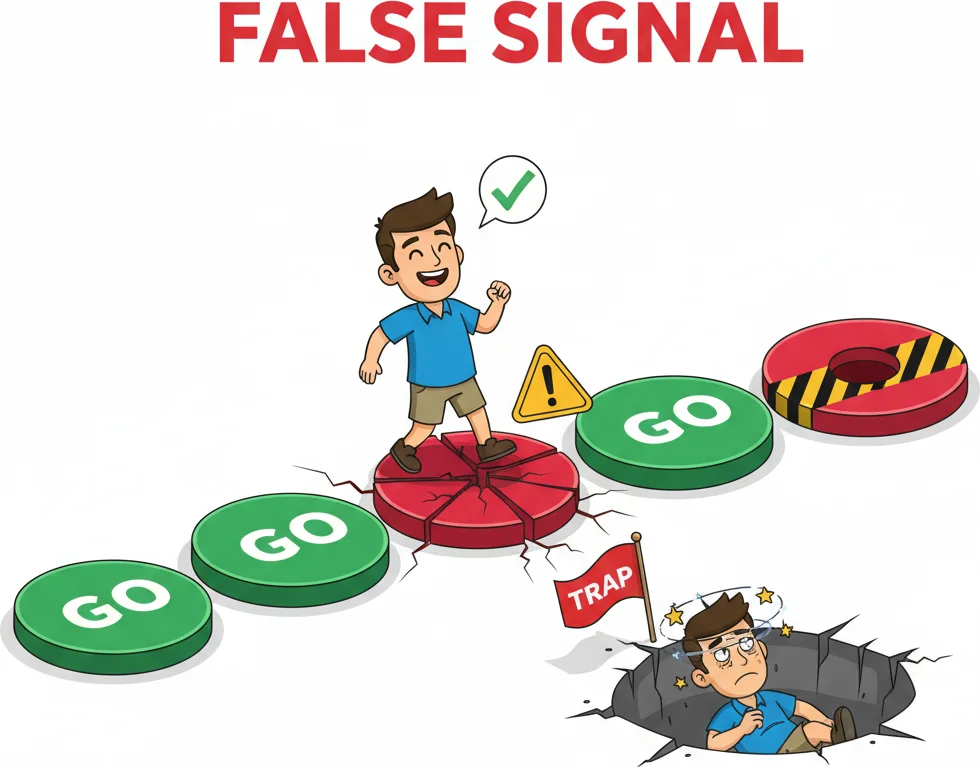
5When the Accelerator Decelerates: Recognizing False Signals
No indicator has a 100% hit rate, and the AC is no exception. In fact, because the AC is designed to be early, it is structurally prone to false signals. It trades some accuracy for speed. Understanding when and why false signals occur is just as important as memorizing the entry rules.
Range-Bound Markets: The AC's Worst Enemy
The AC performs best in trending markets where momentum has a clear direction. In sideways, choppy markets where price bounces between support and resistance without committing, the AC histogram whipsaws around the zero line producing green and red bars in rapid alternation. The bar count rarely reaches two or three consecutive bars before resetting.
If you notice the AC flipping between green and red every one to two bars for an extended period, you are likely in a range. Step aside. No mechanical filter will save you here because the indicator is accurately measuring acceleration that genuinely has no sustained direction.
The best defense is to identify ranging conditions before applying AC signals. A simple check is the Alligator indicator. When the Alligator lines are intertwined and flat, the market is sleeping. Williams explicitly said not to trade during this phase. The AC signals generated while the Alligator sleeps are noise, not opportunity.
The One-Bar Reversal Trap
This is the most common false signal scenario. You see two green bars above zero, which technically meets the buy signal criteria. You enter. The very next bar turns red, and the histogram begins collapsing. What happened?
Usually, this occurs near minor resistance levels or during low-volume sessions where a brief acceleration spike does not have enough market participation behind it to sustain. The signal was technically valid by the rules, but the context did not support follow-through.
Defense: Always check the size of the confirming bars. If the second or third bar in the count is significantly smaller than the first, the acceleration is already fading even as it confirms. Strong signals show equal or expanding bar height across the confirmation sequence. Diminishing bar size during the count is a warning flag that the move may not have legs.
Divergence Signals That Never Complete
Divergence between the AC and price is a powerful reversal signal, but it is not a timing signal. You can spot bearish divergence — where price makes a higher high while the AC makes a lower peak — and then watch price continue higher for another 50 bars before it actually reverses. The divergence was correct in its message but completely wrong in its timing.
Defense: Never enter a trade purely on divergence. Use divergence as an alert that the current trend is weakening, then wait for the bar-counting method to produce an actual signal in the new direction. Divergence tells you something is changing. The bar count tells you when the change has enough momentum to trade.
News Events and Gap Moves
The AC histogram can produce dramatic green or red bar sequences during high-impact news releases like NFP, central bank decisions, or CPI prints. The acceleration is real, but it is driven by a one-time information shock rather than sustained market forces. After the initial reaction, the AC often reverses sharply, trapping traders who entered on the spike.
Defense: Avoid acting on AC signals within 30 minutes of major economic releases. Let the dust settle. If the acceleration persists after the initial volatility dies down, the signal is more likely genuine and worth trading.
Timeframe-Specific Noise
On M15, the AC generates roughly three to four times more signals per week than on H4. The hit rate on those signals is correspondingly lower. The bar-counting method helps filter some noise, but it cannot overcome the fundamental issue that shorter timeframes contain more random fluctuation in the acceleration data.
Defense: If you trade M15, use H1 or H4 AC direction as a filter. Only take M15 buy signals when the H1 AC is above zero and printing green. Only take M15 sell signals when the H1 AC is below zero and printing red. This multi-timeframe filter eliminates the majority of M15 false signals at the cost of reducing total signal count. That trade-off is almost always worth making.
The honest truth about the AC is that it produces more false starts than most lagging indicators. That is the price of being early — you get advance notice of real moves, but you also get advance notice of moves that never materialize. Williams understood this and built the bar-counting rules specifically to manage it. Traders who add additional filters like the Alligator, multi-timeframe alignment, or simple support and resistance awareness push the AC's reliability into genuinely useful territory.
Not every green bar is a golden ticket — the AC can fake you out faster than a magician doing card tricks.
Frequently Asked Questions
Q1What is the Accelerator Oscillator and how does it differ from the Awesome Oscillator?
The Awesome Oscillator measures momentum by comparing short-term and long-term SMAs of the median price. The Accelerator Oscillator goes one level deeper — it measures the rate of change of the AO itself by subtracting a 5-period SMA of the AO from the AO value. In practical terms, the AO tells you how fast momentum is moving, while the AC tells you whether that speed is increasing or decreasing. Because of this layered construction, the AC typically signals directional shifts one to three bars before the AO does.
Q2How many bars do I need to confirm a buy or sell signal on the AC?
It depends on the histogram's position relative to zero. If you are buying with the AC above zero (trading with the prevailing acceleration), two consecutive green bars are enough. If buying with the AC below zero (trading against it), you need three consecutive green bars. For sell signals, two consecutive red bars below zero or three consecutive red bars above zero. The extra bar requirement when trading against the prevailing momentum direction provides additional confirmation to reduce false entries.
Q3Can I change the Accelerator Oscillator settings in MetaTrader 5?
The AC in MetaTrader 5 uses fixed parameters based on the Awesome Oscillator's 5-period and 34-period SMAs, plus its own internal 5-period SMA smoothing. There are no user-adjustable period settings because the indicator's mathematical relationship depends on these specific values. Changing them would break the acceleration measurement Williams designed. You can adjust the histogram colors in the indicator properties, but the underlying calculation should remain as-is.
Q4What timeframes work best with the Accelerator Oscillator?
The AC works well on M15, H1, and H4. H4 is generally considered the sweet spot — enough data to reduce noise while still providing timely signals for swing traders. H1 is useful for intraday entries when combined with a higher-timeframe directional filter like the H4 AO. M15 generates more signals but requires strict multi-timeframe filtering to avoid whipsaws. The AC on M5 or lower timeframes is typically too noisy to produce reliable bar-counting signals.
Q5Should I use the AC as a standalone indicator or combine it with others?
Combining is strongly recommended. Williams designed the AC to work within a system alongside the Awesome Oscillator and the Alligator indicator. The Alligator identifies whether a trend exists, the AO measures its strength, and the AC times entries by detecting acceleration shifts. Used alone, the AC produces too many signals in choppy markets. Adding even one filter — such as only taking AC signals in the direction confirmed by the H4 Awesome Oscillator — dramatically improves the signal-to-noise ratio.
Top Brokers
About the Author
Daniel Harrington
Senior Trading Analyst
Daniel Harrington is a Senior Trading Analyst with a MScF (Master of Science in Finance) specializing in quantitative asset and risk management. With over 12 years of experience in forex and derivatives markets, he covers MT5 platform optimization, algorithmic trading strategies, and practical insights for retail traders.
Use This Indicator
Risk Disclaimer
Trading financial instruments carries significant risk and may not be suitable for all investors. Past performance does not guarantee future results. This content is for educational purposes only and should not be considered investment advice. Always conduct your own research before trading.