Accumulation/Distribution (A/D) Line: Marc Chaikin's Volume Flow Indicator
A/D line uses the relationship between closing price and the high-low range along with volume to determine whether an instrument is being accumulated or distributed.

Daniel Harrington
Senior Trading Analyst · MT5 Specialist
☕ 18 min read
Settings — A/D
| Category | volume |
| Default Period | null |
| Best Timeframes | H1, H4, D1 |
If you have ever looked at On Balance Volume and thought 'this is useful, but it treats every up-close the same whether price barely moved or ripped to the high of the bar,' then Marc Chaikin already agreed with you back in the 1980s. His answer was the Accumulation/Distribution Line — an indicator that does not just count volume direction, but weighs it by where price actually closed within the bar's range. The idea is elegant: a candle that closes near its high with heavy volume means buyers were in control all session. A candle that closes near its low on heavy volume means sellers dominated. And a candle that closes right in the middle? That volume was split — no one had the upper hand. The A/D Line takes this logic, multiplies it by volume, and runs a cumulative total that rises when smart money is accumulating and falls when they are distributing. It has been a staple of institutional analysis since its creation and comes built into MT5 under the Volume Indicators category.
Key Takeaways
- To understand the A/D Line, you need to understand the problem it solved. Joe Granville introduced On Balance Volume in ...
- The A/D Line's calculation is a three-step process, and the first step — the Close Location Value — is where all the mag...
- Divergence is the A/D Line's headline signal, and the logic behind it goes straight to the heart of what the indicator w...
1Marc Chaikin's Improvement on OBV: Why Close Location Matters
To understand the A/D Line, you need to understand the problem it solved. Joe Granville introduced On Balance Volume in 1963, and it was a breakthrough for its era — for the first time, traders had a way to track whether volume was flowing into or out of a security using a simple cumulative line. But OBV has a major blind spot: it treats every period as binary. If the close is above the previous close, the entire bar's volume is added. If the close is below the previous close, the entire bar's volume is subtracted. That is it. No nuance, no shading, no acknowledgment that a bar can tell a complex story.
Consider a stock that opens at 100, drops to 95, rallies to 108, and closes at 101. OBV sees that the close is above the previous close and adds the full volume to its running total — bullish signal. But look at where price actually closed: just barely above the open, near the bottom of the high-low range. The bulls pushed hard to 108 but could not hold it. The close near the low of the range suggests sellers absorbed most of that buying pressure. OBV misses this entirely.
Marc Chaikin saw this gap. A Philadelphia native who began as a stockbroker in 1965, Chaikin spent two decades on Wall Street before he started developing proprietary indicators in 1980. He had studied both Granville's OBV and Larry Williams' earlier work on accumulation and distribution, and he wanted to build something that captured intraday price behavior — not just the direction of the close relative to the prior bar. Chaikin worked at Drexel Burnham Lambert in the early 1980s, where he had access to institutional data and began hosting segments on Financial News Network, the predecessor to CNBC. He was among the first analysts to use personal computers for stock analysis, and his indicators were designed from the start to be computable in real time.
The core innovation of the A/D Line is what Chaikin called the Close Location Value, or CLV — a multiplier that measures where the close sits within the high-low range of each bar. Instead of a binary up-or-down decision, the CLV produces a value between -1 and +1 that reflects the precise position of the close. When the close equals the high, the CLV is +1. When the close equals the low, the CLV is -1. When the close is exactly at the midpoint of the range, the CLV is zero. Every other closing position falls somewhere on that spectrum.
This multiplier is then applied to the bar's volume. A bar where price closed near the high on heavy volume contributes a large positive amount to the A/D Line. A bar where price closed near the low on heavy volume contributes a large negative amount. And a bar where price closed in the middle of its range — regardless of volume — contributes very little, because the CLV near zero neutralizes the volume. The formula captures what OBV cannot: the quality of the close within the context of the bar's full range.
The result is a cumulative indicator that rises when closing prices consistently favor the upper portion of each bar's range on volume, and falls when closes favor the lower portion. Chaikin originally called it the Cumulative Money Flow Line, which is arguably a more descriptive name, but Accumulation/Distribution stuck because it directly describes what the indicator measures — whether institutional players are accumulating shares on the way up or distributing them on the way down.
Chaikin later extended his work into the Chaikin Oscillator (the difference between 3-period and 10-period EMAs of the A/D Line) and Chaikin Money Flow (a fixed-period version that normalizes by total volume). All three indicators share the same philosophical foundation: volume matters more when you know where price closed within the bar. But the A/D Line itself remains the cleanest implementation of that idea — a single cumulative line that tracks the flow of money without additional smoothing or normalization.
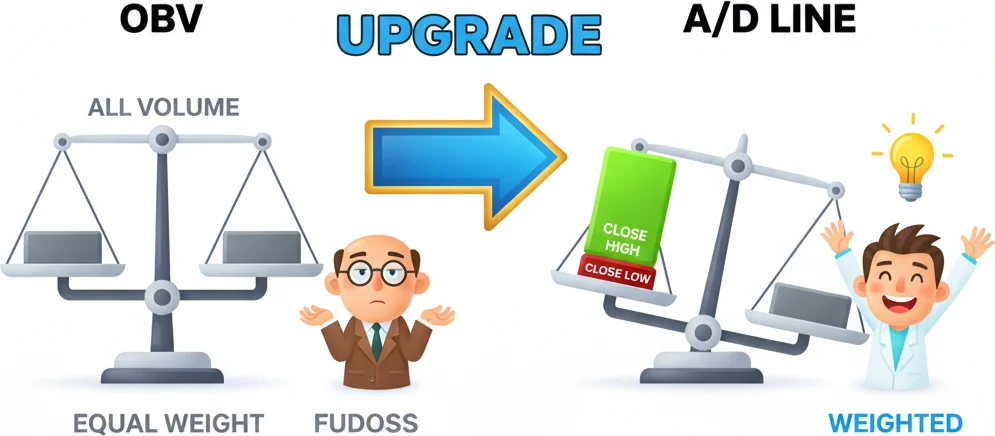
OBV counts all volume equally — Chaikin said "where the close sits within the bar matters way more."
2The CLV Formula: Where Price Closes Within the Bar
The A/D Line's calculation is a three-step process, and the first step — the Close Location Value — is where all the magic happens. Understanding the CLV is not just academic; it changes how you read candles on your chart because you start seeing every bar as a vote weighted by conviction.
The formula is:
CLV = [(Close - Low) - (High - Close)] / (High - Low)
This simplifies to:
CLV = (2 × Close - Low - High) / (High - Low)
The numerator measures how far the close is from the midpoint of the range. If the close is above the midpoint, the numerator is positive. If below, negative. The denominator normalizes this by the total range, producing a value between -1 and +1.
Let us run through a few examples to build intuition.
Example 1: Close at the high. A bar has High = 1.1050, Low = 1.1000, Close = 1.1050. CLV = [(1.1050 - 1.1000) - (1.1050 - 1.1050)] / (1.1050 - 1.1000) = (0.0050 - 0) / 0.0050 = +1.0. The full volume of this bar is added to the A/D Line. Buyers dominated completely.
Example 2: Close at the low. Same range, Close = 1.1000. CLV = [(1.1000 - 1.1000) - (1.1050 - 1.1000)] / 0.0050 = (0 - 0.0050) / 0.0050 = -1.0. The full volume is subtracted. Sellers won the session.
Example 3: Close at the midpoint. Close = 1.1025. CLV = [(1.1025 - 1.1000) - (1.1050 - 1.1025)] / 0.0050 = (0.0025 - 0.0025) / 0.0050 = 0. Volume contributes nothing. Neither side won.
Example 4: Close in the upper quarter. Close = 1.1040. CLV = [(1.1040 - 1.1000) - (1.1050 - 1.1040)] / 0.0050 = (0.0040 - 0.0010) / 0.0050 = +0.6. Sixty percent of the bar's volume counts as bullish accumulation. Buyers had the edge but not total control.
Once you have the CLV, step two multiplies it by the period's volume to get Money Flow Volume:
Money Flow Volume = CLV × Volume
Step three is cumulative addition:
A/D Line = Previous A/D Line + Money Flow Volume
The A/D Line starts from an arbitrary zero point — only the shape and direction matter, not the absolute level. This is identical to how OBV works: you never look at whether the line reads 50,000 or -20,000. You look at whether it is rising, falling, or diverging from price.
There is one edge case worth noting: if the High equals the Low (a doji with zero range), the CLV formula produces a division by zero. MT5 handles this by assigning a CLV of zero for that bar, effectively skipping it. This is rarely a problem on H1 or higher timeframes where true zero-range bars are extremely uncommon, but on M1 during low-liquidity hours you might encounter it.
Why this matters for reading your charts: Every candlestick on your screen carries a hidden CLV score that tells you how convincingly buyers or sellers won that particular bar. A tall bullish candle that closes near its high has a CLV near +1 — strong accumulation. A tall bullish candle that closes near its midpoint (long upper wick) has a CLV near 0 — the bulls pushed up but could not hold, and the volume was split. The A/D Line captures this nuance cumulatively across hundreds or thousands of bars, building a picture of whether money is flowing in or out over time.
On MT5, the A/D Line is found under Insert > Indicators > Volumes > Accumulation/Distribution. There are no user-adjustable parameters — no period to set, no smoothing to choose. It simply reads price and volume from each bar and adds to the cumulative total. This simplicity is a feature: there is nothing to over-optimize, nothing to curve-fit to historical data. The indicator does exactly one thing, and it does it transparently.

CLV gets squeezed between the high and low - closer to high means buying pressure!
“Divergence is the A/D Line's headline signal, and the logic behind it goes straight to the heart of what the indicator was built to detect: are institutional players quietly accumulating while the crowd panics, or are they distributing into retail enthusiasm? If volume precedes price — and that is the foundational assumption of every volume-based indicator — then the A/D Line should lead price at major turning points.”
3A/D Line Divergence: Smart Money Accumulating or Distributing?
Divergence is the A/D Line's headline signal, and the logic behind it goes straight to the heart of what the indicator was built to detect: are institutional players quietly accumulating while the crowd panics, or are they distributing into retail enthusiasm? If volume precedes price — and that is the foundational assumption of every volume-based indicator — then the A/D Line should lead price at major turning points.
Bullish divergence occurs when price makes a lower low but the A/D Line makes a higher low. Translation: price is falling, but the money flow calculation says that closes are favoring the upper portion of the range on volume. Even though the headline price is dropping, the internal structure suggests accumulation. Someone is buying the dips — and doing so with enough volume and enough conviction (closing near the highs of their bars) to push the A/D Line upward. When you spot this, the bears may be running out of ammunition. It does not mean price will immediately reverse, but the weight of money is shifting.
Bearish divergence is the mirror: price makes a higher high, but the A/D Line makes a lower high. Price is rising, but closes are increasingly favoring the lower portion of the bar's range. Volume on up-bars is being weighted toward the close-near-the-low side. Institutional players may be selling into the rally, distributing their positions to eager buyers who are chasing the new highs. The rally looks healthy on the price chart but the plumbing underneath is leaking.
The beauty of A/D divergence compared to oscillator divergence (RSI, Stochastic, MACD) is that the A/D Line incorporates volume. RSI divergence only tells you momentum is weakening — it says nothing about whether volume confirms or denies that weakness. A/D divergence tells you that volume-weighted money flow is disagreeing with price direction. That is a materially different and often stronger signal because it adds a supply-and-demand dimension.
How to trade A/D divergence in practice:
-
Identify the divergence on H4 or D1. These timeframes produce the cleanest divergences because each bar represents enough trading activity for the CLV calculation to be meaningful. On H1, divergences form more frequently but are shallower and less reliable. On M15, the noise overwhelms the signal.
-
Wait for price confirmation. This is the step most traders skip — and it costs them. Divergence is a warning, not an entry signal. A bullish A/D divergence tells you conditions are ripening for a reversal, but you still need price to confirm. That confirmation can be a break of a descending trendline, a bullish engulfing candle at support, or a close above the most recent swing high. Entering on divergence alone is like hearing thunder and running inside before checking if it is actually raining.
-
Place your stop below the divergence low (bullish) or above the divergence high (bearish). The divergence low is where the A/D Line made its higher low while price made its lower low. If price breaks below that low, the divergence thesis is dead — money flow was not strong enough.
-
Target the next structural level. For bullish reversals, that means the nearest resistance zone or a prior swing high. For bearish reversals, the nearest support.
Divergence duration matters. A divergence that builds over 10-15 bars on H4 is significantly more powerful than one that forms over 3-4 bars. The longer divergence represents a sustained disagreement between price and money flow — institutional accumulation or distribution is happening over multiple sessions, not just a single bar's quirk.
Combining A/D divergence with RSI: One of the highest-conviction setups in volume-based analysis is a simultaneous bullish divergence on both the A/D Line and RSI. When momentum (RSI) and money flow (A/D) both disagree with price, the odds of reversal increase substantially. The RSI confirms that selling momentum is exhausted, while the A/D Line confirms that volume is flowing to the buy side. Either signal alone can fail. Together, they form a much stronger case.
Where divergence fails: Trending markets. During a strong, sustained trend, the A/D Line can show bearish divergence for weeks or even months while price continues higher. This happens because profit-taking creates periodic closes near the lower portion of bars (pulling the A/D Line down) without actually reversing the trend. Think of it like a car still accelerating even though the driver has eased off the gas slightly — the car is not stopping, just not speeding up as fast. In strong trends, treat divergence as a signal to tighten stops rather than reverse positions. The trend remains your friend until price structure actually breaks.
A practical tip: Draw trendlines directly on the A/D Line itself, the same way you draw them on price. An A/D trendline break often precedes a price trendline break by several bars. This is the leading-indicator property of volume at work — money shifts before price does. If the A/D Line breaks its rising trendline while price is still holding its trendline, that is an early warning that the price break is coming.
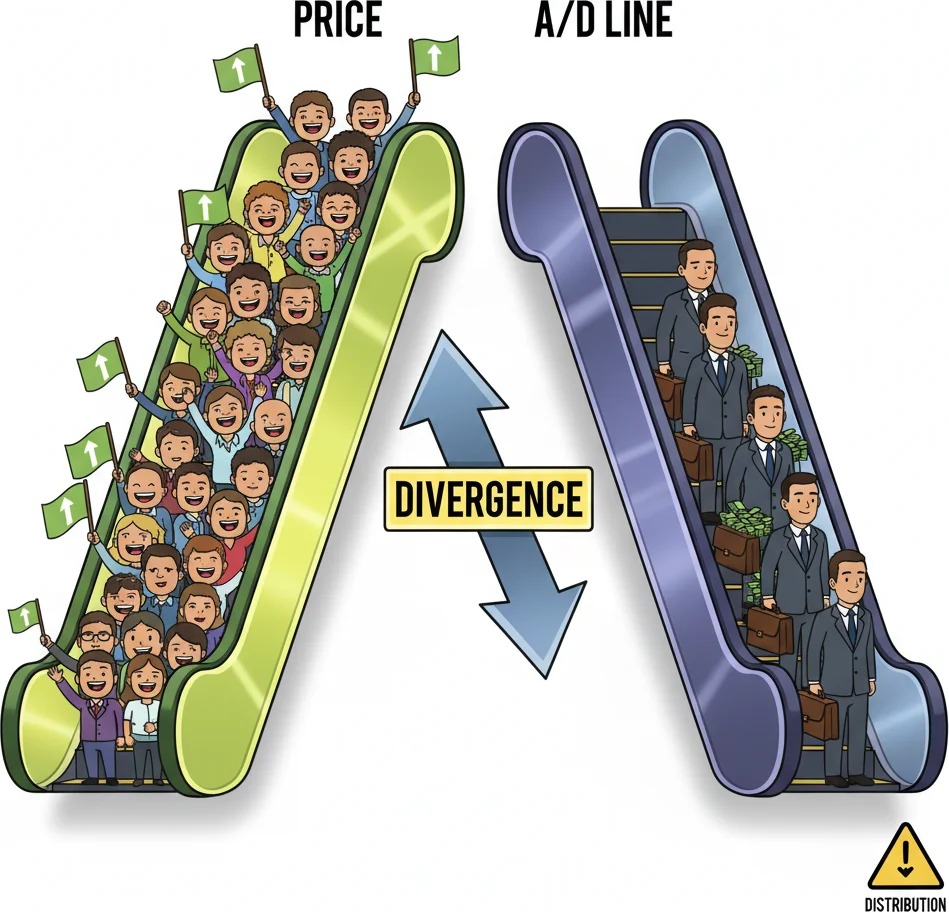
When price makes new highs but the A/D line is sneaking lower, smart money is heading for the exit.
4A/D Line vs OBV: Two Volume Indicators, One Clear Winner?
This is the comparison every volume-focused trader eventually encounters: do I use OBV or the A/D Line? The answer is not as straightforward as 'one is better' — they measure related but different things, and understanding where each excels (and where each fails) will make you a smarter trader than picking one and ignoring the other.
The fundamental difference: OBV is binary. If the close is above the previous close, the full volume is added. If below, the full volume is subtracted. OBV does not care where the close sits within the bar — only whether it is up or down versus the prior period. The A/D Line, as we have covered, uses the CLV multiplier to weight volume by the close's position within the bar's range. OBV assigns 100% of volume to one side. The A/D Line assigns a percentage based on the CLV.
This creates practical differences in specific scenarios:
Gap scenarios. A stock gaps down from 50 to 45 on the open, trades between 44 and 47, and closes at 46.50 — near the top of the day's range. OBV sees the close below the previous close (46.50 vs 50) and subtracts the full day's volume. Bearish reading. The A/D Line sees the close near the high of the 44-47 range, calculates a CLV of approximately +0.67, and adds 67% of the volume to the cumulative line. Bullish reading. Who is right? In this case, the A/D Line arguably captures reality better — despite the gap down, buyers were in control throughout the session. The price action within the bar was accumulation, even though the headline close was lower.
Inside bars. A narrow-range day where price closes exactly at the midpoint of its high-low range. OBV either adds or subtracts the full volume depending on whether the close is marginally above or below the prior close — potentially a large absolute contribution from a meaningless price move. The A/D Line assigns a CLV near zero and contributes almost nothing. In this case, the A/D Line is clearly more accurate: a bar where price goes nowhere should not significantly move a volume indicator.
Strong trend days. A bar that opens near the low, trends all day, and closes at the high. Both indicators agree here — OBV adds the full volume, and the A/D Line's CLV of +1.0 also adds the full volume. When price action is clean and directional, the two indicators converge.
So which is better? Neither, universally. But here is a practical framework:
Use the A/D Line when you care about intrabar quality. The A/D Line excels at detecting situations where the headline price move (up or down close) masks what actually happened during the session. Institutional accumulation often looks like this — price closes marginally lower, but the close is near the session high, and volume is above average. The A/D Line catches this. OBV does not.
Use OBV when you want simplicity and robustness. OBV's binary nature makes it immune to the edge cases that can affect the A/D Line (like zero-range bars). Its signals are unambiguous — volume is either going up or going down with price. For trend confirmation on daily charts where you just want to know whether volume supports the direction, OBV's simplicity is a strength.
Use both when you want confirmation. When OBV and the A/D Line agree — both rising in an uptrend, both falling in a downtrend — you have strong confirmation that volume is genuinely supporting price. When they disagree, you have valuable information: the close-to-close direction (OBV) and the intrabar money flow (A/D) are telling different stories, which suggests the trend may be less healthy than it appears.
The honest answer about 'one clear winner': There is not one. The A/D Line is more nuanced and captures intrabar dynamics that OBV misses. But that nuance comes with a cost — the A/D Line is more susceptible to misleading signals during gaps and on instruments where the high-low range does not accurately reflect the session's true trading activity. OBV is cruder but more resistant to noise on clean trending instruments. If you forced me to pick one for daily stock analysis, I would lean toward the A/D Line where the high-low range is meaningful. For forex where tick volume already introduces uncertainty into the volume component, OBV's simplicity may actually be an advantage since it avoids multiplying one approximation (tick volume) by another (CLV in a potentially gapped market).
One area where the A/D Line clearly wins: derivative indicators. The Chaikin Oscillator (3-period EMA minus 10-period EMA of the A/D Line) and Chaikin Money Flow (a bounded version) give you additional analytical tools. OBV has no widely-used derivative indicators. So if you want a volume analysis ecosystem rather than a single line on your chart, the A/D family offers more depth.

When A/D Line and price go opposite ways, smart money might be making their move.
“Here is the elephant in the room: the A/D Line was designed for stocks, where volume means actual shares traded on a centralized exchange.”
5A/D Line on Forex: Adapting a Stock Indicator to Currency Markets
Here is the elephant in the room: the A/D Line was designed for stocks, where volume means actual shares traded on a centralized exchange. Forex does not have centralized volume. What MT5 provides as 'volume' for forex pairs is tick volume — the number of price changes within a period, not the actual dollar or lot volume transacted. This is a real limitation, and pretending otherwise would be dishonest. But it does not make the A/D Line useless on forex. It makes it different.
Tick volume counts how many times price ticked (changed) during a bar. A bar with 500 ticks saw 500 price changes. A bar with 50 ticks saw 50. Research has shown a strong correlation between tick volume and actual transaction volume — periods of high activity produce both more ticks and more real volume, while quiet periods produce fewer of both. The correlation is not perfect, but it is consistent enough that tick volume serves as a reasonable proxy for activity level.
The A/D Line on forex therefore becomes a measure of 'activity-weighted close location' rather than 'volume-weighted close location.' When a forex bar closes near its high on a period with 800 ticks, the A/D Line adds a large positive value — not because we know 800 lots were traded, but because we know there were 800 price changes, which implies active participation. When the same close happens on 80 ticks, the contribution is much smaller. The directional logic is preserved even if the absolute values differ from what a stock-volume calculation would produce.
Where this works well:
H1 and above. Tick volume data tends to be noisy on very short timeframes because a single algorithmic order can generate dozens of ticks in seconds. On H1, H4, and D1, tick volume aggregates enough activity to smooth out these micro-bursts and produce a meaningful activity measure. The A/D Line on forex H4 charts produces divergence signals and trend confirmations that are qualitatively similar to what you would see on a stock daily chart.
Major pairs. EUR/USD, GBP/USD, USD/JPY, and other major pairs have the deepest liquidity and the most consistent tick-volume-to-real-volume correlation. On exotic pairs with thin liquidity, tick volume can be erratic — large price gaps from a single order create bars with few ticks but large ranges, which distorts the CLV calculation.
Trending conditions. During established trends on major pairs, the A/D Line tracks accumulation and distribution patterns reliably. A rising A/D Line during a EUR/USD uptrend on H4 confirms that price action within bars is consistently favoring closes near the highs — regardless of whether the volume is tick-based or real.
Where it struggles:
News releases. Major economic announcements create enormous tick volume spikes that can distort the A/D Line for several bars. A single NFP candle might have 5x the tick volume of a normal bar, and its close location (which can be erratic during news volatility) gets amplified by that volume spike. Some traders exclude news bars from their A/D analysis by mentally discounting the line's movement during known high-impact events.
Low-liquidity sessions. During the Asian session on European pairs, or during holidays, tick volume drops to levels where the A/D Line's readings become almost meaningless. A bar with 30 ticks closing near its high does not represent meaningful accumulation — it represents a thin market where one mid-size order can push price to the range extreme.
Cross-broker inconsistency. Since tick volume is broker-specific (each broker counts ticks from their own liquidity feed), the A/D Line will look slightly different on different brokers' MT5 platforms. The general shape and direction will be similar, but exact values and minor divergences may not match across platforms. Use one broker consistently and do not compare A/D Line charts between platforms.
Practical setup for forex traders:
-
Apply the A/D Line to H4 charts of major pairs. This is the sweet spot for forex — enough tick volume per bar to be meaningful, and slow enough that divergence signals have time to develop.
-
Use the A/D Line primarily for divergence and trend confirmation, not as a standalone entry tool. On forex, the A/D Line works best as a filter that tells you whether the weight of activity supports or contradicts the price trend.
-
Combine with RSI or MACD for entries. Let the A/D Line confirm or deny the momentum signal. If RSI shows oversold on H4 and the A/D Line is making a higher low (bullish divergence), you have a stronger case for a long entry than either indicator alone.
-
Ignore the A/D Line during the first 30 minutes after major news releases. Let the dust settle and the tick volume normalize before reading the line again.
-
On D1 charts, the A/D Line can spot multi-week accumulation or distribution phases that precede significant trend changes. A rising A/D Line while price is flat or slightly declining on the daily chart of EUR/USD suggests that the consolidation will eventually resolve upward. This is where the 'smart money' narrative is most compelling — institutional positioning happens quietly over days and weeks, and the A/D Line on daily charts is designed to detect exactly that.
Bottom line for forex traders: The A/D Line on forex is not what Chaikin designed — he built it for stocks with real exchange volume. But tick volume as a proxy preserves enough of the original logic to make the indicator worthwhile on H1 and above for major pairs. Treat it as a probabilistic tool rather than a precise measure. It tells you the likely direction of money flow, not the exact amount. And in trading, likely direction is usually all you need.
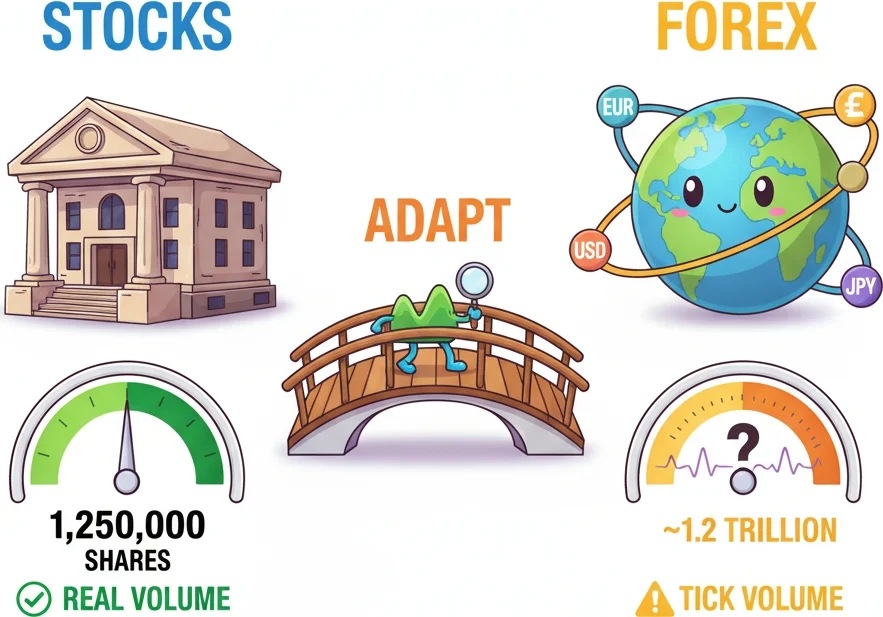
The A/D line was born in stocks where volume is real — in forex, tick volume is the best substitute we have got.
Frequently Asked Questions
Q1What is the Accumulation/Distribution Line and how is it calculated?
The Accumulation/Distribution Line is a cumulative volume-based indicator developed by Marc Chaikin in the 1980s. It measures money flow by calculating the Close Location Value (CLV) — which ranges from -1 to +1 based on where price closes within the bar's high-low range — and multiplying it by volume. That result is added to a running total. A close near the high on heavy volume pushes the line up (accumulation), while a close near the low on heavy volume pulls it down (distribution). Unlike OBV, which treats all volume as fully bullish or bearish based on close direction, the A/D Line weights volume proportionally based on the close's position within the range.
Q2How do I spot divergence on the A/D Line?
Bullish divergence occurs when price makes a lower low but the A/D Line makes a higher low — money is flowing in despite falling prices. Bearish divergence is the opposite: price makes a higher high while the A/D Line makes a lower high. These divergences are most reliable on H4 and D1 timeframes, and they work best when confirmed by a price action signal such as a trendline break, engulfing candle, or support/resistance test. Divergence alone is a warning rather than an entry trigger — always wait for price to confirm before acting.
Q3Does the A/D Line work on forex since there is no real volume?
It works, but with caveats. Forex on MT5 uses tick volume (number of price changes per bar) instead of real transaction volume. Research shows tick volume correlates reasonably well with actual activity on major pairs and higher timeframes. The A/D Line on forex H4 and D1 charts of EUR/USD, GBP/USD, and USD/JPY produces useful divergence and trend confirmation signals. It is less reliable on exotic pairs, during low-liquidity sessions, and on timeframes below H1 where tick noise dominates. Treat it as an activity-weighted measure rather than a precise volume tool.
Q4What is the difference between the A/D Line, Chaikin Oscillator, and Chaikin Money Flow?
All three share the same CLV foundation but present the data differently. The A/D Line is the raw cumulative total — it runs forever and shows the overall trend of money flow. The Chaikin Oscillator takes two exponential moving averages of the A/D Line (3-period and 10-period) and subtracts them, creating a bounded oscillator that highlights short-term changes in accumulation or distribution momentum. Chaikin Money Flow normalizes the A/D calculation over a fixed period (typically 20 bars) and divides by total volume, producing a value between -1 and +1 that resets each period. Use the A/D Line for trend-level flow analysis, the Oscillator for timing entries, and CMF for comparing money flow strength across different instruments.
Q5Can the A/D Line give false signals, and how do I avoid them?
Yes, particularly in three situations. First, during strong trends, the A/D Line can show bearish divergence for extended periods while price continues rising — treat trend divergence as a caution flag, not an automatic reversal signal. Second, price gaps distort the reading because a gap down with a close near the bar's high produces a positive CLV even though the overall price movement was bearish. Third, on forex, tick volume spikes during news releases can create misleading jumps in the A/D Line. To filter false signals, combine the A/D Line with RSI or MACD for momentum confirmation, use it primarily on H4 and D1 timeframes, and always require a price structure confirmation before entering trades based on A/D divergence.
Top Brokers
About the Author
Daniel Harrington
Senior Trading Analyst
Daniel Harrington is a Senior Trading Analyst with a MScF (Master of Science in Finance) specializing in quantitative asset and risk management. With over 12 years of experience in forex and derivatives markets, he covers MT5 platform optimization, algorithmic trading strategies, and practical insights for retail traders.
Use This Indicator
Risk Disclaimer
Trading financial instruments carries significant risk and may not be suitable for all investors. Past performance does not guarantee future results. This content is for educational purposes only and should not be considered investment advice. Always conduct your own research before trading.