ADX Indicator Guide: Measure Trend Strength & Filter Your Trades
ADX measures the strength of a trend regardless of its direction, with values above 25 indicating a strong trend and below 20 a weak or ranging market.

Daniel Harrington
Senior Trading Analyst · MT5 Specialist
☕ 14 min read
Settings — ADX
| Category | trend |
| Default Period | 14 |
| Best Timeframes | H1, H4, D1 |
Here is a question that trips up nearly every beginner: what if an indicator could tell you a trend is strong without telling you which way it is going? That is exactly what the Average Directional Index does, and it is the reason J. Welles Wilder created it back in 1978. The ADX reads between 0 and 100, yet the vast majority of actionable signals happen between 20 and 50. Below 20, the market is sleepwalking. Above 25, something real is happening. The trick is knowing what to do with that information — and that is what this guide is here for.
Key Takeaways
- Most indicators try to answer one question: is the market going up or down? The ADX completely ignores that question. In...
- The ADX scale runs from 0 to 100, but not all zones are created equal. Think of it like a car speedometer. Zero means yo...
- The ADX line measures strength, but it travels with two companions that provide the direction it intentionally ignores: ...
1The Indicator That Doesn't Care About Direction
Most indicators try to answer one question: is the market going up or down? The ADX completely ignores that question. Instead, it answers something arguably more useful: how strong is the current move, regardless of direction?
Think of it this way. Imagine you are standing on a beach watching the ocean. You can see waves coming in, and you can see waves going out. The ADX is not interested in which direction the water moves. It only measures how tall the waves are. A rising ADX at 40 during a downtrend on GBP/USD tells you the same thing as a rising ADX at 40 during an uptrend on EUR/JPY — the trend is strong, full stop.
Wilder built the ADX as the final layer of his Directional Movement System. The calculation starts with two components called +DM (positive directional movement) and -DM (negative directional movement). These raw values get smoothed over a default period of 14 bars, then divided by the Average True Range to produce +DI and -DI — two percentage lines that do carry directional meaning. The ADX itself is derived from the smoothed difference between those two DI lines.
Because the ADX is triple-smoothed, it lags behind price. This is not a flaw — it is the design. A reading above 25 confirms that a trend is already underway and has enough momentum to be worth trading. It does not predict the next trend. It validates the current one.
This distinction matters more than most traders realize. If you only use indicators that tell you direction, you will inevitably enter trades during choppy, directionless markets where neither bulls nor bears have conviction. The ADX exists to keep you out of those traps. When ADX sits below 20 on the EUR/USD daily chart, that pair is range-bound, and any breakout signal from another indicator is far less reliable.
Wilder published the ADX in his 1978 book alongside the RSI and the ATR. Nearly five decades later, the ADX is still standard on every serious charting platform — MetaTrader 5, TradingView, NinjaTrader, and others. That longevity is not an accident. Few indicators have survived this long because few indicators answer a question this fundamental: is it worth trading right now?
The practical takeaway is simple. Before you decide to go long or short, check the ADX. If it is below 20, consider staying on the sidelines. If it is above 25 and rising, you have a green light to look for entries in the direction confirmed by +DI and -DI. The ADX will not tell you where to aim, but it will tell you whether there is any point in pulling the trigger.
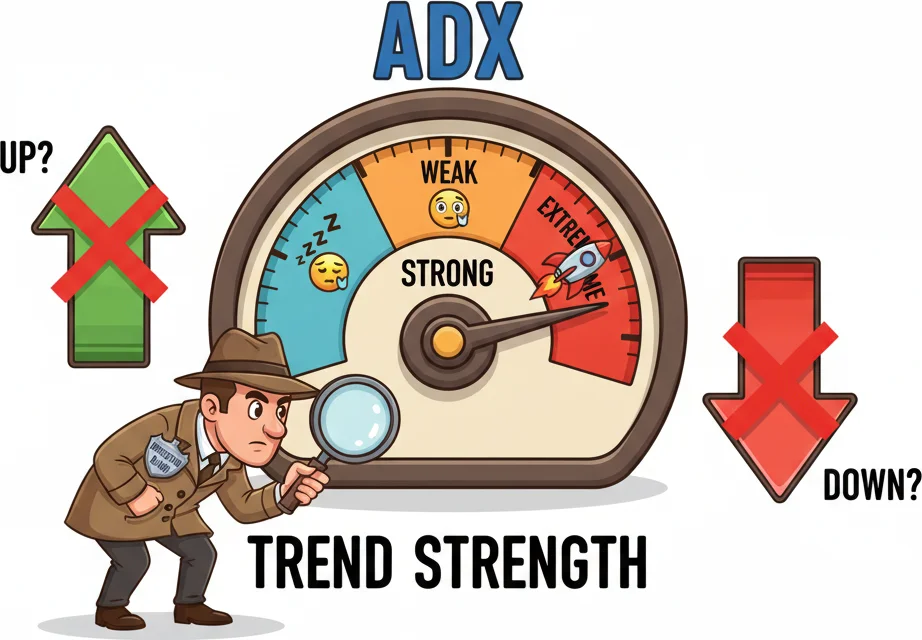
ADX does not care if the market goes up or down — it only asks one question: how strong is this trend?
2Reading ADX Like a Dashboard: 0-25-50-75-100
The ADX scale runs from 0 to 100, but not all zones are created equal. Think of it like a car speedometer. Zero means you are parked. Twenty-five means you are on a proper road. Fifty means you are on the highway. And 75-plus? That is territory most markets rarely visit — like redlining the engine.
Here is the breakdown that professional traders actually use:
| ADX Range | Market Condition | What You Should Do |
|---|---|---|
| 0–20 | No trend / very weak | Avoid trend-following strategies. Consider range-bound setups. |
| 20–25 | Trend possibly forming | Watch closely. Prepare entries but wait for confirmation. |
| 25–50 | Strong trend | This is the sweet spot. Most profitable trend trades happen here. |
| 50–75 | Very strong trend | Trend is powerful but may be approaching exhaustion. Trail stops. |
| 75–100 | Extremely strong (rare) | Almost never reached. Usually signals a climactic move. |
Now, here is something that catches people off guard: an ADX of 40 during a downtrend on USD/JPY is exactly as significant as an ADX of 40 during an uptrend on AUD/USD. The number measures intensity, not direction. A common beginner mistake is assuming that a high ADX is bullish. It is not. It just means the current trend — whichever direction it runs — has conviction behind it.
In practice, the 25 threshold is the most important number you will use. Wilder himself established this level as the dividing line between trending and non-trending conditions. Decades of backtesting across forex, equities, and commodities have confirmed it holds up remarkably well. When a moving average crossover fires while ADX sits at 18, the odds of a false signal are significantly higher than when the same crossover fires with ADX at 32.
The zone between 20 and 25 is what many traders call the gray area. The market may be waking up, or it may just be rolling over in its sleep. The safest approach is to treat this zone as a preparation phase — identify potential setups, mark key levels, but hold off on committing real capital until ADX decisively crosses above 25.
Here is a real-world scenario. In early 2024, GBP/JPY on the H4 chart showed ADX climbing from 15 to 22 over about a week. The +DI line was above -DI, hinting at bullish momentum, but the ADX had not confirmed a strong trend. Traders who waited for ADX to cross above 25 before entering long positions caught a 400-pip rally over the following two weeks. Those who jumped in at ADX 18 faced a 150-pip drawdown before the move materialized.
Readings above 50 deserve caution rather than excitement. When ADX pushes into this territory, the trend is undeniably powerful — but it is also consuming energy. Markets cannot sustain ADX above 50 indefinitely. On the daily chart, most forex pairs spend less than 10% of the time above that level. If you are already in a trade and see ADX cross 50, that is a signal to tighten your stop-loss, not to add to your position.
The speedometer analogy holds throughout. You would not drive 150 km/h through a neighborhood, and you would not try to trend-trade in a market with an ADX of 12. Match your strategy to the current speed, and you avoid most of the unnecessary losses.

Reading ADX levels like a dashboard - always keep your eyes on the strength meter!
“The ADX line measures strength, but it travels with two companions that provide the direction it intentionally ignores: the Positive Directional Indicator (+DI) and the Negative Directional Indicator (-DI).”
3The +DI/-DI Crossover: Where ADX Gets Directional
The ADX line measures strength, but it travels with two companions that provide the direction it intentionally ignores: the Positive Directional Indicator (+DI) and the Negative Directional Indicator (-DI). Together, these three lines form the complete Directional Movement System — and the crossovers between +DI and -DI produce some of the clearest trend signals in technical analysis.
The logic is straightforward. When +DI is above -DI, buyers are exerting more directional pressure than sellers. When -DI is above +DI, sellers are in control. The moment they cross, control is shifting. Simple enough, right?
The catch is that a crossover alone is not a trade signal. It is half a signal. The other half comes from the ADX line itself. Wilder's original system requires the ADX to be above 25 (or at minimum rising above 20) before any crossover is considered actionable. Without that filter, crossovers in a flat, trendless market will chop your account to pieces.
Here is how a well-filtered trade looks in practice:
Bullish setup on EUR/USD H4 (example):
- ADX is at 28 and rising — confirming a strong trend environment.
- +DI crosses above -DI — directional control shifts to buyers.
- Entry: buy at the close of the crossover candle.
- Stop-loss: below the most recent swing low (or use a 1.5x ATR distance).
- Exit: when ADX starts declining from a peak, or when -DI crosses back above +DI.
Bearish setup on USD/CAD D1 (example):
- ADX reads 31 and trending higher — trend conditions confirmed.
- -DI crosses above +DI — sellers take directional control.
- Entry: sell at the close of the crossover candle.
- Stop-loss: above the most recent swing high.
- Exit: when ADX turns down or +DI reclaims -DI.
One subtlety that separates experienced traders from beginners: pay attention to the gap between +DI and -DI, not just which one is on top. A wide spread — say +DI at 35 and -DI at 12 — indicates strong directional conviction. A narrow spread with both lines tangled around each other — +DI at 22 and -DI at 20 — suggests indecision, even if technically one is above the other. The wider the spread during a crossover, the more reliable the signal.
| Signal | Condition | Reliability |
|---|---|---|
| +DI crosses above -DI | ADX > 25 and rising | High |
| +DI crosses above -DI | ADX between 20-25 | Moderate — wait for ADX confirmation |
| +DI crosses above -DI | ADX < 20 | Low — likely a false signal |
| -DI crosses above +DI | ADX > 25 and rising | High |
| -DI crosses above +DI | ADX < 20 | Low — avoid |
A common trap: multiple crossovers in quick succession. When +DI and -DI keep flipping back and forth over a few candles, the market is undecided. The ADX will usually confirm this by sitting below 20 or declining. Do not chase these whipsaws. Wait for a clean crossover where one line pulls away decisively and ADX supports it.
On MetaTrader 5, the ADX indicator displays all three lines by default. The +DI is typically green, -DI is red, and the ADX line is a darker color. Some traders add a horizontal line at 25 as a visual reference so they can immediately see whether crossovers are occurring in a trending or non-trending environment.
The crossover system works best on H1, H4, and D1 timeframes. On anything below H1, the noise-to-signal ratio increases sharply, and you will see far more false crossovers than actionable ones.
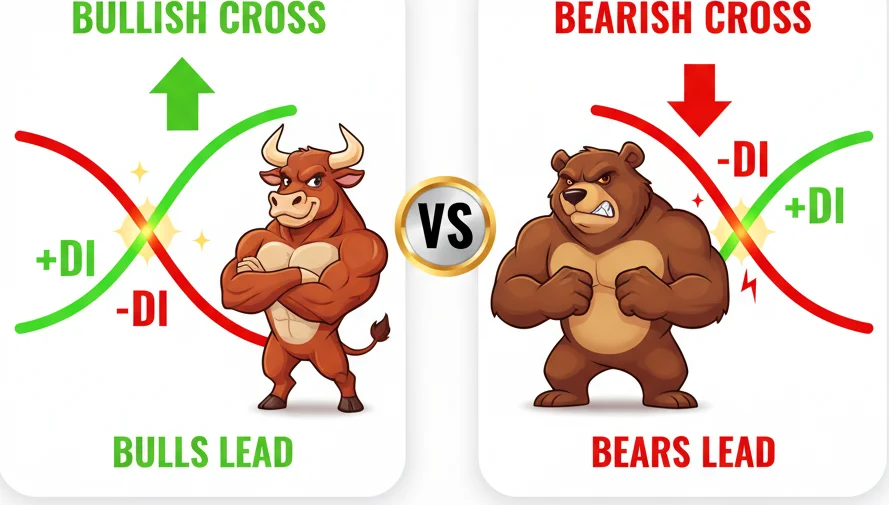
When +DI crosses above -DI, the bulls take charge. The reverse? Bears are driving now.
4ADX as a Filter: The One Rule That Saves Most Strategies
If you could add only one rule to any trend-following strategy to immediately improve its performance, this would be it: do not take the trade unless ADX is above 25.
That single filter eliminates a surprising percentage of losing trades. The reason is mechanical. Most trend-following strategies — moving average crossovers, breakout systems, momentum entries — generate signals whether or not a genuine trend exists. In a flat, range-bound market, those signals are noise. They trigger entries that go nowhere, accumulate small losses, and grind down your account through a thousand paper cuts. The ADX filter removes the noise at the source.
Consider a straightforward 20/50 EMA crossover strategy on EUR/USD H4. Without any filter, it generates roughly 25-35 signals per year. A significant portion of those signals occur during low-ADX periods when the pair is consolidating between support and resistance. Adding the condition "ADX(14) must be above 25 at the time of the crossover" typically cuts the signal count by 30-40% — but the remaining signals have a materially higher win rate because they occur in genuine trending conditions.
Here is what that looks like in practice:
Without ADX filter:
- EMA crossover fires on EUR/USD H4
- ADX reads 16 — market is range-bound
- Price moves 20 pips in your favor, then reverses 50 pips
- Result: stop-loss hit
With ADX filter:
- EMA crossover fires on EUR/USD H4
- ADX reads 16 — filter says no trade
- You sit on your hands
- Next crossover fires when ADX is at 29
- Price moves 180 pips in your direction over the next several sessions
- Result: profitable trend trade captured
The beauty of this approach is its simplicity. You do not need to re-engineer your existing strategy. You do not need complex multi-indicator confluences. You just add one condition: ADX above 25. Everything else stays the same.
Some traders refine this further by using a tiered approach:
| ADX Level | Position Size | Strategy Adjustment |
|---|---|---|
| Below 20 | No trade | Wait for trend development |
| 20–25 | Half position | Enter with tighter stops, scale in if ADX confirms |
| 25–40 | Full position | Normal trend-following execution |
| 40+ | Full position, trail aggressively | Trend is mature — protect profits |
This framework works across instruments and timeframes. A breakout strategy on gold (XAU/USD) benefits from the same filter. A MACD divergence setup on USD/JPY D1 becomes more reliable with the ADX condition. Even a simple support-and-resistance bounce strategy can use a low ADX reading (below 20) as confirmation that range conditions favor mean-reversion entries.
The ADX filter is especially powerful during major economic events. Before an FOMC announcement, ADX often compresses below 20 as the market coils. Immediately after the release, ADX spikes. Traders who wait for ADX to cross above 25 after the announcement avoid the initial volatility whipsaw and enter the established trend rather than guessing the direction during the chaos.
One caveat: the ADX filter does not improve counter-trend strategies. If you are trading reversals, you actually want a declining ADX (meaning the existing trend is weakening). The filter is specifically designed for trend-following approaches — and for those, it is one of the highest-value additions you can make with minimal effort.

ADX filters out all that market noise - no more getting whipsawed by fake moves!
“Most ADX tutorials focus on the rising part — ADX going up means the trend is strong, trade it.”
5When ADX Peaks and Falls: The Exhaustion Signal Nobody Teaches
Most ADX tutorials focus on the rising part — ADX going up means the trend is strong, trade it. But some of the most valuable information comes from what happens when ADX stops rising and starts to fall. This is the exhaustion signal, and it is criminally undertaught.
Here is the core concept: when ADX reaches a peak (typically above 40-50) and then begins to decline, the trend is losing internal momentum. The participants who drove the move are stepping back. Volume and conviction are fading. The price might still be making new highs or new lows — but the engine behind it is running out of fuel.
This is not the same as a reversal signal. That distinction matters enormously. A declining ADX after a peak tells you the trend is weakening. It does not tell you the trend is reversing. The market might consolidate sideways for days or weeks, then resume in the same direction. Or it might reverse. The ADX does not predict which outcome follows — it only tells you that the easy money in the current trend is likely over.
Let us walk through a real-world pattern. Suppose you are long AUD/USD on the H4 chart. You entered when +DI crossed above -DI with ADX at 28 and rising. Over the next two weeks, ADX climbed to 48 while the pair rallied 250 pips. Excellent trade so far. Then you notice ADX has peaked at 48 and is now falling — 45, then 41, then 37. Meanwhile, price is still making marginal new highs. This is a classic ADX divergence.
What should you do? There are three practical responses:
-
Tighten your stop-loss. Move it to just below the most recent swing low. If the trend resumes, you stay in. If it breaks down, you lock in most of your gains.
-
Take partial profits. Close 50-70% of your position and let the remainder ride with a trailing stop. This captures the bulk of the move while leaving room for continuation.
-
Stop adding to the position. Even if other indicators flash buy signals, a declining ADX after a peak is a warning to stop scaling in.
The divergence pattern between price and ADX deserves special attention. When price makes a higher high but ADX makes a lower high compared to its previous peak, buying pressure is eroding beneath the surface. This pattern has historically preceded significant pullbacks across major forex pairs. It appeared on EUR/USD D1 in late 2023 before a multi-week retracement, and it showed up on GBP/USD H4 multiple times during trending phases in 2024.
| ADX Behavior | Price Action | Interpretation | Suggested Action |
|---|---|---|---|
| ADX rising above 25 | Trending (up or down) | Trend is strengthening | Enter or hold positions |
| ADX peaks above 40-50 | Still trending | Momentum is maxing out | Prepare for slowdown |
| ADX declining from peak | Price still trending | Trend losing steam | Tighten stops, take partial profits |
| ADX declining below 25 | Price flattening | Trend effectively over | Exit trend trades, look for range setups |
| ADX making lower peaks | Price making new highs/lows | Bearish/bullish divergence | High probability of reversal or deep pullback |
There is a secondary pattern worth knowing: the ADX hook. When ADX is above 25 and briefly dips, then turns back up, the trend is taking a breath — not dying. This often corresponds to a pullback within a larger trend. Traders who mistake every ADX dip for exhaustion exit too early and miss the continuation.
The difference between a genuine peak-and-decline versus a temporary hook comes down to context. A hook happens mid-trend with ADX between 25 and 35, dips for a few bars, then resumes climbing. Exhaustion happens after an extended move with ADX above 40-50, followed by a sustained decline over multiple bars. Learning to distinguish the two will save you from both premature exits and overstaying your welcome.
The bottom line: the ADX rising above 25 gets you into trends. The ADX peaking and falling gets you out of them with your profits intact. Most traders only learn the first half.
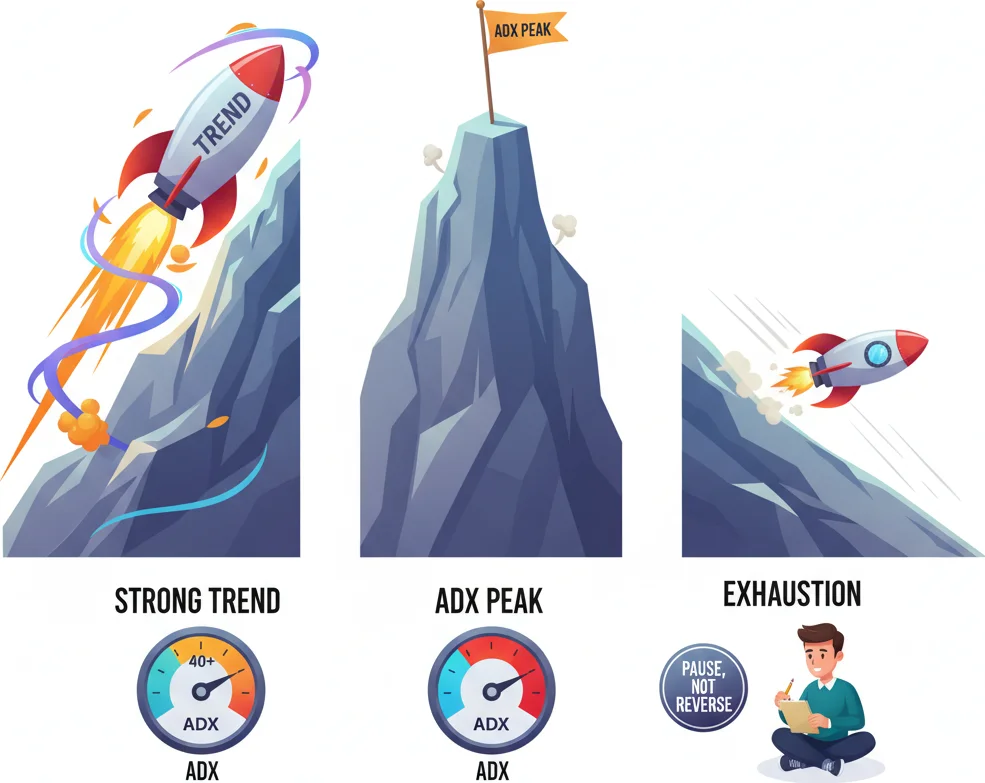
When ADX peaks above 40 and starts dropping, the trend is not reversing — it is just catching its breath.
Frequently Asked Questions
Q1What is a good ADX setting for forex day trading?
For day trading on H1 charts, a period of 20-28 works better than the default 14, because 14 bars on H1 cover only 14 hours and can produce noisy readings. Many day traders also raise the trend threshold from 25 to 30 on H1 to filter out short-lived volatility spikes that do not reflect genuine trends. On H4 charts, a period of 20-21 approximates the same time window as the standard 14-period on D1.
Q2Can ADX be used for scalping on M5 or M15?
It can, but with significant caveats. The ADX is triple-smoothed, which means it lags by design. On M5 or M15, that lag often means the signal arrives after the move has already played out. If you do use ADX on lower timeframes, consider shortening the period to 7-10 and accepting that false signals will increase. Most professional scalpers prefer to use ADX on a higher timeframe (H1 or H4) as a background filter and execute entries using price action or faster indicators on M5 or M15.
Q3What does it mean when ADX is above 25 but falling?
A falling ADX above 25 means the trend still exists but is losing momentum. The market was trending strongly and is now decelerating. This is not a reversal signal — the price may continue in the same direction, consolidate, or eventually reverse. The practical response is to tighten your stop-loss on existing positions, avoid opening new trend trades, and watch for a decisive break of key support or resistance levels to determine what comes next.
Q4Should I use ADX alone or combine it with other indicators?
ADX works best as a filter rather than a standalone signal generator. It tells you whether conditions favor trend trading, but it does not provide precise entries or exits on its own. Combining ADX with a moving average crossover (like the 20/50 EMA) is one of the most popular approaches: the EMA crossover generates the directional signal, and ADX above 25 confirms the trend environment. Adding RSI can help identify overbought or oversold conditions within the trend for timing pullback entries.
Q5Why does ADX sometimes stay low even when the price is moving?
This usually happens during choppy, back-and-forth price action. The market may move 100 pips up and then 80 pips down within a few sessions. While individual candles show large ranges, there is no sustained directional movement — which is exactly what ADX measures. ADX responds to the consistency of direction, not the size of individual candles. A pair like GBP/JPY can have high volatility (large ATR) but low ADX if that volatility does not produce a persistent trend in one direction.
Top Brokers
About the Author
Daniel Harrington
Senior Trading Analyst
Daniel Harrington is a Senior Trading Analyst with a MScF (Master of Science in Finance) specializing in quantitative asset and risk management. With over 12 years of experience in forex and derivatives markets, he covers MT5 platform optimization, algorithmic trading strategies, and practical insights for retail traders.
Use This Indicator
Risk Disclaimer
Trading financial instruments carries significant risk and may not be suitable for all investors. Past performance does not guarantee future results. This content is for educational purposes only and should not be considered investment advice. Always conduct your own research before trading.