ATR Trailing Stop: Volatility-Adjusted Exit Strategy for Forex & Stocks
ATR Trailing Stop uses a multiple of ATR to place a dynamic stop-loss that adapts to current market volatility, protecting profits while allowing room for normal fluctuations.

Daniel Harrington
Senior Trading Analyst · MT5 Specialist
☕ 19 min read
Settings — ATR-TS
| Category | volatility |
| Default Period | 14 |
| Best Timeframes | M15, H1, H4 |
Here is a universal truth about trading: fixed pip stops are a lazy shortcut that costs you money. Setting a 50-pip stop-loss on EUR/USD during a sleepy Asian session and then using the same 50 pips during a Fed announcement is like wearing the same outfit to both a beach party and a job interview — technically possible, but clearly wrong for at least one situation. The ATR Trailing Stop solves this by anchoring your exit to actual market volatility. It takes the Average True Range (ATR), multiplies it by a factor you choose, and subtracts that from the recent high to create a stop that expands when markets get wild and tightens when they calm down. Developed from J. Welles Wilder Jr.'s ATR work and refined by traders like Chuck LeBeau, this indicator is now a staple on MetaTrader 5, TradingView, and virtually every serious platform. If you have ever been stopped out by normal market noise one bar before price reversed in your favor, this guide is for you.
Key Takeaways
- Let us start with the uncomfortable math. If you use a fixed 40-pip stop-loss on every EUR/USD trade, you are implicitly...
- The calculation behind the ATR Trailing Stop involves two components: the ATR itself and the trailing logic that prevent...
- The multiplier is the single most important setting in the ATR Trailing Stop, and getting it right for your trading styl...
1Why Fixed Pip Stops Kill Your Trading (And How ATR Fixes It)
Let us start with the uncomfortable math. If you use a fixed 40-pip stop-loss on every EUR/USD trade, you are implicitly assuming that volatility never changes. But the 14-period ATR on EUR/USD H4 swings between 25 pips during dead summer weeks and 80+ pips during central bank decisions. A 40-pip stop during a 25-pip ATR environment means your stop sits nearly two full ATRs away from price — unnecessarily wide, wasting risk capital, and giving back profits you already earned. That same 40-pip stop during an 80-pip ATR session means you are sitting at only 0.5 ATR from price. Normal market breathing will clip your stop before the trade has any chance to develop.
This is not a minor inefficiency. It is a structural flaw that bleeds your account in two directions simultaneously. In calm markets, your risk-reward ratio deteriorates because the stop is too far relative to realistic targets. In volatile markets, you get stopped out by noise and then watch price move exactly where you predicted — without you.
The ATR Trailing Stop eliminates this by making your stop a function of current volatility. The formula is simple:
- Long trades: Trailing Stop = Highest Close (over N periods) − (ATR × Multiplier)
- Short trades: Trailing Stop = Lowest Close (over N periods) + (ATR × Multiplier)
The default settings use a 14-period ATR with a 3x multiplier. On EUR/USD H4 with an ATR of 35 pips, your trailing stop sits 105 pips below the highest recent close. If volatility spikes to 70 pips after an ECB meeting, the stop automatically widens to 210 pips — giving the trade room to breathe without you touching anything. When volatility compresses back to 30 pips during a holiday week, the stop tightens to 90 pips, locking in more profit.
The trailing mechanism is key. Unlike a static ATR stop placed at entry, the trailing version only moves in your favor. For a long trade, it ratchets upward as price makes new highs and never moves back down. This means it serves double duty: protecting against adverse moves (the stop-loss function) and locking in profits as the trend extends (the trailing function). You get a dynamic exit that adapts to the market instead of forcing the market to adapt to your arbitrary number.
Here is a practical comparison to illustrate the difference:
| Scenario | Fixed 50-pip Stop | ATR Trailing Stop (14, 3x) |
|---|---|---|
| EUR/USD quiet session (ATR 30 pips) | 1.67 ATR away — too loose | 90 pips — proportionally correct |
| EUR/USD NFP day (ATR 75 pips) | 0.67 ATR away — noise kills it | 225 pips — survives the volatility |
| GBP/JPY trending day (ATR 120 pips) | 0.42 ATR — instant death | 360 pips — rides the move |
| USD/CHF range day (ATR 20 pips) | 2.5 ATR — risk wasted | 60 pips — tight and efficient |
Notice the pattern. The ATR Trailing Stop always positions itself at the same relative distance from price — three ATRs in this example — regardless of whether the market is moving 20 pips per bar or 120 pips per bar. This proportional consistency is what makes it so effective across different instruments, timeframes, and market conditions.
One thing to understand: the ATR Trailing Stop is primarily an exit tool, not an entry tool. Some traders use the color change (when the stop flips from above price to below, or vice versa) as an entry signal, and it can work in strongly trending markets. But in ranging conditions, these flip signals produce whipsaws. The indicator's real strength is managing an open position that you entered using other criteria — price action, support and resistance, or another indicator's signal.
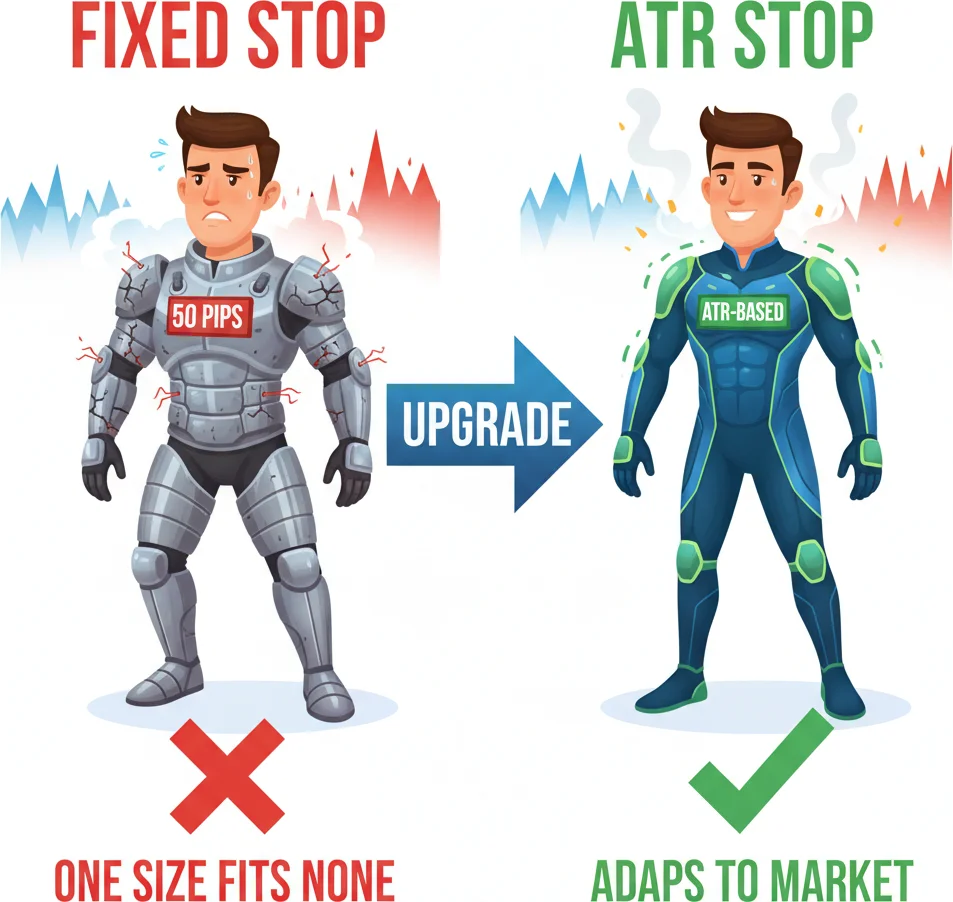
A fixed 50-pip stop on a volatile pair is like wearing the same shoes for running and swimming.
2The ATR Trailing Stop Formula: Highest Close Minus ATR × Multiplier
The calculation behind the ATR Trailing Stop involves two components: the ATR itself and the trailing logic that prevents the stop from moving against your trade. Let us walk through each piece.
Step 1 — Calculate the Average True Range
True Range for each bar is the greatest of three values:
- Current High minus Current Low
- Absolute value of Current High minus Previous Close
- Absolute value of Current Low minus Previous Close
The second and third calculations account for gaps. If yesterday's close was 1.1050 and today's bar opens at 1.1080 with a low of 1.1070, the actual range of movement includes that gap up from 1.1050, not just the distance from 1.1070 to the high. In forex, where gaps mainly appear at the Sunday open, the True Range often equals the simple High minus Low. On stocks and indices with daily opening gaps, this adjustment matters significantly.
The ATR is then a moving average (typically Wilder's smoothing method or a simple moving average) of the True Range over 14 periods. Wilder's smoothing gives slightly more weight to recent bars, making the ATR respond a touch faster to volatility changes.
Step 2 — Apply the multiplier
Multiply the 14-period ATR by your chosen factor. The default is 3, so if ATR equals 42 pips on EUR/USD H4, the distance is 42 × 3 = 126 pips.
Step 3 — Subtract from the anchor price
For a long trailing stop, subtract the ATR × Multiplier value from the highest close over the lookback period. Some implementations use the highest high instead of the highest close — the difference is subtle. Using the close is slightly more conservative because closes tend to be inside the bar's range, producing a stop that is marginally tighter. Using the high gives a wider stop that survives more intrabar spikes.
- Long Stop = Highest Close (14 periods) − (ATR14 × 3)
- Short Stop = Lowest Close (14 periods) + (ATR14 × 3)
Step 4 — Apply the trailing rule
This is the critical piece. On each new bar:
- For a long stop: if the newly calculated stop value is higher than the previous stop, adopt the new value. If it is lower, keep the previous value. The stop only ratchets up.
- For a short stop: if the new value is lower than the previous stop, adopt it. If higher, keep the previous. The stop only ratchets down.
This ratcheting mechanism is what turns a simple volatility-based stop into a trailing stop. Without it, the stop would fluctuate up and down with ATR changes and could actually move away from price during a winning trade — defeating the entire purpose.
Step 5 — Signal detection
When price closes below the long trailing stop, the indicator flips to bearish mode and begins calculating a short trailing stop above price. When price closes above the short trailing stop, it flips back to bullish mode. This flip generates the visual color change you see on charts — typically green below price (bullish) and red above price (bearish).
Here is a worked example with real numbers:
| Bar | Close | High | ATR(14) | ATR × 3 | Highest Close (14) | Raw Stop | Previous Stop | Trailing Stop |
|---|---|---|---|---|---|---|---|---|
| 1 | 1.0920 | 1.0935 | 0.0042 | 0.0126 | 1.0920 | 1.0794 | — | 1.0794 |
| 2 | 1.0945 | 1.0960 | 0.0043 | 0.0129 | 1.0945 | 1.0816 | 1.0794 | 1.0816 |
| 3 | 1.0930 | 1.0950 | 0.0044 | 0.0132 | 1.0945 | 1.0813 | 1.0816 | 1.0816 |
| 4 | 1.0970 | 1.0985 | 0.0045 | 0.0135 | 1.0970 | 1.0835 | 1.0816 | 1.0835 |
Notice bar 3: the raw stop (1.0813) is lower than the previous trailing stop (1.0816), so the trailing stop stays at 1.0816. It never moves down during a long trade. On bar 4, the new calculation (1.0835) exceeds the previous stop, so it ratchets up. This is the mechanism that locks in profit during trends.
Platform differences to watch for
MetaTrader 5 custom indicators may implement the ATR Trailing Stop using different anchor prices (close vs. high), different ATR smoothing methods (SMA vs. Wilder), and different lookback periods for the highest close. TradingView's built-in version typically uses the standard Wilder smoothing. Before relying on any implementation, check which variant you are using — the differences can amount to 10-20 pips on a typical forex setup, which matters for tighter multiplier settings.

ATR trailing stops: smoother than fixed stops, cooler than market noise.
“The multiplier is the single most important setting in the ATR Trailing Stop, and getting it right for your trading style makes the difference between an indicator that works and one that frustrates you into abandoning it.”
3Setting the Multiplier: Tight (2x) vs Comfortable (3x) vs Loose (4x)
The multiplier is the single most important setting in the ATR Trailing Stop, and getting it right for your trading style makes the difference between an indicator that works and one that frustrates you into abandoning it. Here is what each range actually does in practice.
2x Multiplier — The Scalper's Choice
A 2x multiplier places the trailing stop two ATRs from the highest close. On EUR/USD H1 with an ATR of 15 pips, that is 30 pips. This is tight. During normal price fluctuations, a bar can easily move 1.5 to 2 ATRs in the adverse direction without meaning anything for the trend. A 2x setting will get you stopped out on these routine pullbacks.
Who should use it: Day traders and aggressive swing traders who want to capture short, impulsive moves and exit quickly when momentum fades. If your typical winning trade lasts 5-10 bars and you target 1:1 to 1.5:1 reward-to-risk, a 2x multiplier keeps you nimble.
The tradeoff: You will be stopped out of legitimate trends early. A pair can pull back two ATRs on a routine retracement, clip your stop, then continue trending for another 200 pips without you. Expect a higher number of small wins and small losses, with a few frustrating "would-have-been" winners.
3x Multiplier — The Sweet Spot
Three ATRs is the default for good reason. Statistically, price rarely moves three full ATRs against the prevailing trend during a normal pullback. Most routine retracements stay within 1.5 to 2.5 ATRs of the swing high. A 3x buffer survives these pullbacks and only gets hit when the trend is genuinely reversing or when a major news event causes a volatility spike — both scenarios where you probably want to be out anyway.
Who should use it: Swing traders holding for days to weeks on H4 and D1 charts. This is the setting that most systematic traders settle on after backtesting. It balances the need to stay in trends long enough to capture meaningful moves against the need to protect capital when the trend actually ends.
Real-world example: You go long GBP/USD at 1.2650 on an H4 chart. ATR(14) reads 55 pips. Your trailing stop starts at 1.2650 − (0.0055 × 3) = 1.2485. Over the next week, price climbs to 1.2850 and ATR expands to 62 pips. Your stop has ratcheted up to 1.2850 − (0.0062 × 3) = 1.2664. You have locked in 14 pips of profit without touching the trade. If GBP/USD then reverses hard on a surprise data release, you exit near breakeven instead of giving back the entire move.
4x Multiplier — The Trend Rider
Four ATRs provides a very wide cushion. On GBP/JPY D1 with an ATR of 130 pips, the stop sits 520 pips from the highest close. This is position trading territory — you are accepting large open drawdowns in exchange for the ability to ride major trends for weeks or months.
Who should use it: Position traders on D1 and W1 timeframes, particularly on volatile crosses like GBP/JPY, EUR/NZD, or gold. If your target is 500-1000+ pips and you can tolerate seeing 200-300 pips of unrealized profit vanish during pullbacks, a 4x multiplier keeps you in the trade.
The tradeoff: When the trend does end, you give back a substantial portion of profits before the stop is hit. A move from 180.00 to 185.00 on GBP/JPY followed by a reversal might not trigger your 4x stop until price has fallen back to 183.20. You captured 320 pips of a 500-pip move. With a 3x stop, you might have exited at 183.80 (380 pips captured). With 2x, around 184.20 (420 pips). But the 2x and 3x settings would have stopped you out during earlier pullbacks that the 4x survived.
Multiplier recommendations by instrument and timeframe:
| Instrument | H1 | H4 | D1 |
|---|---|---|---|
| EUR/USD | 2x | 2.5-3x | 3x |
| GBP/USD | 2x | 3x | 3x |
| GBP/JPY | 2.5x | 3x | 3.5-4x |
| USD/JPY | 2x | 3x | 3x |
| Gold (XAU/USD) | 2.5x | 3x | 3.5x |
| S&P 500 | 2x | 3x | 3x |
| Bitcoin | 2.5x | 3x | 4x |
The ADX adjustment trick
Here is a refinement that experienced traders use: adjust the multiplier based on trend strength. When the ADX (Average Directional Index) is above 25, indicating a strong trend, use your standard multiplier — the trend has momentum and pullbacks are likely shallow. When ADX is below 25, increase the multiplier by 0.5 to 1.0. In weak or choppy trends, price makes wider, more erratic swings, and a standard multiplier will get caught by these whipsaws. By widening the stop when trend strength is low, you reduce the chance of premature exits during consolidation phases.
This is not an automatic toggle — you set it at the start of the trade based on the current ADX reading and adjust only if market conditions change significantly during the trade's life.
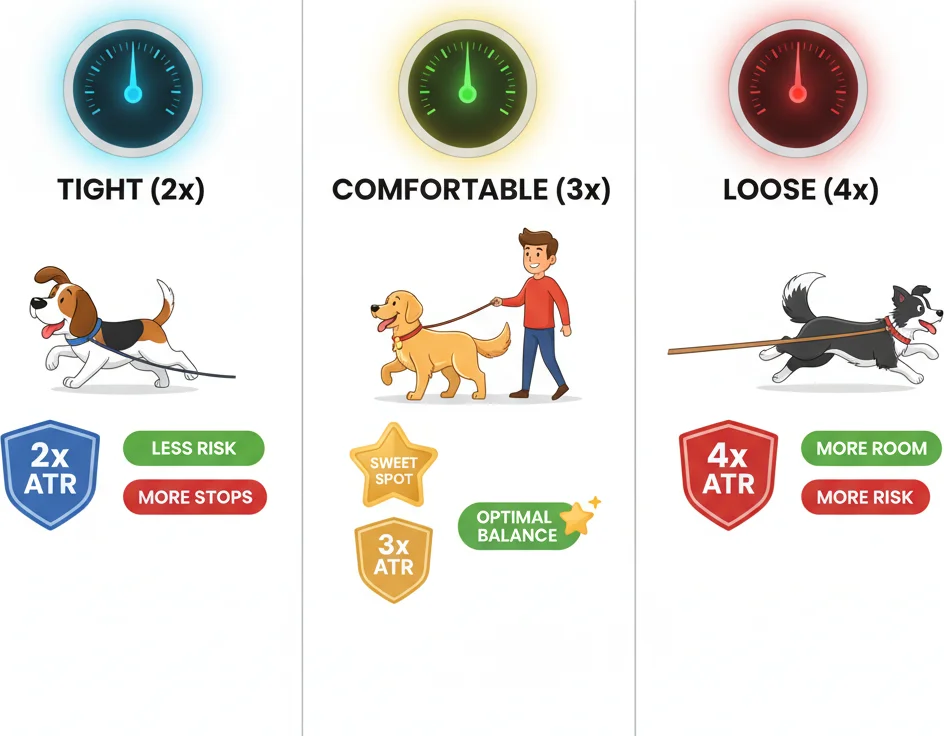
The multiplier is your comfort dial — 2x is a tight leash, 3x is the sweet spot, 4x gives trades room to breathe.
4ATR Trailing Stop in Action: A Complete Swing Trade Walkthrough
Theory is worthless without application, so let us walk through an entire swing trade from entry to exit using the ATR Trailing Stop as the exit management tool. This example uses realistic values and illustrates both the strengths and the frustrations of the indicator.
Setup: EUR/USD H4 — Bullish breakout above resistance
The date is hypothetical but the market conditions are typical. EUR/USD has been consolidating between 1.0820 and 1.0880 for six days. The 14-period ATR on H4 reads 38 pips, indicating moderate volatility. You have been watching for a breakout, and on Tuesday during the London session, a strong bullish candle closes at 1.0905 — above the 1.0880 resistance with conviction.
Entry decision
You enter long at 1.0905. Your entry signal came from the breakout and price action, not from the ATR Trailing Stop itself. The ATR-TS is your exit manager, not your entry signal. This distinction matters — trying to use ATR-TS color flips as entry signals in this consolidation environment would have produced at least two losing whipsaws in the prior six days.
Initial stop placement
ATR(14) = 38 pips. Multiplier = 3. Stop distance = 114 pips. Highest close in the lookback = 1.0905 (just occurred). Initial trailing stop = 1.0905 − 0.0114 = 1.0791.
This stop sits well below the consolidation range, which is exactly what you want. If the breakout fails and price falls back into the range, 1.0791 gives it room to retest the breakout level (1.0880) and even dip slightly below without stopping you out. Only a genuine failure — a close back inside the range followed by continued selling — would reach your stop.
Day 1-2: The trade develops
Price climbs to 1.0940, then pulls back to 1.0910 on Wednesday. The new highest close is 1.0940, and ATR has ticked up to 40 pips. New trailing stop = 1.0940 − 0.0120 = 1.0820. Previous stop was 1.0791, so the new value (1.0820) is higher — the stop ratchets up. You have now locked in a position where even a 90-pip adverse move from the high would still exit you above your entry.
Day 3-4: Trend acceleration
An unexpectedly dovish ECB speech sends EUR/USD surging. Price reaches 1.1030 on Thursday. ATR expands to 52 pips as the larger bars inflate the average. Trailing stop = 1.1030 − (0.0052 × 3) = 1.0874. The stop jumped from 1.0820 to 1.0874 — you have now locked in a meaningful profit regardless of what happens next.
Day 5: The pullback that tests your nerve
Friday brings profit-taking. EUR/USD drops from 1.1030 to 1.0950 — an 80-pip decline. If you were using a fixed 50-pip trailing stop, you would be out at 1.0980 with a 75-pip gain. Instead, your ATR Trailing Stop sits at 1.0874, well below the pullback low. You stay in the trade. This is the moment that defines the ATR Trailing Stop: it survived a pullback that was 1.54 ATRs deep, which is completely normal in a healthy trend.
Day 6-8: The trend resumes
Monday opens with renewed buying. Price climbs to 1.1080, 1.1120, and eventually 1.1150. ATR stabilizes around 48 pips. Your trailing stop ratchets up through 1.0920, 1.0955, and reaches 1.1150 − 0.0144 = 1.1006.
Day 9: The exit
A stronger-than-expected US jobs report reverses sentiment. EUR/USD drops sharply from 1.1150, blowing through 1.1100 and 1.1050 within hours. Your trailing stop at 1.1006 is hit. You exit at approximately 1.1006.
Trade summary:
| Element | Value |
|---|---|
| Entry | 1.0905 |
| Exit | 1.1006 |
| Profit | 101 pips |
| Maximum favorable excursion | 245 pips (to 1.1150) |
| Profit captured | 41% of the move |
| Trade duration | 9 days |
The honest assessment
You captured 101 pips of a 245-pip move — about 41%. That might feel disappointing. You watched price climb to 1.1150 and then gave back 144 pips before the stop triggered. This is the fundamental tradeoff of any trailing stop: you will never exit at the top. The wider your multiplier, the more profit you return at the end, but the more likely you are to survive mid-trade pullbacks that would have stopped a tighter setting.
With a 2x multiplier, the stop would have been tighter throughout. You likely would have been stopped out during the Friday pullback around 1.0950 with a 45-pip gain, missing the entire second leg of the move. With a 4x multiplier, you would still be in the trade during that final selloff, and might exit at 1.0958 if the drop continued — capturing 53 pips of the top but risking a scenario where the reversal becomes a full trend change.
The 3x setting threaded the needle: survived the mid-trade pullback, captured the second leg, and exited with a meaningful profit when the trend actually ended. No setting is perfect, but 3x provides a consistent middle ground across hundreds of trades.
One final practical detail: During the trade, the ATR-TS line on your chart was green and rising beneath price. The moment price closed below it on Day 9, the line flipped red and appeared above price. That visual flip is the exit signal — clean, unambiguous, and completely mechanical. No interpretation needed, no second-guessing. The indicator said the trend is over, you exited, and you moved on to the next setup.

When your ATR trailing stop catches the exact reversal point.
“All three of these indicators are built on the same foundation — ATR-based volatility — but they differ in construction, behavior, and what they do best.”
5ATR Trailing Stop vs Chandelier Exit vs Supertrend: Which One to Pick?
All three of these indicators are built on the same foundation — ATR-based volatility — but they differ in construction, behavior, and what they do best. If you have been confused about which one to put on your chart, this comparison should clarify things permanently.
ATR Trailing Stop — The General-Purpose Exit Manager
The ATR Trailing Stop anchors to the highest close (or highest high, depending on implementation) and subtracts ATR × multiplier. Its defining feature is the ratcheting mechanism: the stop only moves in your direction, locking in profits as the trend progresses. Default settings are typically 14 periods and a 3x multiplier.
Strength: Provides the smoothest trailing stop behavior. Because it anchors to recent closes rather than extreme highs, it is less sensitive to intrabar spikes. A single volatile bar with a long wick does not dramatically shift the stop level. This makes it more predictable and easier to plan position sizing around.
Weakness: The reliance on closes means it reacts slightly slower than the Chandelier Exit to parabolic moves. If price is making new highs on every bar, the ATR-TS catches up steadily but is always one step behind the Chandelier.
Chandelier Exit — The Trend-Optimized Trailing Stop
Developed by Charles Le Beau and popularized by Alexander Elder, the Chandelier Exit uses a longer lookback period (22 bars by default) and anchors to the highest high (for longs) or lowest low (for shorts) within that window. The formula is:
- Long: Highest High (22 periods) − ATR(22) × 3
- Short: Lowest Low (22 periods) + ATR(22) × 3
The key difference from the ATR-TS is the anchor point. By using the absolute highest high over 22 bars rather than the highest close, the Chandelier Exit creates a wider buffer during strong trends. If a pair made a spike high three days ago on a news event, that spike anchors the Chandelier stop for up to 22 bars, keeping the stop level stable even as normal-range bars follow.
Strength: Excels in strong, clean trends where you want to give the trade maximum room. The longer lookback means the stop adjusts slowly, which is an advantage when a trend is reliable and you want to avoid being shaken out by normal retracements.
Weakness: The 22-bar lookback makes it sluggish in faster-moving markets. On H1, 22 bars represents almost a full day of trading — the stop level may reflect yesterday's conditions rather than current reality. Also, anchoring to the highest high means an outlier spike sets the stop too wide for subsequent normal-volatility bars.
Supertrend — The Trend Direction Indicator (That Also Trails)
Supertrend uses a fundamentally different calculation. Instead of anchoring to price extremes, it centers on the median price (High + Low) / 2 and adds or subtracts ATR × multiplier. Default settings are 10 periods and a 3x multiplier.
- Upper band: Median + ATR(10) × 3
- Lower band: Median − ATR(10) × 3
When price is above the lower band, Supertrend shows bullish (typically green). When price drops below, it flips bearish (red). The bands also ratchet — they only move in the favorable direction.
Strength: Supertrend is the best of the three for identifying trend direction at a glance. The color-coded flip is visually clean and the median-price anchor makes it responsive to trend changes. Many traders use it as a trend filter — only taking long trades when Supertrend is green and short trades when it is red.
Weakness: Because it uses median price instead of closes or highs, and because the default period is shorter (10 vs. 14 or 22), Supertrend flips more often in choppy markets. In a range-bound EUR/USD session, Supertrend might flip three or four times in two days while the ATR-TS and Chandelier remain stable. This makes it unreliable as a standalone exit tool in non-trending conditions.
Head-to-head comparison table:
| Feature | ATR Trailing Stop | Chandelier Exit | Supertrend |
|---|---|---|---|
| Anchor price | Highest close | Highest high / lowest low | Median price |
| Default period | 14 | 22 | 10 |
| Default multiplier | 3x | 3x | 3x |
| Primary use | Exit management | Trailing stop in trends | Trend identification |
| Whipsaw frequency | Low | Low | Moderate to high |
| Reaction speed | Medium | Slow | Fast |
| Best timeframe | H4, D1 | D1, W1 | H1, H4 |
| Best market condition | Trending and ranging | Strong trends only | Clean trends |
| Stop tightness | Medium | Widest | Tightest |
Which one should you use?
If you need one indicator for exit management across different market conditions, use the ATR Trailing Stop with a 3x multiplier. It is the most balanced option that works reasonably well everywhere without excelling or failing dramatically in any specific condition.
If you are a position trader riding D1 or W1 trends on major pairs and your priority is staying in the trade as long as possible, use the Chandelier Exit. Its wider buffer and longer lookback suit the patience required for multi-week holds.
If you want a visual trend filter to determine trade direction — not to manage exits — use Supertrend. Combine it with a separate exit tool (like the ATR-TS) for the best of both worlds: Supertrend tells you which direction to trade, and the ATR Trailing Stop tells you when the trade is over.
The combination approach is what many systematic traders settle on after testing all three independently. Use Supertrend (10, 3) to confirm the trend direction, enter on a pullback to a key level, and manage the exit with an ATR Trailing Stop (14, 3). This way you are not asking any single indicator to do everything — each tool handles the job it was designed for.
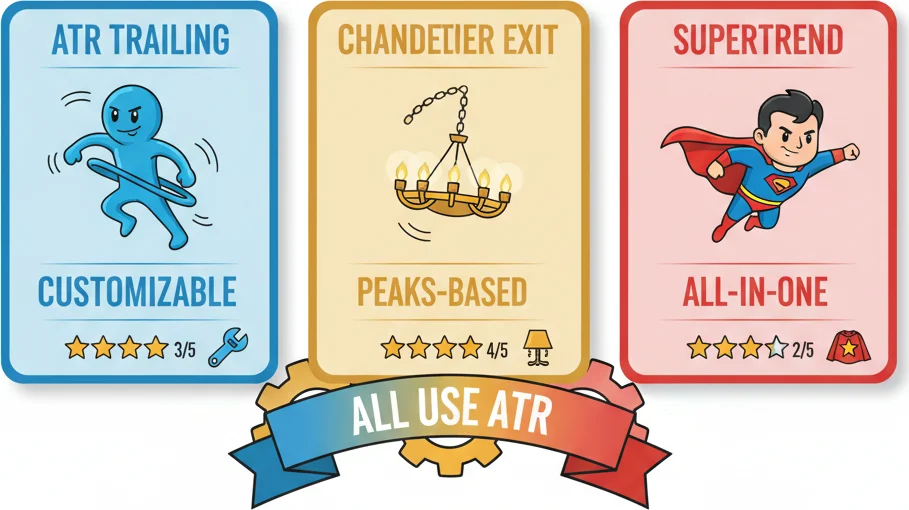
Three trailing stops walk into a chart — they all use ATR, but each one has its own personality.
Frequently Asked Questions
Q1What is the ATR Trailing Stop and how does it work?
The ATR Trailing Stop is a volatility-based exit indicator that places a dynamic stop-loss at a fixed multiple of the Average True Range below (for longs) or above (for shorts) the recent highest close. The default settings use a 14-period ATR and a 3x multiplier. The stop only moves in the direction of your trade — it ratchets up during uptrends and down during downtrends, never reversing. When price closes beyond the stop level, the indicator signals a trend change. This makes it an adaptive exit tool that automatically widens in volatile markets and tightens in calm ones.
Q2What is the best ATR multiplier for forex trading?
A 3x multiplier is the standard starting point for swing trading on H4 and D1 charts, and it works well for most major forex pairs. Day traders on H1 often reduce to 2x or 2.5x for faster exits. Position traders on D1 or W1 may increase to 3.5x or 4x to survive deeper pullbacks in volatile pairs like GBP/JPY. The right choice depends on your trading style: tighter multipliers capture more of each move but get stopped out by normal retracements, while wider multipliers survive pullbacks but return more profit when the trend finally ends.
Q3Can I use the ATR Trailing Stop as an entry signal?
You can, but it is not the indicator's strength. The color flip — when the stop moves from above price to below (or vice versa) — generates a directional signal that works in trending markets. However, in ranging or choppy conditions, these flips produce frequent whipsaws. Most experienced traders use the ATR Trailing Stop exclusively for exit management and rely on other tools like price action breakouts, support and resistance, or trend-following indicators for entry decisions.
Q4What is the difference between the ATR Trailing Stop and the Chandelier Exit?
Both use ATR and a multiplier to set trailing stops, but they differ in anchor point and lookback period. The ATR Trailing Stop typically anchors to the highest close over 14 periods, while the Chandelier Exit anchors to the highest high over 22 periods. This makes the Chandelier Exit wider and slower to react, which suits position trading in strong trends. The ATR Trailing Stop is more responsive and works across a broader range of market conditions, making it the better general-purpose choice for swing traders on H4 and D1.
Q5Does the ATR Trailing Stop work on stocks, crypto, and commodities?
Yes. The indicator adapts automatically to any market because it is based on volatility rather than fixed price distances. On stocks, the ATR accounts for opening gaps that occur daily, making the stop more accurate than fixed-dollar stops. On crypto, where volatility can be extreme, the ATR Trailing Stop naturally widens to accommodate large daily swings without getting stopped out by noise. On commodities like gold or oil, it handles both trending and range-bound periods effectively. The only adjustment needed across markets is the multiplier — more volatile instruments may benefit from a slightly higher multiplier of 3.5x to 4x.
Top Brokers
About the Author
Daniel Harrington
Senior Trading Analyst
Daniel Harrington is a Senior Trading Analyst with a MScF (Master of Science in Finance) specializing in quantitative asset and risk management. With over 12 years of experience in forex and derivatives markets, he covers MT5 platform optimization, algorithmic trading strategies, and practical insights for retail traders.
Use This Indicator
Risk Disclaimer
Trading financial instruments carries significant risk and may not be suitable for all investors. Past performance does not guarantee future results. This content is for educational purposes only and should not be considered investment advice. Always conduct your own research before trading.