Bears Power Indicator: Measuring Selling Pressure with Alexander Elder
Bears Power measures the ability of sellers to push prices below an EMA, with negative values indicating bearish pressure strength.

Daniel Harrington
Senior Trading Analyst · MT5 Specialist
☕ 15 min read
Settings — Bears
| Category | oscillator |
| Default Period | 13 |
| Best Timeframes | H1, H4, D1 |
Every bar on your chart hides a secret in its low price. That bottom wick? It marks the exact point where sellers ran out of ammunition during that session — the deepest they managed to push before buyers stepped back in. Dr. Alexander Elder, a psychiatrist who traded his therapy couch for trading screens, captured this insight in one elegant formula back in 1989 in his book Trading for a Living. Bears Power simply subtracts a 13-period EMA from the bar's low. That is it. One subtraction that tells you how much muscle sellers are flexing relative to the market's idea of fair value. You will find it tucked inside MetaTrader 5's Oscillators folder, quietly measuring selling force while everyone argues about RSI and MACD. But traders who actually understand what Bears Power reveals — and combine it with its twin, Bulls Power — unlock Elder's full X-ray vision into market dynamics.
Key Takeaways
- Alexander Elder was not your average Wall Street quant. He was a psychiatrist who emigrated from the Soviet Union, pract...
- Bears Power interpretation boils down to three signal types. Each has a different reliability profile, and knowing which...
- Using Bears Power in isolation is like reading a courtroom transcript that only records what the defense attorney said. ...
1Dr. Alexander Elder's Force Model: Bears Push Price Below the EMA
Alexander Elder was not your average Wall Street quant. He was a psychiatrist who emigrated from the Soviet Union, practiced in New York, and then became fascinated by the crowd psychology visible in price charts. His background shaped an unconventional approach to indicator design. Instead of chasing mathematical elegance, he wanted tools that measured something psychologically real: the actual force buyers and sellers exert during each trading session.
His starting point for Bears Power was a specific premise about what a 13-period exponential moving average represents. Elder saw the EMA not as a technical line on a chart but as a living consensus — the price level where buyers and sellers had collectively agreed an asset was worth over the preceding two and a half weeks (on a daily chart). Any session that pushed beyond this consensus revealed a power shift.
The formula requires no spreadsheet wizardry:
Bears Power = Low - EMA(Close, 13)
When sellers drive the session low beneath the EMA, the result is negative. The deeper the negative reading, the further bears managed to drag price below the consensus. When the low stays above the EMA — meaning sellers could not even reach the average — the value flips positive, signaling that bears essentially lost control of the bar.
Why the low specifically? Elder chose it because the low captures the most extreme point of selling pressure within each period. The close can recover. The open is just where things started. But the low records the actual battlefield depth that sellers reached. It is like measuring how deep a submarine dove rather than the depth at which it eventually stabilized.
The 13-period EMA was a deliberate choice, not arbitrary. Thirteen sessions on a daily chart approximate half a trading month — long enough to represent a meaningful value consensus without oversmoothing fresh price action. And because it is exponential rather than simple, recent closes carry more weight. The EMA reacts faster to genuine shifts in the market's center of gravity while still filtering single-bar noise.
One thing that catches traders off guard when they first apply Bears Power: there are no fixed boundaries. Unlike RSI's neat 0-to-100 scale, Bears Power output depends on the instrument's absolute price and volatility. On EUR/USD daily charts, you might see values oscillating between -0.0080 and +0.0025. On gold, the same indicator could read -4.50 to +2.00. On a stock trading at 350 dollars, values might swing between -8.00 and +3.00. This means you cannot transplant threshold levels from one instrument to another — you must read Bears Power relative to its own recent history on that specific chart.
Elder never intended Bears Power to fly solo. He designed it as one wing of the Elder Ray Index, meant to be read alongside Bulls Power (High minus EMA) and the slope of the 13-period EMA itself. Treating Bears Power in isolation is like reading only the defense stats and ignoring the offense entirely. That said, the indicator does carry standalone value for one particular purpose: spotting fading selling pressure through divergence patterns. That application alone has made Bears Power a staple in the toolkit of experienced forex traders who specialize in trend exhaustion setups.
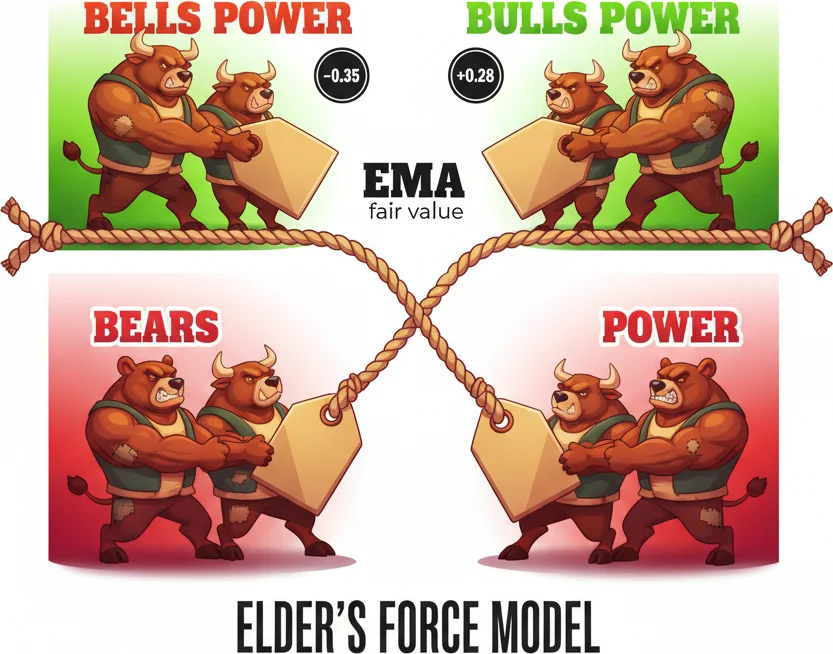
In Elder is model, the EMA is fair value — bears win when they drag price below it, bulls win when they push above.
2Reading Bears Power: Negative Values, Zero Crossings, and Divergence
Bears Power interpretation boils down to three signal types. Each has a different reliability profile, and knowing which one to trust (and which to mostly ignore) separates traders who use the indicator effectively from those who just stare at a histogram.
Negative and declining values: the trend confirmation signal. When Bears Power prints below zero and keeps pushing deeper with each bar, sellers are consistently shoving session lows further beneath the EMA. This is the normal, healthy state of a downtrend. Overlay Bears Power on any textbook downtrend — the USD rally of late 2022 on EUR/USD is a clean example — and you will see the histogram camped below zero, occasionally pulling toward the zero line but never crossing it. As long as the 13-period EMA slopes down and Bears Power stays negative, the bears are in charge. Not exciting analysis, but profitable to understand.
Zero-line crossovers: handle with caution. When Bears Power crosses from negative territory into positive, the session low has moved above the EMA. Sellers could not push price below the consensus — theoretically bullish. In practice, these crossovers are the noisiest signal Bears Power produces. On H1 charts especially, normal price wobble routinely pushes the low above a flat or gently moving EMA without any genuine shift in market control. A standalone zero-line cross in a range-bound market is almost meaningless. These crosses gain value only as confirmation — when your trend indicator already signals bullish momentum building and then Bears Power flips positive, that convergence strengthens the case. Used alone, expect a lot of head fakes.
Divergence: where Bears Power earns its reputation. Bullish divergence occurs when price prints a lower low but Bears Power records a higher low. Sellers managed to push price to a new extreme, but the force they applied — measured by the gap between the low and the EMA — was weaker than their previous attempt. That discrepancy signals exhaustion. Elder himself identified bullish divergence as the highest-probability signal in the Bears Power arsenal.
Consider what happened with GBP/USD in September 2022. The pair dropped to 1.0350, a multi-decade low, with Bears Power at -0.0120 on the daily chart. Over the following week, price nudged lower to 1.0327, but Bears Power only reached -0.0065 — sellers pushed to a new price low with roughly half the force. That bullish divergence preceded a rally of over 1,000 pips across the next two months.
Bearish divergence — price making higher highs while Bears Power prints lower highs — does exist but is less common and less reliable on this specific indicator. Because Bears Power measures downside force, its bearish divergence signals carry less weight than those found on Bulls Power, which directly tracks upside force. If you want bearish divergence signals, look at Bulls Power or RSI.
A common trap: confusing a rising Bears Power reading with a buy signal when the value is still deeply negative. Going from -0.0100 to -0.0065 means selling pressure is easing, sure. But bears still firmly control the session lows. That improvement becomes actionable only when it forms part of a divergence pattern or when it approaches the zero line in conjunction with a flattening EMA. Otherwise, you are reading a minor wobble in a bear-dominated market and calling it a reversal — a recipe for losses.
The practical takeaway: use negative-and-declining readings for trend confirmation, use divergence for timing counter-trend entries, and treat zero-line crosses with healthy skepticism unless backed by additional evidence from trend indicators or the Bulls Power sibling.

When Bears Power diverges from price action, the bears are planning their revenge.
“Using Bears Power in isolation is like reading a courtroom transcript that only records what the defense attorney said.”
3The Elder Ray Strategy: Bears Power + Bulls Power Combined
Using Bears Power in isolation is like reading a courtroom transcript that only records what the defense attorney said. You hear one side of the argument and miss half the story. Dr. Elder designed Bears Power and Bulls Power as two halves of a single diagnostic system he named the Elder Ray Index — a nod to medical X-rays because it reveals forces beneath the price surface that candlestick patterns alone cannot detect.
The complete Elder Ray system runs on three components:
- The 13-period EMA direction establishes the dominant trend. Rising EMA means bullish bias. Declining EMA means bearish bias. Flat EMA means stay out or tighten your filters.
- Bulls Power (High - EMA) quantifies how far above the consensus buyers managed to push price during the session.
- Bears Power (Low - EMA) quantifies how far below the consensus sellers managed to push price.
Together, these three readings create a complete picture of who is winning, who is losing, and — critically — who is losing their grip.
The classic buy setup follows Elder's specific conditions: The 13-period EMA must be rising, confirming that the broader trend favors buyers. Bears Power must be negative — this means sellers are still active, so you are not buying into a euphoric blow-off top where selling pressure has already vanished. And Bears Power must be increasing toward zero, indicating that while sellers are present, they are weakening. An optional but powerful fourth filter: bullish divergence between Bears Power and price. When all four conditions align, Elder considered this among the strongest long setups in his methodology.
The short setup mirrors this logic precisely. The EMA must be falling. Bulls Power must be positive — buyers are still fighting, so you are not shorting into a panic low where buying pressure has already evaporated. And Bulls Power must be decreasing toward zero, showing that buyers are losing strength. Optional fourth filter: bearish divergence between Bulls Power and price.
Why does the combined system outperform either component alone? During a sustained downtrend, Bears Power spends weeks or months below zero. That persistent negative reading tells you the trend is down — information a simple moving average already provides. The actionable timing comes from watching Bulls Power. Each time Bulls Power rallies into positive territory during a counter-trend bounce and then rolls back over while the EMA keeps declining, a fresh short entry window opens. The interplay between the two indicators creates precise timing within the broader trend direction.
Elder's critical rules (often ignored by traders who skim his books): Do not go long when Bears Power is positive. A positive Bears Power means the bar's low sits above the EMA — selling pressure has vanished. That sounds bullish, but Elder observed that it frequently indicates an overextended rally ripe for a pullback. Similarly, never go short when Bulls Power is negative. Negative Bulls Power means the bar's high could not even reach the EMA — buyers have capitulated. Shorting there risks entering just as the final sellers exhaust themselves.
Elder integrated this system into his famous Triple Screen approach, adding a timeframe hierarchy. The weekly chart identifies the tide — the major trend direction. The daily chart applies Elder Ray to find the wave — the entry zone within that trend. And a shorter timeframe like H4 provides the ripple — the precise trigger for execution. A daily Elder Ray buy signal that aligns with a weekly uptrend and an H4 breakout trigger produces a triple-confirmed setup that Elder recommended trading with above-average position size.
In MetaTrader 5, there is no single built-in Elder Ray indicator combining both components. You need to add Bears Power and Bulls Power separately from the Navigator panel (Insert, Indicators, Oscillators). Both appear as independent histograms below the chart. Adding a plain 13-period EMA to the price chart completes the visual setup. Some traders color-code the EMA — green when rising, red when falling — for instant trend-direction reading.

Bears Power alone shows half the battle. Add Bulls Power and you get the full X-ray of market forces.
4Using Bears Power to Time Short Entries in Downtrends
Bears Power finds its sweet spot in one particular scenario: timing short entries after you have already confirmed that the broader trend points down. Plenty of indicators can flag a downtrend. Bears Power answers the more specific and more profitable question: do sellers still have the energy to push price lower from here, or have they exhausted themselves?
The workflow starts on a higher timeframe. Your D1 chart shows a declining 50-period EMA, or the weekly chart slopes lower — the big picture is bearish. Now drop to H4 or D1 to time entries. You are watching Bears Power for one of two setups.
Setup 1: The Pullback Fade. Price stages a counter-trend bounce toward the declining EMA. Bears Power rises from deeply negative toward zero — possibly even crossing briefly into positive territory as sellers take a break. You wait. You are not interested in the bounce itself. The signal comes when Bears Power turns back down, printing a value lower than its most recent peak. Sellers are re-engaging after the pause. If the EMA still slopes downward, enter short. Place your stop above the swing high created during the bounce. Target the prior swing low or use a measured-move projection equal to the distance of the previous down-leg.
This pattern appeared repeatedly on EUR/USD H4 during September through November 2022. The pair was in a sustained downtrend, and each counter-trend bounce pushed Bears Power toward zero before sellers reloaded. Traders who shorted when Bears Power turned back negative after each bounce captured swings of 100 to 200 pips per leg.
Setup 2: The Failed Divergence Continuation. This one requires more discretion. Price makes a lower low, but Bears Power prints a higher low — classic bullish divergence. Normally, that is a reversal signal. But context matters enormously. When the EMA remains firmly downward-sloping and Bulls Power simultaneously shows lower highs, the divergence may simply indicate a temporary slowing in selling velocity rather than a genuine turn. Wait for the shallow bounce triggered by the divergence to play out, then watch Bears Power. When it resumes declining, the next leg down often carries sharp momentum because counter-trend traders who bought the divergence are now trapped. Their stops fuel the selloff.
This nuance is what separates discretionary from mechanical application of Bears Power. The same pattern — bullish divergence — signals reversal in one context and continuation in another. The EMA slope and Bulls Power behavior provide the context you need.
Stop placement and targets. For short entries timed via Bears Power, place protective stops above the most recent swing high formed during the pullback. An alternative is ATR-based: entry price plus 1.5 times the 14-period Average True Range gives the trade breathing room without excessive risk. For profit targets, the most conservative option is the previous swing low. A more aggressive approach projects the measured distance of the prior downswing from your entry level.
Timeframe considerations. H1 generates frequent Bears Power signals, but many are noise — expect roughly 40 to 50 percent of short entries to fail without additional confirmation. H4 reduces signal frequency but boosts hit rates to approximately 55 to 65 percent when entries align with the higher-timeframe trend. D1 produces the fewest signals — two to four per month on a single pair — but those carry the most weight because institutional flows have had time to register in the data.
The number one mistake traders make with Bears Power short entries: selling simply because the reading is negative. A negative value just means the low is below the EMA — that describes virtually every bar in any downtrend. The edge is in the change. Is Bears Power becoming more negative (sellers gaining momentum)? Less negative (sellers weakening)? Diverging from price (sellers losing conviction)? The direction of the reading matters far more than its absolute level. Get that distinction right and Bears Power becomes a genuinely useful timing tool rather than just another histogram to stare at.

Watching Bears Power like a hawk to catch that perfect short entry timing.
“MetaTrader 5 offers dozens of oscillators.”
5Bears Power vs Other Oscillators: When Simplicity Wins
MetaTrader 5 offers dozens of oscillators. So why bother with Bears Power when you already have RSI, MACD, or Stochastics on your chart? The honest answer: Bears Power is not better in every scenario. But it measures something the popular alternatives cannot, and that unique perspective earns it a permanent spot in certain trading workflows.
What makes Bears Power different from everything else. It measures a concrete physical reality: how far sellers pushed the session low beneath the EMA consensus. RSI calculates the ratio of average gains to average losses over recent closes. MACD tracks the gap between two closing-price moving averages. Stochastics map where the close sits within the recent high-low range. None of these directly capture selling force. Bears Power plugs that analytical hole by focusing specifically on session lows — the footprints sellers leave behind.
Bears Power versus RSI. RSI operates on a convenient 0-to-100 scale, making it trivially easy to define overbought (above 70) and oversold (below 30) zones that work across any instrument without adjustment. Bears Power offers no such luxury — its output is instrument-specific, and what counts as an extreme reading on EUR/USD is meaningless on gold. RSI wins handily in range-bound markets where overbought and oversold zones produce reliable mean-reversion entries. But during strong trends, RSI can park in overbought territory for weeks, generating premature reversal signals that bleed accounts dry. Bears Power staying deeply negative during a downtrend simply confirms trend health — no false alarms, no crying wolf. For trend confirmation and fade-timing in trending markets, Bears Power has the edge.
Bears Power versus MACD. MACD's signal-line crossovers and histogram are built entirely from closing prices. Bears Power incorporates the low, giving it access to information MACD ignores. Picture a scenario where closing prices hold steady, but session lows are creeping progressively deeper each day — growing intraday selling pressure that has not yet shown up in closing data. Bears Power catches this developing weakness while MACD sits flat. On the flip side, MACD's histogram reveals broader momentum information about the overall trend that Bears Power, laser-focused on downside extremes, simply cannot provide. They are better as complements than replacements.
Bears Power versus Stochastic Oscillator. These two actually pair well together. Stochastics tells you where the close landed relative to the full range of recent prices. Bears Power tells you how aggressively sellers attacked the bottom of each bar. A Stochastic reading below 20 (oversold) combined with Bears Power printing a higher low (bullish divergence) while the 13-period EMA slopes upward creates a triple-filtered entry signal that significantly outperforms any single condition in isolation.
The underrated advantage of simplicity. Bears Power has exactly one adjustable parameter: the EMA period. One knob. One output. No signal lines, no secondary smoothing, no weights to tweak. This matters more than most traders realize. Indicators with three or four parameters invite curve-fitting — you can always find settings that looked amazing over the past year but fail miserably going forward. With Bears Power, optimization has nowhere to hide. What you see on the chart is genuinely what you get, and that transparency has real value in keeping you honest about your edge.
Where Bears Power falls short. It performs poorly as a standalone signal generator in ranging markets. Without a trending EMA to give its readings directional meaning, the histogram flip-flops between mildly positive and mildly negative without generating anything actionable. It also ignores volume — something Elder's other creation, the Force Index, was designed to address. And because it reads only session lows, it says nothing about buying pressure. You need Bulls Power for that side of the equation.
The practical verdict. Use Bears Power when you want a clean, one-parameter gauge of whether sellers are strengthening or fading — especially within a confirmed downtrend where you are timing entries rather than discovering the trend. For general-purpose oscillator work in trends and ranges alike, RSI or Stochastics will serve you better. For the full Elder diagnostic, combine Bears Power with Bulls Power and the 13-period EMA to build the complete Elder Ray system. Bears Power is a specialist, and like most specialists, it dominates in its niche while being unremarkable outside of it.
Some oscillators need a PhD to interpret. Bears Power just asks: are bears winning or losing? Done.
Frequently Asked Questions
Q1What is the Bears Power indicator formula and how is it calculated?
Bears Power equals the current bar's Low minus the 13-period Exponential Moving Average of closing prices. If the low is 1.0850 and the 13-period EMA sits at 1.0880, Bears Power reads -0.0030. Negative values mean sellers pushed the low below the consensus price; positive values mean sellers failed to reach below the EMA at all. In MetaTrader 5, the calculation runs automatically — add it from Insert, Indicators, Oscillators, Bears Power.
Q2What is the best Bears Power period setting for day trading?
The default 13-period EMA works well on H4 charts, where it covers roughly 2.5 trading days. For H1 day trading, consider increasing the period to 20 or 21 — the default 13 covers only half a trading session on H1, generating frequent but noisy signals. A 20-period setting extends the consensus baseline to a full session's worth of data. On D1 charts, stick with 13 as Elder originally designed it.
Q3Should I use Bears Power alone or combine it with other indicators?
Alexander Elder designed Bears Power as one half of his Elder Ray system, not as a standalone tool. The most effective setup combines Bears Power with Bulls Power and a 13-period EMA overlaid on the price chart. The EMA direction establishes the trend, Bulls Power measures buying force, and Bears Power measures selling force. Running Bears Power alone gives you only the sellers' story — you are missing what buyers are doing entirely.
Q4How do I spot a bullish divergence on Bears Power?
Bullish divergence appears when price makes a lower low but Bears Power records a higher low — sellers pushed price further down but with less force than their previous attempt. This signals exhaustion. For the most reliable divergence signals, use H4 or D1 timeframes and confirm the 13-period EMA is flattening or starting to turn upward. On H1, divergences produce more false positives because normal intraday noise creates misleading patterns.
Q5Why is my Bears Power reading positive and what does that mean?
A positive Bears Power means the session low stayed above the 13-period EMA — sellers could not push price below the consensus value. While that sounds bullish, Elder actually cautioned against buying when Bears Power is positive because it often marks an overextended rally. The highest-probability buy signals come when Bears Power is negative but rising toward zero — sellers are still present but losing their grip. A positive reading during a declining EMA can also just be a temporary bounce in a larger downtrend.
Top Brokers
About the Author
Daniel Harrington
Senior Trading Analyst
Daniel Harrington is a Senior Trading Analyst with a MScF (Master of Science in Finance) specializing in quantitative asset and risk management. With over 12 years of experience in forex and derivatives markets, he covers MT5 platform optimization, algorithmic trading strategies, and practical insights for retail traders.
Use This Indicator
Risk Disclaimer
Trading financial instruments carries significant risk and may not be suitable for all investors. Past performance does not guarantee future results. This content is for educational purposes only and should not be considered investment advice. Always conduct your own research before trading.