Bollinger Bandwidth (BBW): Quantifying the Bollinger Band Squeeze
Bollinger Bandwidth measures the percentage difference between upper and lower Bollinger Bands, quantifying volatility to identify squeeze setups and expansion phases.

Daniel Harrington
Senior Trading Analyst · MT5 Specialist
☕ 18 min read
Settings — BBW
| Category | volatility |
| Default Period | 20 |
| Best Timeframes | H1, H4, D1 |
Bollinger Bands are one of the most popular indicators on the planet, yet most traders only use them for the bands themselves — watching price bounce between upper and lower rails like a pinball. What many miss is the companion tool that John Bollinger specifically built to answer a deceptively simple question: how wide are the bands right now compared to where they've been? That tool is Bollinger Bandwidth (BBW), and it turns the visual width of the bands into a single plotted line you can actually measure, compare, and build rules around. When the bands squeeze tight, BBW drops to historical lows and essentially whispers "something big is about to happen." When volatility explodes and the bands blow apart, BBW spikes and tells you the fireworks have started. It doesn't predict direction — that's not its job. Its job is telling you when the market is coiled like a spring, so you can position yourself before the release.
Key Takeaways
- John Bollinger introduced Bollinger Bands in the early 1980s, and they became a staple of technical analysis almost imme...
- The Bollinger Bandwidth formula is refreshingly simple for an indicator that carries so much analytical weight: BBW = (...
- The Squeeze is the single most important concept in Bollinger Bandwidth analysis. John Bollinger himself identified it a...
1John Bollinger's Second Tool: Why He Created Bandwidth
John Bollinger introduced Bollinger Bands in the early 1980s, and they became a staple of technical analysis almost immediately. Two standard deviations above and below a 20-period moving average gave traders a dynamic envelope that expanded with volatility and contracted when markets went quiet. It was elegant, visual, and useful. But there was a problem.
Looking at a chart, you could see the bands were "narrow" or "wide" — but how narrow? Narrower than last month? Narrower than six months ago? The human eye is terrible at comparing band widths across different time periods, especially when the price scale has shifted. Scroll back three months on EUR/USD and try to eyeball whether today's band width is tighter than that consolidation in January. Good luck.
That's exactly why Bollinger created BandWidth. In his own words, he built it to depict "how wide the bands were as a function of the middle band." By normalizing the distance between the upper and lower bands relative to the middle band, he gave traders an objective number they could track over time, set alerts on, and build systematic rules around.
BandWidth first appeared in Bollinger's book Bollinger on Bollinger Bands, alongside its sibling indicator %b (which tracks where price sits within the bands). Together, these two derivatives transformed Bollinger Bands from a visual overlay into a complete analytical framework. The bands show you the envelope. %b tells you where price is inside it. BandWidth tells you how tight or loose the envelope is.
The historical context matters because it explains what BBW is designed to do — and what it isn't. It's not a directional indicator. It doesn't tell you whether price will break up or down. It measures one thing: the relative width of the Bollinger Bands as a percentage of the middle band. That single measurement unlocks a powerful concept Bollinger identified early on: volatility is cyclical. Periods of low volatility are followed by high volatility, and vice versa. Markets don't stay quiet forever, and they don't stay explosive forever either. BBW gives you the gauge to see exactly where you are in that cycle.
This cyclical nature is the foundation of everything traders do with BBW. When the indicator drops to levels it hasn't seen in months, the market is coiled. When it spikes to extremes, the expansion phase is underway — and eventually it will contract again. You don't need to predict direction to profit from this insight. You just need to know when the spring is compressed, and let other tools handle the directional call.
On most charting platforms — TradingView, MetaTrader 5, NinjaTrader — BBW appears as a separate indicator plotted below the price chart, usually as a single line. Some platforms include it natively under the Bollinger Bands settings; others require you to add it as a standalone indicator. The default parameters mirror the standard Bollinger Bands: 20-period SMA with 2 standard deviations. Unless you've customized your Bollinger Bands, leave BBW at the same settings to keep them synchronized.
| Parameter | Default | Purpose |
|---|---|---|
| Period | 20 | SMA lookback for middle band |
| Std Deviations | 2 | Band distance multiplier |
| Source | Close | Price input for calculation |
One thing to note: BBW values are not comparable across different instruments. A BBW reading of 0.05 on EUR/USD and 0.05 on Bitcoin mean very different things relative to each asset's typical volatility range. Always evaluate BBW against its own history on each chart. What counts as "narrow" for gold is different from what counts as "narrow" for the S&P 500.
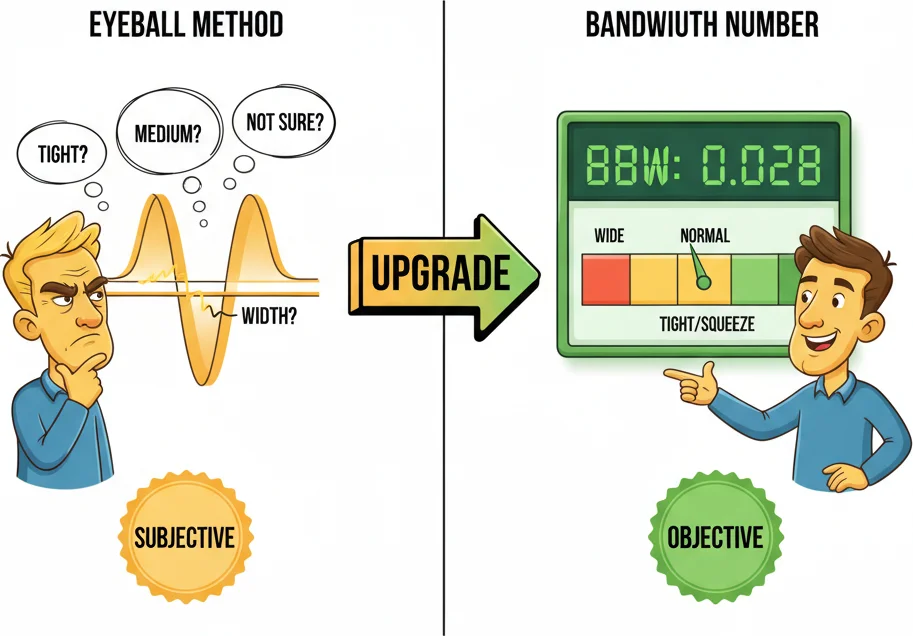
Your eyes can see a squeeze forming, but Bandwidth gives you a number — and numbers do not lie.
2BBW Formula: Measuring the Gap Between Upper and Lower Bands
The Bollinger Bandwidth formula is refreshingly simple for an indicator that carries so much analytical weight:
BBW = (Upper Band - Lower Band) / Middle Band
Some platforms multiply by 100 to express it as a percentage:
BBW = ((Upper Band - Lower Band) / Middle Band) x 100
Both versions are identical in shape — only the Y-axis scale differs. TradingView uses the decimal version by default. MetaTrader 5 and some other platforms use the percentage version. Whichever you see, the interpretation is the same: higher values mean wider bands (more volatility), lower values mean narrower bands (less volatility).
To fully understand BBW, let's unpack what feeds into it. The three components of Bollinger Bands are:
- Middle Band = 20-period Simple Moving Average (SMA)
- Upper Band = Middle Band + (2 x Standard Deviation of close over 20 periods)
- Lower Band = Middle Band - (2 x Standard Deviation of close over 20 periods)
Since the upper and lower bands sit equidistant from the middle band, the gap between them equals exactly 4 standard deviations (2 above + 2 below). So BBW is really measuring 4 x Standard Deviation / SMA(20) — which is just the standard deviation normalized by the current price level.
Let's walk through a concrete calculation on EUR/USD. Suppose the 20-period SMA sits at 1.0850. The standard deviation of closing prices over those 20 periods is 0.0045. Then:
- Upper Band = 1.0850 + (2 x 0.0045) = 1.0940
- Lower Band = 1.0850 - (2 x 0.0045) = 1.0760
- BBW = (1.0940 - 1.0760) / 1.0850 = 0.0166 (or 1.66%)
Now imagine volatility drops in half. Standard deviation falls to 0.00225:
- Upper Band = 1.0850 + (2 x 0.00225) = 1.0895
- Lower Band = 1.0850 - (2 x 0.00225) = 1.0805
- BBW = (1.0895 - 1.0805) / 1.0850 = 0.0083 (or 0.83%)
The BBW reading halved, which makes sense — the standard deviation halved. This linear relationship between standard deviation and BBW means the indicator faithfully tracks volatility changes without adding any distortion or smoothing.
| Scenario | Std Dev | Upper Band | Lower Band | BBW |
|---|---|---|---|---|
| Normal volatility | 0.0045 | 1.0940 | 1.0760 | 1.66% |
| Low volatility | 0.00225 | 1.0895 | 1.0805 | 0.83% |
| High volatility | 0.0090 | 1.1030 | 1.0670 | 3.32% |
The normalization step — dividing by the middle band — is what makes BBW more useful than just plotting the raw band distance. Without normalization, the absolute gap between bands would be larger on higher-priced instruments simply because their price level is higher. A 50-pip Bollinger Band gap on EUR/USD at 1.08 means something different from a 50-pip gap on GBP/JPY at 195.00 in percentage terms. BBW handles this automatically by expressing the width as a proportion of the middle band.
That said, the normalization only works within a single instrument's history. BBW values across different instruments are still not directly comparable because each asset has its own baseline volatility profile. Gold typically shows higher BBW readings than EUR/CHF simply because gold is more volatile. Compare BBW to its own past values on each chart, not against a universal benchmark.
A practical detail for MetaTrader 5 users: if you can't find a built-in BBW indicator, you can calculate it manually using the existing Bollinger Bands output. Add the standard Bollinger Bands indicator to your chart, then create a custom indicator or simply use the data window to note the upper and lower band values and compute BBW by hand. Alternatively, several free BBW indicators are available in the MQL5 marketplace.
| Platform | BBW Availability | Output Format |
|---|---|---|
| TradingView | Built-in ("Bollinger BandWidth") | Decimal (0.0166) |
| MetaTrader 5 | Custom indicator (MQL5 market) | Varies by version |
| NinjaTrader | Built-in | Decimal or percentage |
| thinkorswim | Built-in | Percentage |
One last nuance: because BBW depends on standard deviation, which depends on the lookback period, changing the Bollinger Bands period changes BBW's behavior significantly. A 10-period BBW reacts much faster to volatility shifts than a 50-period BBW. The default 20-period setting provides a balanced middle ground for most trading timeframes. If you shorten it for scalping, expect more noise. If you lengthen it for position trading, expect smoother readings but delayed signals.

That aha moment when you realize BBW literally measures how squeezed those bands are!
“The Squeeze is the single most important concept in Bollinger Bandwidth analysis.”
3Finding the Squeeze: When BBW Drops to Historical Lows
The Squeeze is the single most important concept in Bollinger Bandwidth analysis. John Bollinger himself identified it as the primary trading application of BBW, and for good reason — it exploits one of the most reliable patterns in market behavior: volatility is mean-reverting. Low volatility leads to high volatility. Every time.
A Squeeze occurs when BBW drops to a level that is historically low for that particular instrument on that particular timeframe. There's no universal threshold — you can't say "BBW below 0.02 is a Squeeze" and apply it everywhere. What qualifies as narrow depends entirely on the asset's recent history. The standard approach is to look for BBW at its lowest reading over the past 120-125 periods (approximately six months on the daily chart). When BBW hits that floor, you have a Squeeze.
Let's visualize what this looks like on a chart. Picture GBP/USD on the H4 timeframe consolidating in a tight range between 1.2650 and 1.2710 for two weeks. The Bollinger Bands gradually narrow until they're practically hugging the price action — the upper and lower bands are separated by only 40 pips instead of the usual 120-150. BBW on the indicator panel drops from its recent average of around 1.8% to 0.50%, hitting its lowest level in four months. That's a Squeeze.
What happens next is the key insight: the market breaks out. It doesn't always break out immediately — sometimes the Squeeze persists for days or even weeks — but eventually, the compressed spring releases. And when it does, the resulting move tends to be proportional to the duration of the compression. A two-week Squeeze often produces a multi-day trending move. A six-week Squeeze can launch a new multi-week trend.
How to identify a Squeeze systematically:
-
Look for BBW at 6-month lows. On the D1 chart, check if BBW is at its lowest reading in 125 bars. On H4, check 120 bars. This is the quantitative definition most traders use.
-
Confirm visually. The Bollinger Bands on the price chart should be visibly narrow — almost flat, running parallel. If the bands are still sloping and expanding/contracting with each swing, it's not a true Squeeze yet.
-
Check duration. A Squeeze that has lasted only two or three bars may resolve quickly with a minor move. A Squeeze that has persisted for 10-20+ bars has built up significant potential energy. Longer Squeezes tend to produce larger breakouts.
| Squeeze Duration | Typical Outcome | Trading Implication |
|---|---|---|
| 3-5 bars at low BBW | Minor breakout, possible false start | Wait for confirmation |
| 10-20 bars at low BBW | Moderate trending move | Standard breakout entry |
| 20+ bars at low BBW | Strong extended trend | Scale into position |
What the Squeeze does NOT tell you: Direction. This is the most common mistake traders make with BBW. They see the Squeeze forming and try to predict whether the breakout will go up or down. BBW gives you absolutely zero directional information. It only tells you that volatility is compressed and an expansion is coming. You need separate tools for the directional call — price action, support/resistance levels, trend analysis, or momentum indicators.
A practical approach is to use the Squeeze as an alert system. When BBW hits 6-month lows, you put the instrument on your watchlist and start paying closer attention to your other indicators and price levels. You're not trading the Squeeze itself — you're trading the breakout that follows, using your preferred directional method.
The Keltner Channel enhancement. Many traders refine the Squeeze concept by adding Keltner Channels to the mix — the famous TTM Squeeze variation developed by John Carter. The idea is that when Bollinger Bands contract so much that they move inside the Keltner Channels, you have an especially tight Squeeze. When the Bollinger Bands expand back outside the Keltner Channels, the Squeeze has "fired" and the breakout is underway. This provides a more precise signal than BBW alone, though the basic BBW approach works perfectly well without adding the Keltner complexity.
Common Squeeze mistakes to avoid:
- Entering before the breakout. The Squeeze tells you something is coming, not that it's happening now. Buying or selling during the Squeeze means you're guessing direction before the market has shown its hand.
- Ignoring the timeframe. A Squeeze on M15 might resolve with a 20-pip move that lasts 45 minutes. A Squeeze on D1 might produce a 300-pip trend over three weeks. Match your expectations to the timeframe.
- Assuming every Squeeze produces a big move. Most do, but some Squeezes resolve with a whimper — a brief expansion that immediately reverses. Always use stops and treat each breakout on its own merit.
The best Squeeze setups occur when the BBW reading is at its lowest in 6+ months AND the market is sitting near a significant support or resistance level. The structural level provides the directional catalyst, and the Squeeze provides the volatility spring. When both align, you get textbook breakout conditions.
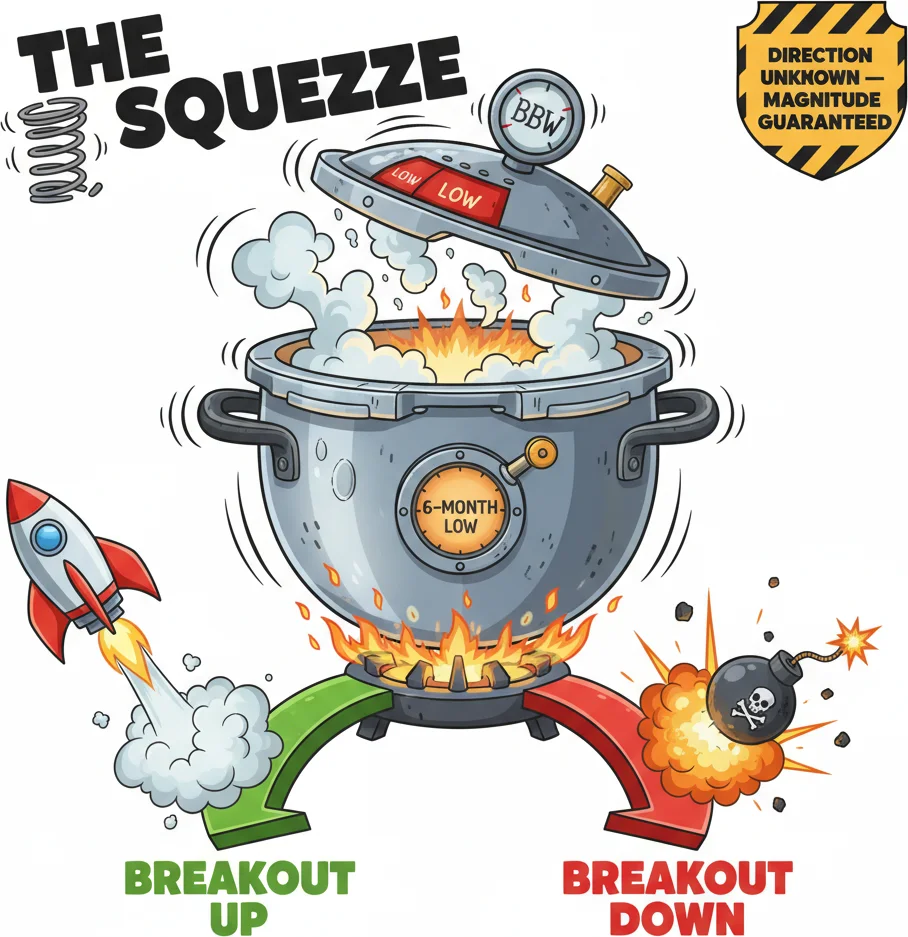
When Bandwidth hits a 6-month low, the market is coiling like a spring. Something big is coming.
4BBW Breakout Strategy: Trading the Expansion After the Squeeze
Knowing that a Squeeze exists is only half the puzzle. The money is made in trading the expansion that follows. Here's a structured approach to turning BBW Squeeze readings into actual trade entries with defined risk.
Step 1: Identify the Squeeze. BBW must be at or near its 120-period low on your trading timeframe. On H4, this means the lowest BBW reading in roughly 120 four-hour candles (~20 trading days). Don't be overly strict with the exact lookback — the point is that BBW should be historically compressed, not just slightly below average.
Step 2: Wait for the breakout candle. This is where discipline matters. You do not enter during the Squeeze. You wait for a candle to close beyond the Bollinger Bands:
- Long signal: A candle closes above the upper Bollinger Band.
- Short signal: A candle closes below the lower Bollinger Band.
The close is critical — not the wick. Intrabar spikes above or below the bands happen frequently during the Squeeze and often reverse before the candle closes. Only act on closed candles.
Step 3: Confirm with volume or momentum. A breakout candle with significantly above-average volume is more trustworthy than one on thin volume. If your platform shows volume data, look for at least 1.5x the 20-period average volume on the breakout candle. Alternatively, check a momentum indicator like RSI — if it confirms the direction (RSI above 50 for longs, below 50 for shorts), you have agreement.
Step 4: Enter and set stops. Enter on the close of the breakout candle or on a slight pullback in the next 1-2 candles. Place your stop-loss on the opposite side of the Bollinger Band range:
- For longs: stop below the lower Bollinger Band at the time of the Squeeze (the tightest point).
- For shorts: stop above the upper Bollinger Band at the Squeeze point.
This stop placement uses the compressed band range as your risk unit. Because the bands were narrow during the Squeeze, your stop distance is naturally tight — one of the key advantages of this strategy.
Step 5: Manage the trade. As the breakout develops, the Bollinger Bands will expand rapidly. BBW will spike upward as volatility increases. Trail your stop using the middle Bollinger Band (20 SMA) or the opposite band. A common approach:
- Move stop to breakeven when price reaches 1:1 risk-reward.
- Trail stop below the 20 SMA for trend-following exits.
- Take partial profits when BBW reaches its 6-month high (volatility extreme in the other direction).
| Step | Action | Details |
|---|---|---|
| 1 | Identify Squeeze | BBW at 120-period low |
| 2 | Wait for breakout | Candle closes beyond upper or lower band |
| 3 | Confirm | Volume > 1.5x avg or momentum agreement |
| 4 | Enter + stop | Enter on close, stop at opposite band |
| 5 | Manage | Trail with 20 SMA, partials at BBW high |
Practical example on USD/JPY H4:
USD/JPY trades between 149.20 and 149.80 for eight trading days. The Bollinger Bands squeeze to their tightest level in five months, and BBW drops to 0.35% — well below its recent average of 1.1%. The upper band sits at 149.85, the lower at 149.32. On day nine, a strong bullish H4 candle closes at 150.05, above the upper band. Volume on this candle is 1.8x the 20-period average. RSI reads 58 and rising.
Entry: 150.05 on the breakout close. Stop: 149.30 (just below the lower band at the Squeeze). Risk: 75 pips. The trade targets 1:2 or trails the 20 SMA. Over the next three trading days, USD/JPY pushes to 151.40 as the Bollinger Bands blow apart and BBW spikes from 0.35% to 1.6%.
Head fakes — the biggest risk. John Bollinger himself warns about "head fakes" — false breakouts where price briefly pierces the band, then snaps back the other direction. The head fake is the Squeeze strategy's nemesis. Mitigation tactics:
- Wait for confirmation. Don't enter on the first candle that touches the band. Wait for a close beyond it.
- Use a two-candle rule. Some traders require two consecutive closes beyond the band before entering.
- Check the higher timeframe. If the D1 chart shows a clear trend direction, only take Squeeze breakouts on H4 that align with that direction.
- Accept the loss quickly. If a breakout reverses and hits your stop, don't re-enter in the same direction immediately. Wait for a fresh setup. Sometimes the real breakout happens in the opposite direction.
Timeframe recommendations for the BBW Squeeze strategy:
| Timeframe | Squeeze Duration to Watch | Typical Move After Breakout | Best For |
|---|---|---|---|
| H1 | 3-7 days of tight BBW | 50-100 pips | Intraday swing trades |
| H4 | 1-3 weeks of tight BBW | 100-300 pips | Swing trading |
| D1 | 3-8 weeks of tight BBW | 300-800+ pips | Position trading |
The BBW Squeeze strategy works best on H4 and D1 where the Squeeze has had time to build meaningful compression. On lower timeframes like M15 or M30, Squeezes form and resolve too quickly for most traders to react, and head fakes are significantly more common.

When volatility finally explodes after the squeeze - your BBW breakout strategy in action!
“Bollinger Bandwidth and Average True Range (ATR) are the two most widely used volatility indicators, and traders constantly debate which is better.”
5BBW vs ATR for Volatility Measurement: Different Tools, Different Insights
Bollinger Bandwidth and Average True Range (ATR) are the two most widely used volatility indicators, and traders constantly debate which is better. The honest answer: they measure volatility differently, and understanding how they differ helps you pick the right tool for each job — or use both.
What each one actually measures:
BBW is built on standard deviation of closing prices. It captures how much closing prices have dispersed from their mean over the lookback period. Because it only uses closing prices, it ignores intrabar volatility — a candle that ranged 100 pips but closed 5 pips from the open looks "calm" to BBW.
ATR is built on true range — the maximum of (High - Low), (High - Previous Close), and (Low - Previous Close). It captures the full bar-to-bar price excursion including gaps. ATR sees every pip of movement within each candle, not just where it closed.
This fundamental difference in inputs means the two indicators can tell different stories at the same time:
| Scenario | BBW Reading | ATR Reading | Market Reality |
|---|---|---|---|
| Tight range, small candles | Low | Low | Quiet market, both agree |
| Trending, steady closes | Rising | Rising | Active trend, both agree |
| Wide-range candles, closes near middle | Low-moderate | High | Choppy/volatile but not trending |
| Steady trend with small daily ranges | Moderate-high | Low | Smooth trend, low intrabar noise |
The third scenario is particularly interesting. During choppy markets where price whipsaws with large intrabar ranges but closes near its opening price each day, ATR will be elevated (because each candle's range is wide) while BBW may stay relatively low (because closing prices aren't dispersing much from the mean). A trader relying only on BBW might miss the fact that intrabar volatility is actually high. A trader relying only on ATR might overestimate the trend potential when the market is actually going nowhere net.
Where BBW excels:
- Squeeze detection. BBW is purpose-built for identifying compressed volatility and anticipating breakouts. ATR can show low volatility too, but BBW's normalization against the moving average makes it more precise for this specific application.
- Trend strength context. During a trending move, BBW tells you whether the trend is still expanding (BBW rising) or starting to mature (BBW plateauing or declining). This helps with exit timing.
- Relative comparison over time. Because BBW is normalized by the middle band, its readings remain consistent even as the price level of an instrument changes over months. ATR, being expressed in absolute price units, needs to be re-evaluated as price levels shift.
Where ATR excels:
- Stop-loss placement. ATR gives you a concrete number — average range in pips — that translates directly to stop distances. A stop at 1.5x ATR below entry is one of the most popular risk management techniques in trading. BBW doesn't provide this kind of actionable pip value.
- Position sizing. Because ATR tells you the typical range per period in absolute units, you can calibrate position size so that a normal adverse move doesn't exceed your risk budget. BBW's percentage output is less intuitive for this purpose.
- Intrabar volatility. If you need to know how much a candle typically moves from high to low (for setting take-profit targets or judging whether a stop is likely to get clipped by noise), ATR answers this directly. BBW doesn't see intrabar ranges at all.
| Use Case | Better Tool | Why |
|---|---|---|
| Squeeze / breakout anticipation | BBW | Designed specifically for this |
| Stop-loss distance | ATR | Direct pip-value output |
| Position sizing | ATR | Absolute price range |
| Trend expansion tracking | BBW | Shows band expansion clearly |
| Intrabar noise assessment | ATR | Captures full candle range |
| Cross-timeframe comparison | BBW | Normalized by price level |
Using both together — the pragmatic approach:
The most effective setup combines both indicators without redundancy. Use BBW to identify Squeeze conditions and monitor when volatility expansion begins. Then use ATR for the operational details — setting your stop-loss distance, calculating position size, and determining take-profit targets.
Here's what this looks like in practice on EUR/USD H4:
- BBW drops to its 6-month low — Squeeze identified. You start watching for a breakout.
- A breakout candle closes above the upper Bollinger Band. BBW starts rising.
- ATR(14) reads 42 pips. You set your stop at 1.5 x ATR = 63 pips below entry.
- Your account risk is 1%. With a 63-pip stop, you calculate position size accordingly.
- As the trend develops, BBW continues rising, confirming the expansion is healthy. When BBW starts to plateau or curl downward, you tighten your trailing stop.
In this workflow, BBW handles the strategic question ("Is volatility compressed? Is the expansion still alive?") while ATR handles the tactical questions ("How far should my stop be? How large should my position be?"). Neither tool replaces the other — they serve complementary roles.
One more distinction worth noting: reactivity. BBW tends to change direction more frequently because standard deviation reacts bar-by-bar. ATR is smoother because it's an averaged measure. This means BBW gives earlier signals when volatility is shifting, but also produces more false readings during transitional periods. ATR is slower to signal changes but more stable once it does. For Squeeze detection, BBW's faster reactivity is an advantage. For risk management parameters that shouldn't change every bar, ATR's smoothness is preferable.
The bottom line: don't think of it as BBW versus ATR. Think of it as BBW plus ATR, each doing what it does best. Your trading plan has room for both.
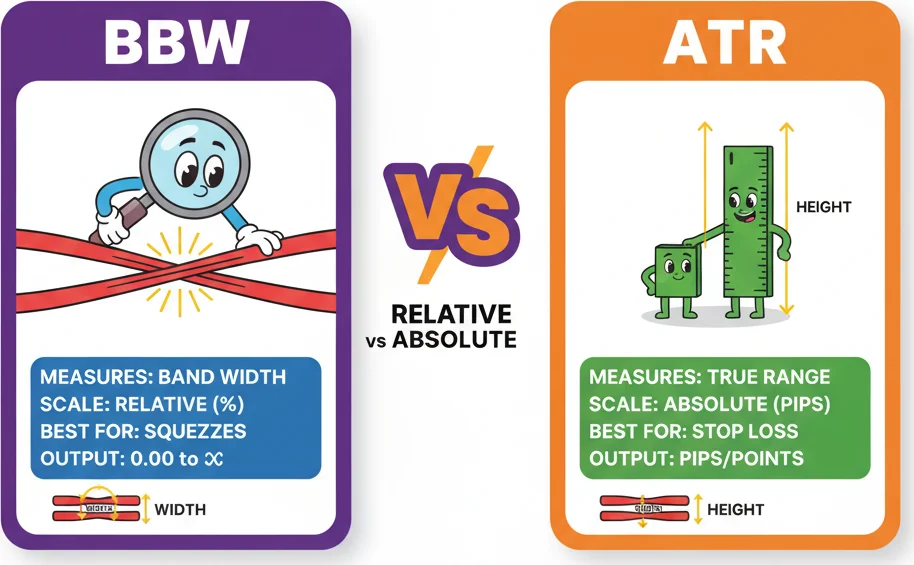
BBW measures band width relative to the moving average. ATR measures absolute pip range. Different lenses on the same market.
Frequently Asked Questions
Q1What BBW value indicates a Squeeze?
There is no universal threshold. A Squeeze is defined as BBW reaching its lowest level relative to its own recent history — typically the lowest reading in 120 to 125 periods. What qualifies as a Squeeze on EUR/USD (perhaps BBW below 0.5%) would be completely different from what qualifies on Bitcoin (where BBW might need to drop below 3%). Always compare BBW to its own historical range on each specific instrument and timeframe rather than looking for a fixed number.
Q2Does Bollinger Bandwidth predict breakout direction?
No. BBW measures only the width of the bands — it tells you that volatility is compressed and an expansion is likely, but it gives zero information about whether the breakout will be bullish or bearish. You need additional tools for direction: price action patterns, support and resistance levels, trend analysis on higher timeframes, or momentum indicators like RSI or MACD. BBW identifies the when; other tools identify the where.
Q3What are the best BBW settings for day trading?
The default settings of 20-period SMA with 2 standard deviations work well on H1 and H4 charts for most day trading approaches. On faster timeframes like M15, some traders reduce the period to 10-14 for quicker reactivity, though this increases noise. The key rule is to keep your BBW settings synchronized with your Bollinger Bands settings — if you change one, change the other. H1 and H4 are the most reliable timeframes for BBW Squeeze signals in day trading.
Q4Can I use Bollinger Bandwidth on MetaTrader 5?
MetaTrader 5 does not include Bollinger Bandwidth as a built-in indicator, but several free and paid BBW indicators are available in the MQL5 marketplace (Code Base section). Search for "Bollinger BandWidth" or "BBW" in the MT5 indicator library. Alternatively, you can observe band compression directly on the standard Bollinger Bands overlay, though having the dedicated BBW line makes it much easier to spot historical lows and set alerts for Squeeze conditions.
Q5How is Bollinger Bandwidth different from Bollinger %b?
They measure completely different things. BBW measures the width of the bands — how far apart the upper and lower bands are relative to the middle band. It answers the question: how volatile is the market right now? Bollinger %b measures where the current price sits within the bands on a 0-to-1 scale. It answers the question: is price near the top of the bands or the bottom? BBW is a volatility tool for identifying Squeezes and expansions. %b is a position tool for identifying overbought and oversold conditions. Both were created by John Bollinger as companion indicators to the original bands.
Top Brokers
About the Author
Daniel Harrington
Senior Trading Analyst
Daniel Harrington is a Senior Trading Analyst with a MScF (Master of Science in Finance) specializing in quantitative asset and risk management. With over 12 years of experience in forex and derivatives markets, he covers MT5 platform optimization, algorithmic trading strategies, and practical insights for retail traders.
Use This Indicator
Risk Disclaimer
Trading financial instruments carries significant risk and may not be suitable for all investors. Past performance does not guarantee future results. This content is for educational purposes only and should not be considered investment advice. Always conduct your own research before trading.