Bulls Power Indicator: Measuring Buying Pressure & Trend Strength
Bulls Power measures the ability of buyers to push prices above an EMA, with positive values indicating bullish pressure strength.

Daniel Harrington
Senior Trading Analyst · MT5 Specialist
☕ 15 min read
Settings — Bulls
| Category | oscillator |
| Default Period | 13 |
| Best Timeframes | H1, H4, D1 |
Bulls Power does exactly what its name suggests -- it measures how much force buyers are throwing at the market in any given moment. Dr. Alexander Elder created it in 1989 as one half of his Elder Ray system (the other half being Bears Power), and the concept landed in print through his 1993 classic Trading for a Living. The formula strips buying pressure down to a single number: how far above a 13-period EMA can buyers push the session high? Elder named his system after medical X-rays because it was meant to reveal the bone structure beneath the skin of price action -- the hidden forces that candlesticks alone cannot show. Despite shipping natively in every MetaTrader 5 installation under Insert > Indicators > Oscillators, Bulls Power sits in the shadow of RSI and MACD. That is a missed opportunity, because this indicator captures something neither of those tools directly measures: the raw distance between peak buying aggression and the market's consensus price. If you have ever wondered whether the bulls behind a rally are flexing real muscle or just coasting on fumes, this is the tool that answers.
Key Takeaways
- Alexander Elder is a psychiatrist turned trader -- a combination that sounds unusual until you realize that half of succ...
- Reading Bulls Power comes down to three elements: the sign (positive or negative), the direction (rising or falling), an...
- Elder's original trading system using Bulls Power and Bears Power is one of the most structured indicator-based strategi...
1Alexander Elder's Other Half: How Bulls Push Price Above the EMA
Alexander Elder is a psychiatrist turned trader -- a combination that sounds unusual until you realize that half of successful trading is understanding crowd behavior. He spent years studying how group psychology translates into price data before publishing the Elder Ray framework, and Bulls Power was built on one specific observation about what the high of each candle actually represents.
The formula is almost comically simple:
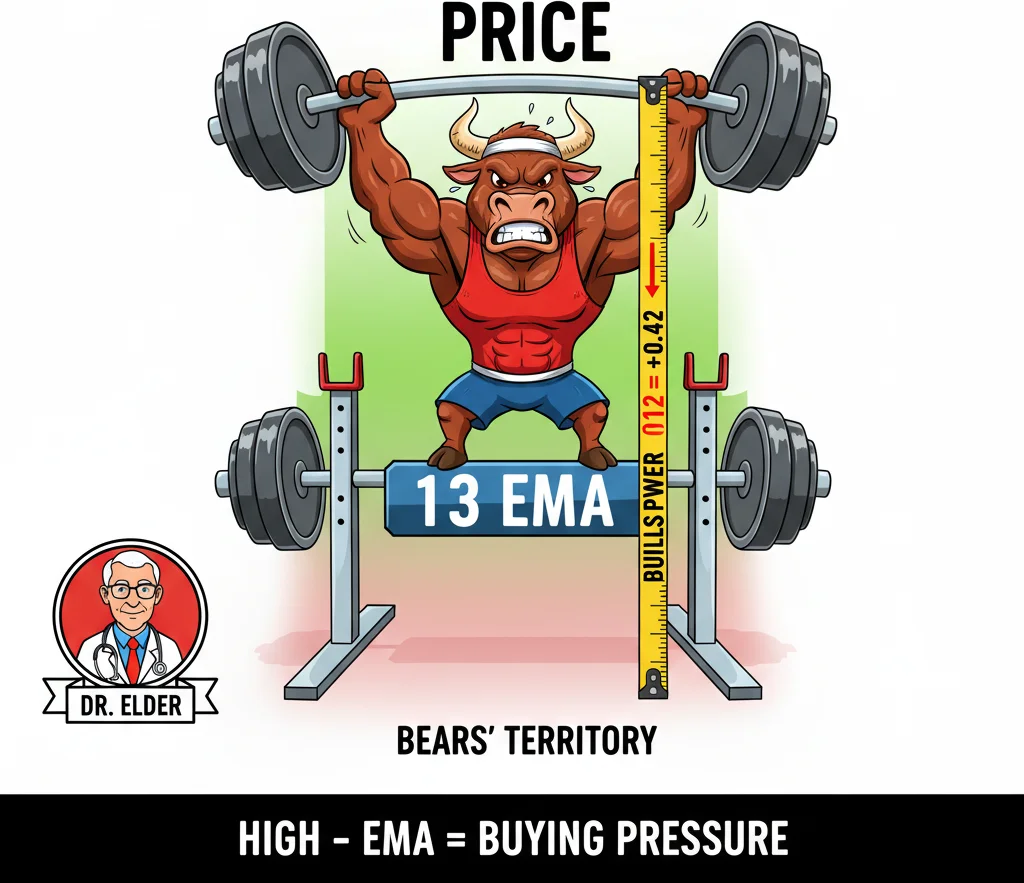
Bulls Power = High - EMA(Close, 13)
Every candle, the indicator subtracts the 13-period exponential moving average of closing prices from the bar's high. That is the entire calculation. No smoothing layers, no weighting coefficients, no secondary formulas. Just the distance between the highest price buyers achieved and the average price consensus.
Why the high specifically? Elder's reasoning was straightforward. The high of any candle represents the maximum price buyers were willing to pay during that period. It captures peak bullish aggression -- the moment when buyer enthusiasm hit its ceiling. The EMA, meanwhile, represents a smoothed consensus of where the market has been trading recently. The gap between those two values tells you exactly how far beyond the consensus buyers managed to push.
Think of the EMA as a rubber band attached to price. Buyers stretch it upward with every rally. The further they stretch it, the stronger the buying pressure. When Bulls Power reads 0.0060 on EUR/USD, buyers pushed the high 60 pips above the EMA. When it reads 0.0015, they could only manage 15 pips. The number itself is the effort measurement -- no interpretation gymnastics required.
The 13-period EMA was Elder's deliberate choice, not an arbitrary default. He considered 13 periods to represent roughly half a lunar cycle -- about two and a half trading weeks on a daily chart. More practically, a 13 EMA sits in a sweet spot between the sluggish 20-period and the twitchy 8-period alternatives. It is responsive enough to track short-term trend shifts without whipsawing on every minor pullback.
Unlike bounded oscillators such as RSI (locked between 0 and 100) or Stochastic (also 0 to 100), Bulls Power has no ceiling and no floor. On a volatile day in crude oil, the indicator might spike to 3.50. On a quiet afternoon in EUR/CHF, it might barely register 0.0005. This unbounded nature makes cross-instrument comparisons meaningless -- but it gives you an unfiltered, uncapped view of buying pressure on whatever chart you are watching.
The indicator plots as a histogram below your price chart, with bars oscillating above and below a zero line. Positive bars mean the high exceeded the EMA -- buyers have the edge. Negative bars mean even the session high could not reach the EMA -- sellers have firmly suppressed buying attempts. The zero line marks equilibrium where the high exactly equals the EMA, though that precise condition is relatively rare in practice.
One critical detail that many tutorials skip: Bulls Power was never designed to work alone. Elder created it as one component of a two-part system. Bulls Power measures the buy side. Bears Power (Low minus EMA) measures the sell side. Using Bulls Power without its companion is like reading only the prosecution's argument in a trial -- you get one perspective, but the full verdict requires hearing both sides. Elder himself was emphatic about this in every interview and book chapter on the topic.
In Elder is world, the EMA is fair value. Bulls win when they shove price above it. Simple physics.
2Positive Values, Rising Peaks, and What They Mean for Your Trades
Reading Bulls Power comes down to three elements: the sign (positive or negative), the direction (rising or falling), and the relationship between consecutive peaks. Each combination tells a different story about market conditions, and knowing which story you are reading makes the difference between actionable analysis and chart staring.
Positive and Rising: Bulls in Full Control
When the histogram bars sit above zero and each new bar is taller than the last, buyers are not only pushing price above the EMA -- they are doing it with increasing force. This is the strongest bullish configuration the indicator can display. On EUR/USD H4, a sequence of five or more consecutively rising positive bars typically coincides with a directional move of 80 to 150 pips. The rising peaks confirm that each new candle's high stretches further from the EMA than the one before.
This is not the time to look for short entries. Rising Bulls Power during an uptrend is pure trend confirmation, and fighting it historically produces poor results. Ride the wave or step aside.
Positive but Declining: The First Warning
This is where most traders miss the memo. Bulls Power is still positive -- the high still lands above the EMA -- but each successive peak is lower than the previous one. Buyers are still present, but their reach is shrinking candle by candle. The rubber band is losing tension.
On a daily GBP/USD chart, declining positive peaks often precede a pullback to the EMA by 3 to 7 candles. The move does not necessarily reverse the entire trend, but it typically creates a retracement deep enough to justify tightening stops or banking partial profits.
Negative Values: Buyers Below the Waterline
When Bulls Power drops below zero, the session high itself has fallen below the EMA. This is a clear statement from the market: buyers could not even push price to the average, let alone above it. In a downtrend, negative readings are expected and simply confirm the prevailing direction. During the USD/JPY decline in late 2024, Bulls Power on the daily chart stayed negative for over 30 consecutive sessions.
Negative readings during what you believed was an uptrend are a different matter entirely. If the EMA is rising but Bulls Power turns negative, buyers are failing to participate in what should be their market. This disconnect flags potential exhaustion -- like a sprinter still technically in the race but visibly slowing.
Divergence: The Highest-Probability Signal
Bullish divergence on Bulls Power occurs when price makes a lower low but the indicator prints a higher low. Sellers drove price lower, but buyers quietly exerted more force than they did at the previous low. This is stealth accumulation -- the structural shift that precedes reversals.
Bearish divergence works in reverse: price makes a higher high, but Bulls Power records a lower peak. The rally continued on paper, but buying force actually weakened. Elder considered divergence the single most valuable signal from both Bulls Power and Bears Power, and backtesting data on forex majors generally supports that view. Divergence signals on H4 and D1 charts have historically preceded reversals within 5 to 12 candles roughly 60 to 65 percent of the time.
A practical tip for divergence spotting: ignore single-bar discrepancies. Valid divergence requires at least two clearly defined swing points on both price and the indicator, separated by a minimum of 10 candles. Anything shorter is likely noise rather than a genuine structural shift. Patience here is not optional -- it is the filter that separates real divergences from wishful thinking.

When Bulls Power goes positive and keeps climbing - bullish momentum confirmed!
“Elder's original trading system using Bulls Power and Bears Power is one of the most structured indicator-based strategies in technical analysis.”
3Bulls Power + 13 EMA: The Classic Elder Ray Long Setup
Elder's original trading system using Bulls Power and Bears Power is one of the most structured indicator-based strategies in technical analysis. It is not a loose framework open to interpretation -- it has specific mandatory conditions and optional filters that improve signal quality. Here is how the long setup works, step by step.
Mandatory Condition 1: The 13-period EMA must be rising.
This is the trend filter, and it is non-negotiable. A rising EMA means the average price consensus is shifting upward. Without this condition, every other signal is noise. Plot a 13-period EMA directly on your price chart and confirm it has a visible upward slope before considering any long entry. On EUR/USD H4, a rising 13 EMA typically establishes itself after 8 to 12 bars of sustained buying.
Mandatory Condition 2: Bears Power must be negative but increasing (moving toward zero).
This sounds counterintuitive at first. Why check Bears Power for a long entry? Because Elder designed the system to identify moments where sellers are losing control. A negative Bears Power reading climbing toward zero means sellers pushed the low below the EMA, but their grip is weakening. Each successive low sits closer to the EMA, not further from it. Sellers are running out of ammunition -- exactly the moment you want to join the other side.
Mandatory Condition 3: Bulls Power must be positive.
This confirms that buyers are at least managing to push the high above the EMA. If Bulls Power is negative while Bears Power is rising toward zero, you have a mixed signal -- sellers may be retreating, but buyers have not shown up yet. You need both halves to agree.
Optional Filter 1: The latest Bulls Power peak should exceed the previous one.
This adds momentum confirmation. Buyers are not just active -- their most recent effort topped their prior effort. The trend is not merely continuing, it is accelerating.
Optional Filter 2: Bullish divergence on Bears Power.
Price prints a lower low, but Bears Power records a higher low. Sellers drove price down but with diminishing force. When all five conditions align, Elder considered this the highest-probability long entry his entire system could produce. (A five-star alignment does not happen every week, which is partly why it works.)
Practical execution on MT5:
Set up your chart with three elements: a 13-period EMA on the price chart, Bulls Power (period 13) in the first subwindow, and Bears Power (period 13) in the second subwindow. Scan for the EMA slope first -- this eliminates about 60 percent of charts immediately. Then check Bears Power for a negative-but-rising pattern. Finally, confirm Bulls Power is positive.
Entry goes on the close of the bar that satisfies all conditions. Stop-loss follows Elder's recommendation: below the most recent swing low, which typically sits near the point where Bears Power hit its most negative reading. Target can be a fixed reward-to-risk ratio of 2:1, or you can trail the stop below the EMA as the trade progresses.
On GBP/USD D1, the complete setup typically generates 2 to 4 signals per quarter during trending conditions. On H4, expect roughly 1 to 2 signals per month. These are not high-frequency entries -- Elder designed the system for quality over quantity, and traders who try to force signals during flat markets quickly learn why.
The most common mistake with this setup: entering when the EMA is flat. A flat EMA means there is no directional consensus. Bulls Power and Bears Power signals during a flat EMA produce win rates barely above a coin flip. The EMA slope is the gatekeeper -- respect it, or the system stops working.
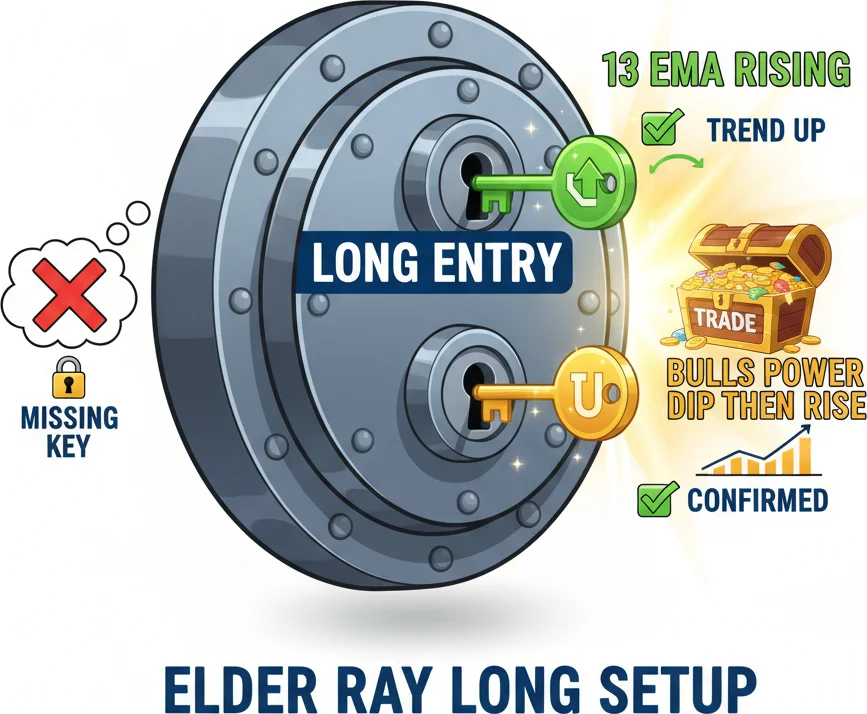
Elder does not just look at Bulls Power alone — the 13 EMA must be rising first, then Bulls Power confirms.
4Spotting Weakening Bulls: When Positive Power Starts Declining
Knowing when to get in is only half the game. Knowing when the buyers driving your long position are losing steam -- that is the other half, and it is where Bulls Power genuinely earns its spot on your chart.
The Declining Peaks Pattern
The clearest sign of weakening bulls is a sequence of lower highs on the Bulls Power histogram while price continues making higher highs on the chart. Each new candle reaches a new price peak, but the distance between that peak and the EMA is shrinking. Buyers are still technically winning, but their margin of victory narrows with every bar.
This pattern unfolds over 8 to 20 candles on H4 charts. The first declining peak after a strong rising sequence is usually not actionable -- it could be a normal breath in the trend. The second consecutive declining peak raises the probability of a pullback. By the third declining peak, the odds of at least a retracement to the EMA become substantial.
On USD/CAD H4 during trending phases, three consecutive declining Bulls Power peaks preceded an EMA retest within the next 5 to 8 candles roughly 70 percent of the time. The retest did not always lead to a full trend reversal, but it created a pause significant enough to justify tightening stops or reducing position size.
The Zero-Line Approach
When Bulls Power declines from a positive peak and starts approaching the zero line, pay close attention. Zero represents the point where the high equals the EMA -- buyers have zero excess force. A drop through zero means the session high is now below the EMA, and whatever uptrend was driving the move has lost buyer participation.
The speed of the approach matters. A gradual decline over 10 to 15 bars suggests an orderly wind-down -- the trend may consolidate rather than reverse. A sharp drop from 0.0050 to zero in 3 to 4 bars suggests a more abrupt loss of buyer confidence, often coinciding with a news event or a failed test of key resistance.
Combining Declining Bulls Power with Price Structure
Declining Bulls Power becomes most actionable when it coincides with price approaching a known resistance level. If EUR/USD is grinding toward the 1.1000 round number and Bulls Power peaks are declining, you have structural resistance meeting fading momentum. This confluence historically produces meaningful pullbacks.
Conversely, declining Bulls Power in the middle of an open range -- no obvious resistance ahead, no fundamental catalyst -- is less significant. Momentum naturally ebbs and flows during trends. Not every decline signals a trade.
Managing Existing Long Positions
For traders already in a long position, declining Bulls Power provides a practical trail management framework:
- First declining peak: Move stop to breakeven if not already there.
- Second declining peak: Trail stop to below the most recent swing low.
- Bulls Power crosses below zero: Consider closing entirely, or at minimum reduce to half size.
This approach will not capture the absolute top -- nobody consistently does. But it protects the majority of a move's profits. On trending H4 charts, this trailing method typically preserves 60 to 75 percent of peak unrealized profit, compared to traders who use no trailing and give back most gains when the correction arrives.
The Fake Weakness Trap
Not every decline in Bulls Power is genuine weakening. During strong trends, consolidation phases produce naturally lower readings as volatility compresses. The histogram bars shrink, but price holds its ground above the EMA. This is a coiled spring pattern -- low Bulls Power followed by a sudden expansion when the consolidation breaks.
The tell: if price is holding above the EMA in a tight range while Bulls Power declines, do not assume the trend is finished. Watch for a sudden Bulls Power spike above its recent declining peaks. That spike often marks the trend's resumption with renewed buying force. Getting shaken out of a legitimate long position because Bulls Power dipped during a consolidation is one of the more frustrating experiences this indicator can serve up.
Bulls getting tired? Time to wait patiently for the next strong setup.
“Using Bulls Power in isolation is like checking only the offense stats before betting on a football match -- you need the defensive picture too.”
5Bulls Power + Bears Power Together: Reading the Full Picture
Using Bulls Power in isolation is like checking only the offense stats before betting on a football match -- you need the defensive picture too. Elder built the Elder Ray system with two halves for a reason: the interaction between Bulls Power and Bears Power reveals dynamics that neither indicator shows alone.
The Four Market States
Combining the two indicators creates four distinct conditions:
State 1 -- Bulls Power positive and rising, Bears Power negative but rising toward zero. Textbook uptrend. Buyers are stretching the high further above the EMA while sellers lose their ability to push the low below it. Both halves of the market are moving in the bull's favor. On EUR/USD D1, this state persisted for extended periods during the 2023 rally, providing position traders with a clear stay-long signal.
State 2 -- Bulls Power positive but declining, Bears Power negative and declining. Mixed signals. Buyers are losing reach while sellers simultaneously gain it. This is the transition zone that often precedes trend changes. The key question: which side is changing faster? If Bulls Power declines slowly while Bears Power plunges rapidly, bears are winning the momentum race.
State 3 -- Bulls Power negative, Bears Power negative and deepening. Full bearish control. Buyers cannot push the high to the EMA, and sellers are driving lows progressively further below it. Shorting pullbacks in this state is the mirror image of Elder's long setup.
State 4 -- Bulls Power positive, Bears Power positive. Both the high and the low sit above the EMA. This unusual state occurs during aggressive breakouts and parabolic moves -- everything is above the consensus, and volatility is expanding upward. It rarely lasts more than a few bars and often precedes exhaustion. Enjoy the ride, but do not chase it at the tail end.
The Power Balance Ratio
Some traders calculate the ratio between Bulls Power and Bears Power (using absolute values) to quantify which side dominates. If Bulls Power reads +0.0040 and Bears Power reads -0.0015, the ratio is roughly 2.7 to 1 in favor of bulls. Ratios above 2:1 suggest a clear winner. Ratios near 1:1 indicate balance and typically coincide with ranging markets where directional trades carry lower probability.
Divergence Across Both Indicators
The most powerful divergence signals use both indicators simultaneously. If price makes a higher high but Bulls Power makes a lower peak while Bears Power makes a deeper trough at the same time, the picture is unambiguous: buyers are weakening at exactly the moment sellers are gaining strength. This dual divergence pattern is rarer than single-indicator divergence but significantly more reliable.
On GBP/JPY D1, dual divergence signals have historically preceded corrections of 200 pips or more within the following 10 to 15 sessions. The rarity of the signal -- perhaps 3 to 5 times per year on any single pair -- is what gives it its power. When both sides of the Elder Ray disagree with price simultaneously, something structural is shifting beneath the surface.
Practical Chart Setup for MT5
The ideal layout places your price chart with a 13-period EMA on top, Bulls Power in the first indicator window, and Bears Power in the second. Some traders color-code the histograms: green for bars above their previous bar, red for bars below. This visual shortcut makes scanning for rising and declining patterns faster.
Alternatively, you can add both to a single indicator window and compare them visually, though MT5's default layout uses separate windows. The separate approach makes it easier to spot divergence on each indicator independently before checking for the more powerful dual divergence pattern.
When to Avoid Trading Either Signal
Both indicators produce unreliable signals during low-volatility consolidation and around major news releases. If the 13-period EMA is flat -- neither rising nor falling -- Bulls Power and Bears Power will oscillate around zero without providing directional guidance. These flat-EMA periods are data-gathering phases, not trading phases. Wait for the EMA to pick a direction before acting on any signal from either half of the Elder Ray system.
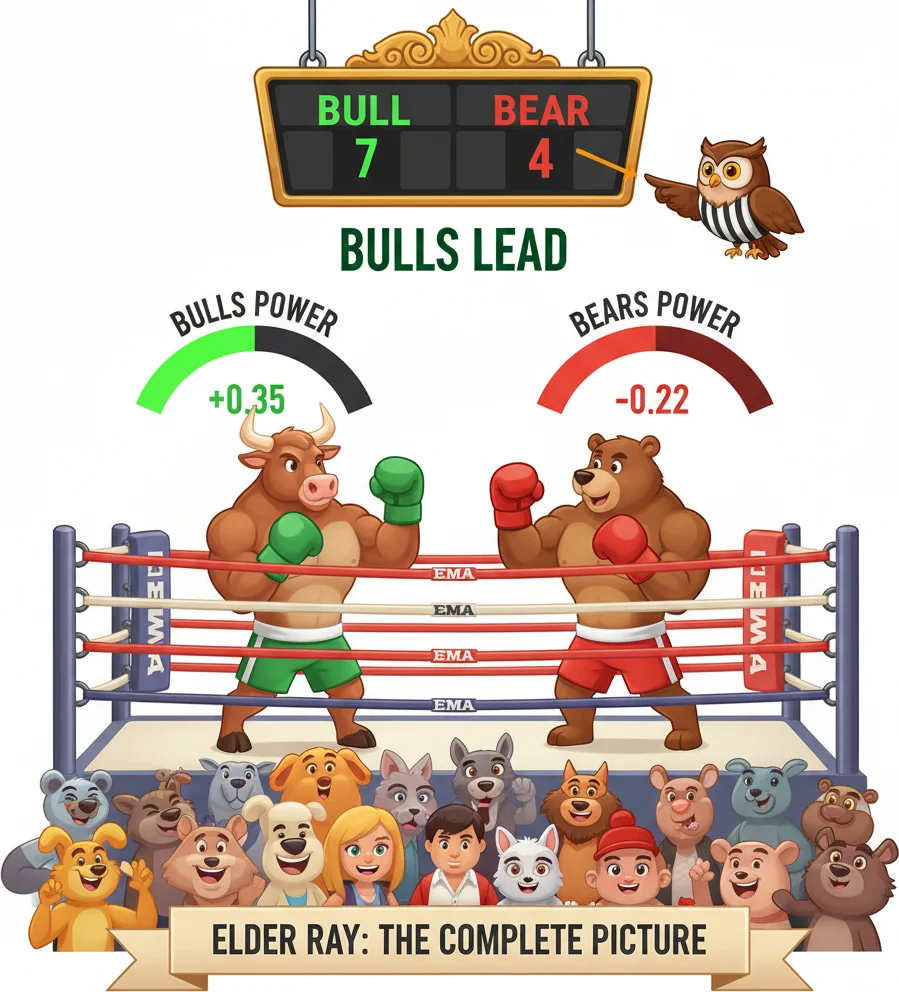
Bulls Power shows one arm of the fight. Bears Power shows the other. Together you see who is actually winning.
Frequently Asked Questions
Q1What is the difference between Bulls Power and Bears Power?
Bulls Power measures the distance between the session high and the 13-period EMA (High minus EMA), capturing how far above the consensus buyers can push. Bears Power measures the distance between the session low and the same EMA (Low minus EMA), capturing how far below sellers can drag price. Together they form the Elder Ray system. Bulls Power is typically positive during uptrends and negative during strong downtrends. Bears Power is typically negative during downtrends and positive during aggressive rallies. Using both gives you a complete picture of the tug-of-war between buyers and sellers -- which is exactly how Alexander Elder intended the system to be used.
Q2What is the best period setting for Bulls Power?
The default period of 13 was chosen by Alexander Elder for daily charts and remains the standard recommendation for D1 and H4 timeframes. On H1 charts, reducing the period to 8 or 10 increases sensitivity to intraday momentum shifts, though it also generates more false signals. On weekly charts, extending to 21 smooths out noise and makes signals rarer but more meaningful. Most traders should start with 13 on their primary timeframe and only adjust after observing how the indicator behaves across at least 30 to 50 bars of price action on their specific instrument.
Q3Can Bulls Power be used as a standalone indicator?
Elder explicitly designed Bulls Power to work alongside Bears Power and a 13-period EMA, not in isolation. Using it alone gives you only the buy-side perspective, which is like reading half a financial report and making investment decisions from it. The indicator says nothing about selling pressure, volume, or support and resistance levels. At minimum, add Bears Power and the 13-period EMA to complete the Elder Ray framework. For additional confirmation, many traders pair the system with a longer-term trend filter such as a 50 or 200-period moving average.
Q4How do I trade bullish divergence on Bulls Power?
Bullish divergence occurs when price makes a lower low but Bulls Power prints a higher low, signaling that buyers are quietly gaining strength even as price continues falling. To trade it, first confirm the divergence spans at least 10 candles between the two swing lows. Then wait for a confirmation candle -- a bullish close above the prior bar's high, or a break above a short-term trendline. Place your stop-loss below the most recent price low and target a minimum reward-to-risk ratio of 2:1. Divergence signals on H4 and D1 are considerably more reliable than those on M15 or H1, where intraday noise generates frequent false divergences.
Q5Why does Bulls Power sometimes show negative values during an uptrend?
Negative Bulls Power during an uptrend means the session high fell below the 13-period EMA. This happens during pullbacks within the trend -- price is correcting toward or below the average before potentially resuming higher. A single negative bar is not alarming and occurs naturally in healthy trends. Multiple consecutive negative bars while the EMA is still rising suggest the pullback is deepening and buyers need more time to regroup. If the EMA itself begins flattening or turning down while Bulls Power stays negative, the uptrend may be transitioning into a range or reversal.
Top Brokers
About the Author
Daniel Harrington
Senior Trading Analyst
Daniel Harrington is a Senior Trading Analyst with a MScF (Master of Science in Finance) specializing in quantitative asset and risk management. With over 12 years of experience in forex and derivatives markets, he covers MT5 platform optimization, algorithmic trading strategies, and practical insights for retail traders.
Use This Indicator
Risk Disclaimer
Trading financial instruments carries significant risk and may not be suitable for all investors. Past performance does not guarantee future results. This content is for educational purposes only and should not be considered investment advice. Always conduct your own research before trading.