Chaikin Volatility Indicator: Marc Chaikin's Approach to Measuring Market Expansion
Chaikin Volatility measures the rate of change of the trading range, with increasing values signaling rising volatility often associated with market tops or bottoms.

Daniel Harrington
Senior Trading Analyst · MT5 Specialist
☕ 18 min read
Settings — CV
| Category | volatility |
| Default Period | 10 |
| Best Timeframes | H1, H4, D1 |
Most volatility indicators tell you how much a market moved. Chaikin Volatility tells you how fast the battlefield between buyers and sellers is expanding or shrinking — and that distinction matters more than you might think. Developed by Marc Chaikin, a Wall Street veteran who started his career in 1966 and went on to create several industry-standard indicators including the Accumulation/Distribution Line and the Chaikin Oscillator, the Chaikin Volatility (CV) takes a refreshingly simple approach: measure the high-low range, smooth it with an EMA, then calculate how quickly that smoothed range is changing. The result is an oscillator that spikes when markets are waking up and drops when they are falling asleep. Unlike ATR, which gives you an absolute number in pips or points, CV gives you a percentage rate of change — making it naturally adaptive across different instruments and timeframes. This guide breaks down the calculation, shows you how to read those spikes without overreacting, and explains exactly where CV fits into a breakout trader's toolkit.
Key Takeaways
- Marc Chaikin built his career at a time when most traders on Wall Street still relied on fundamental research. He starte...
- The Chaikin Volatility calculation is a two-step process, and both steps matter. Understanding each one helps you diagno...
- The Chaikin Volatility indicator oscillates around zero, and most of its actionable information comes from three pattern...
1Marc Chaikin's Take on Volatility: High-Low Range as the Key
Marc Chaikin built his career at a time when most traders on Wall Street still relied on fundamental research. He started as a broker at Shearson Hammill in the mid-1960s, moved through the options world at Tucker Anthony, traded futures on the New York Futures Exchange, and eventually landed at Drexel Burnham Lambert in the early 1980s. Along the way, he developed a deep conviction that price and volume data contained more actionable information than earnings reports — and he backed that conviction by creating a series of indicators that are now standard on virtually every trading platform in existence.
When Chaikin turned his attention to volatility, he made a philosophical choice that separates his indicator from the competition: he focused exclusively on the high-low range of each bar. Not the close-to-close change. Not the gap from yesterday's close to today's open. Just the raw distance between the highest and lowest price within each period. His reasoning was practical. The high-low range represents the actual territory that buyers and sellers fought over during that bar. It captures intrabar momentum in a way that closing prices alone cannot.
Think about a bar that opens at 1.1000, drops to 1.0950, rallies to 1.1080, and closes at 1.1010. The close-to-close change is a sleepy 10 pips. But the high-low range is 130 pips — revealing a session with enormous internal activity. Chaikin wanted his volatility indicator to capture that reality. A market can close near where it opened and still be experiencing wild volatility within each session. Traditional close-based measures completely miss this.
This focus on the high-low range also means Chaikin Volatility deliberately ignores gaps. If a stock closes at 50 on Friday and opens at 53 on Monday due to weekend news, ATR treats that 3-point gap as part of the true range. Chaikin Volatility does not. It only sees Monday's actual high-low spread. For forex traders, this distinction is mostly academic because currency pairs rarely gap outside of Sunday opens. But for stock and index traders, it is a meaningful design difference. Gap-driven volatility spikes in ATR can persist for several bars as the gap works through the averaging window, sometimes making the market appear more volatile than the current session-to-session action warrants.
Chaikin's philosophy also has implications for how you interpret the indicator across different instruments. Because CV measures the rate of change in the high-low spread rather than an absolute value, it is naturally self-normalizing. A 50-pip average range on EUR/USD and a 500-point average range on the S&P 500 both produce comparable percentage changes when conditions shift. You do not need to adjust the indicator's scale when switching between instruments — something that ATR users constantly deal with.
The simplicity of this approach is its greatest strength and its limitation. By ignoring gaps and focusing only on the high-low range, CV can understate volatility during gap-heavy periods. And by not incorporating volume — despite some sources claiming otherwise — the standard Chaikin Volatility formula is purely price-based. Chaikin's other indicators like the Accumulation/Distribution Line and Chaikin Money Flow do use volume extensively, which sometimes creates confusion. But the Volatility indicator itself works on price alone. This is worth remembering because it means CV tells you about price expansion, not necessarily about conviction behind that expansion.
Ultimately, Chaikin's design decision reflects a trader's priority: he wanted to know whether the market's playing field was getting bigger or smaller, period. Not whether gaps distorted the picture. Not whether volume confirmed the move. Just the raw, observable expansion or contraction of each session's trading range. For traders who share that priority — particularly breakout traders who need to know when ranges are expanding — CV delivers exactly the right information with minimal noise.
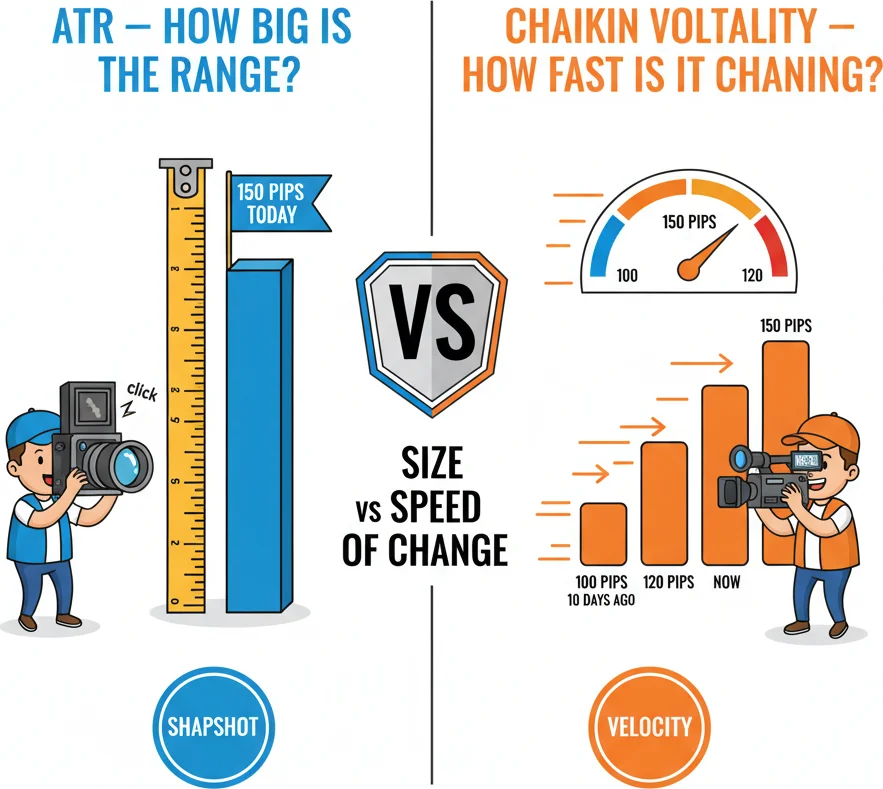
ATR looks at today is range. Chaikin Volatility asks: is that range getting BIGGER or SMALLER vs 10 days ago?
2How Chaikin Volatility Calculates: EMA of Range Change
The Chaikin Volatility calculation is a two-step process, and both steps matter. Understanding each one helps you diagnose those ambiguous situations where the indicator is near zero and you are not sure whether that means calm markets or a storm about to break.
Step 1 — Smooth the high-low range with an EMA
For each bar, calculate the difference between the high and the low price. This gives you the raw range for that period. Then apply an Exponential Moving Average to this series of range values. Chaikin recommended a 10-period EMA as the default, and most platforms use this setting out of the box.
Why an EMA instead of a simple moving average? Because the EMA gives more weight to recent bars. If the last three bars suddenly had much wider ranges than the previous seven, the EMA responds faster than an SMA would. For a volatility indicator, this responsiveness is essential — you want to know that conditions are changing now, not that they changed on average over the last ten bars with equal weighting.
The EMA calculation itself follows the standard formula. The smoothing multiplier is 2 / (period + 1), so for a 10-period EMA it equals 2/11 or approximately 0.1818. Each new bar's range is weighted by this multiplier and added to the previous EMA value multiplied by (1 - multiplier). The result is a smoothed representation of the average high-low spread that reacts relatively quickly to changes.
Step 2 — Calculate the percentage change in the EMA
This is where the indicator gets its actual signal. Take the current EMA value, subtract the EMA value from N periods ago (default: 10 periods), divide by that older EMA value, and multiply by 100.
The formula written out:
CV = [(EMA today - EMA 10 periods ago) / EMA 10 periods ago] x 100
The result is a percentage. If the smoothed range today is 80 pips and it was 60 pips ten bars ago, CV reads +33.3% — the market's trading range has expanded by a third. If the smoothed range has shrunk from 80 to 50, CV reads -37.5% — contraction.
What the zero line means
When CV crosses above zero, the current smoothed range is larger than it was 10 periods ago — the market is expanding. When CV is below zero, the range is contracting. The zero line itself means the range is unchanged compared to 10 bars ago. This seems simple, but traders often misread it. A CV reading of zero does not mean low volatility. It means volatility is the same as it was recently. If the market was already in a high-volatility state, a zero reading just means it is sustaining that state, not calming down.
The double-10 default and why it works
Both the EMA period and the rate-of-change lookback default to 10. This creates a nice symmetry: you are smoothing 10 bars of range data and then measuring how that smoothed value changed over the same 10-bar window. The practical effect is an indicator that responds to shifts within roughly 10-20 bars — fast enough to catch the beginning of a breakout on H1 or H4 charts, but slow enough to avoid whipsawing on every minor range fluctuation.
Some platforms let you set these two parameters independently. You could use a 10-period EMA with a 14-period rate of change, for instance. Lengthening the rate-of-change period makes the indicator smoother but slower. Shortening it makes it more sensitive but noisier. Unless you have a specific reason — like adapting to a very fast scalping timeframe — the matched 10/10 default is a solid starting point.
A practical calculation example
Imagine EUR/USD on the H4 chart. Over the last 10 bars, the high-low ranges were: 45, 52, 48, 60, 55, 42, 38, 50, 62, 70 pips. The 10-period EMA of these values (simplified) might sit around 54 pips. Ten bars ago, the EMA was around 41 pips. CV = (54 - 41) / 41 x 100 = +31.7%. The indicator is telling you that H4 candles are roughly 30% wider than they were 40 hours ago. Something has woken the market up.
Now picture the opposite. Ranges have been compressing: 70, 62, 55, 50, 48, 45, 42, 40, 38, 36 pips. The current EMA might be around 42, the EMA from 10 bars ago was 58. CV = (42 - 58) / 58 x 100 = -27.6%. The market is squeezing. For breakout traders, this is the setup phase — the calm before the potential storm. (And if you have ever sat through a long squeeze waiting for the breakout, you know the keyword there is "potential.")

The EMA smooths out the noise like butter - Marc Chaikin's volatility calculation in action.
“The Chaikin Volatility indicator oscillates around zero, and most of its actionable information comes from three patterns: sharp spikes upward, sustained negative readings, and the transition between the two.”
3Reading Chaikin Volatility Spikes: Expansion and Contraction
The Chaikin Volatility indicator oscillates around zero, and most of its actionable information comes from three patterns: sharp spikes upward, sustained negative readings, and the transition between the two. Learning to read these patterns in context — rather than treating every spike as a signal — is what separates useful application from noise.
Pattern 1 — The expansion spike
When CV jumps sharply above zero, the market's high-low range is growing rapidly compared to recent history. This happens at the start of major moves, during news events, and at breakouts from consolidation zones. The spike itself does not tell you direction — CV can surge whether price is breaking out upward or crashing downward. What it tells you is that the market has transitioned from a quiet state to an active one.
The practical question is always: how high is high enough to matter? There is no universal threshold because the indicator adapts to the instrument's baseline volatility. On EUR/USD H4, a CV reading of +30% to +40% typically indicates a meaningful expansion. On GBP/JPY, which naturally has wider ranges, a similar level of significance might require +50% or more. The best approach is to observe your specific instrument for a few weeks and note where CV spikes during moves you consider significant. That gives you a personal threshold calibrated to your market.
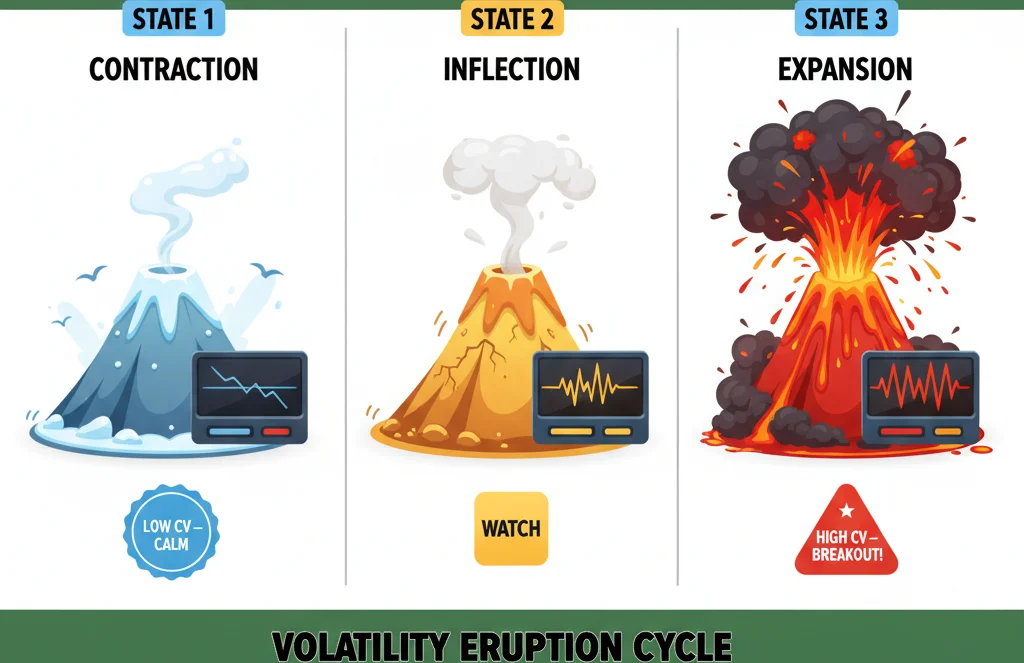
Pattern 2 — The contraction phase
When CV drops well below zero and stays there, the high-low range is compressing. Bars are getting smaller, price is going nowhere, and the market looks like it has fallen asleep. This is the classic pre-breakout environment. Volatility is cyclical — periods of compression reliably precede periods of expansion, though the timing of the transition is impossible to predict with precision.
A common rookie mistake is treating contraction as a signal to stand aside entirely. Smart traders use contraction phases to prepare. They identify the consolidation range, set alerts for price breaks above or below the boundaries, and size their positions knowing that the upcoming expansion will likely offer favorable risk-to-reward ratios. The Chaikin Volatility indicator quantifies what you can often see on the chart — that ranges are shrinking — but it does so objectively and catches compression that you might not notice visually, especially on lower timeframes where bar-to-bar range changes are subtle.
Pattern 3 — The zero-line crossover
When CV crosses from negative to positive territory, it means the smoothed range has stopped contracting and started expanding. This transition is the single most useful signal the indicator produces for breakout traders. It does not tell you which direction to trade, but it tells you that the quiet period is ending. Combined with a price breakout above resistance or below support, the negative-to-positive CV crossover adds a volatility confirmation layer that pure price action alone does not provide.
The reverse crossover — positive to negative — signals that expansion is fading. This often coincides with the end of a trending move, as the market's range compresses back toward normal after a burst of activity. For traders already in a position, a positive-to-negative crossover is a warning that the easy part of the move may be over. It does not necessarily mean to exit immediately, but it does suggest tightening stops or taking partial profits.
Context matters: tops versus bottoms
Chaikin himself noted a useful asymmetry in how volatility behaves at market tops versus bottoms. Market tops tend to feature short, sharp volatility spikes — CV shoots up quickly as nervous traders create wide-range bars in both directions. This reflects indecision and emotional trading near highs. Market bottoms, on the other hand, tend to feature prolonged contraction followed by a sudden expansion spike as capitulation selling creates one final wide-range bar before buyers step in.
The practical implication is that the shape of the CV pattern matters as much as the level. A series of rapid, choppy CV spikes near a high suggests a potential topping process. A long, steady decline in CV followed by a single sharp upward spike near a low suggests potential capitulation. Neither pattern is a guaranteed reversal signal, but both add context that pure price analysis may not reveal.
What CV does not tell you
One limitation worth emphasizing: Chaikin Volatility says nothing about direction. A +40% reading could accompany a powerful bullish breakout or a crash. The indicator measures the size of the playground, not which team is winning. This is why CV works best as a confirmation tool rather than a standalone signal generator. Pair it with trend direction indicators, support/resistance levels, or momentum oscillators to determine which way the expansion is likely to resolve. Using CV alone to trade is like checking the weather for wind speed but not wind direction before setting sail.
A spike in Chaikin Volatility means ranges are expanding fast. A plunge means the market is cooling down.
4Using Chaikin Volatility as a Breakout Confirmation Tool
Breakout trading has an uncomfortable failure rate. Studies across various markets consistently show that a large proportion of breakouts fail — price punches through a level, triggers entries, then reverses back into the range. Chaikin Volatility does not eliminate false breakouts, but it provides a volatility confirmation layer that helps filter out the weakest ones.
The core logic: real breakouts come with expanding ranges
When a genuine breakout occurs, the market transitions from a compressed, low-volatility state to an expanding, high-volatility state. The candles get physically bigger. The high-low range increases. This is not a theory — it is an observable characteristic of successful breakouts. Failed breakouts, by contrast, often occur on normal-sized or even below-average candles. Price pokes above resistance by a few pips, but the bar that does the breaking is no wider than the bars inside the range. There is no expansion.
Chaikin Volatility quantifies this distinction. A breakout accompanied by CV crossing from negative to positive territory — or already in positive territory and rising — has the volatility signature of a genuine move. A breakout where CV remains flat or negative lacks that signature and deserves extra skepticism.
A practical breakout confirmation framework
Here is a concrete approach that combines price action with CV confirmation on H1 or H4 charts:
-
Identify a clear consolidation zone. Price must have bounced between support and resistance at least three times, creating a defined range. The more touches, the more significant the eventual breakout.
-
Watch CV during the consolidation. It should be declining or sitting in negative territory, confirming that ranges are compressing. If CV is already elevated, the consolidation may not be mature enough — the market has not fully coiled yet.
-
When price breaks above resistance (or below support), check CV. The breakout bar or the bar immediately following it should push CV above zero or show a sharp uptick from negative readings. This confirms that the breakout came with genuine range expansion.
-
Enter the trade on the breakout if CV confirms. Place your stop-loss inside the consolidation range — typically below the midpoint of the range for a bullish breakout, or below the most recent swing low within the range.
-
Monitor CV after entry. As long as CV remains positive or rising, the expansion is sustaining and the trade is working. When CV peaks and starts declining, the expansion phase is maturing. This is when you trail your stop aggressively or take partial profits.
Combining CV with Bollinger Band squeezes
Bollinger Bands visually show volatility compression through band narrowing, but they use standard deviation of closing prices — a different measure than CV's high-low range approach. The combination is powerful because they capture volatility from two different angles. When Bollinger Bands are in a squeeze AND Chaikin Volatility is deeply negative, you have dual confirmation that the market is in a compressed state. A breakout from this dual-squeeze condition tends to be more powerful than a breakout from just one condition alone.
The entry trigger remains the same: wait for price to break the range boundary, then verify that CV is crossing above zero or spiking upward. The Bollinger Band expansion provides a secondary visual confirmation that the breakout has legs.
When CV says "wait"
Sometimes a price breakout occurs but CV remains flat or negative. This is the indicator telling you that despite the price move, ranges are not actually expanding. The breakout bar might have closed beyond resistance, but its high-low range was unremarkable. These situations deserve patience. Either wait for the next bar to show range expansion (CV turning positive), or skip the trade entirely. Many failed breakouts share this characteristic — the initial break lacks the volatility expansion that sustains continuation.
Of course, some genuine breakouts start slowly and build momentum over two or three bars rather than exploding immediately. Missing the first bar is acceptable if CV confirms on the second. Your entry is slightly worse, but the probability of a genuine move is higher. Trading is always a tradeoff between price and confidence — CV helps you lean toward confidence when the stakes matter.
Timeframe considerations
Breakout confirmation with CV works best on H1, H4, and D1 charts. On M15 and below, the 10-period lookback covers so little time that the rate-of-change calculation becomes noisy. A single wide bar can spike CV dramatically, and a single narrow bar can crash it, producing misleading readings. If you trade breakouts on M15, consider lengthening the EMA period to 14 or 20 to smooth out the noise. On D1 charts, the default 10-period setting captures roughly two weeks of range data — a natural rhythm for daily chart breakout setups.

When Chaikin Volatility spikes confirm your breakout - that's your green light to enter!
“Chaikin Volatility and Average True Range are both volatility indicators, and traders often assume they are interchangeable.”
5Chaikin Volatility vs ATR: Two Different Volatility Philosophies
Chaikin Volatility and Average True Range are both volatility indicators, and traders often assume they are interchangeable. They are not. They measure different things, present results differently, and suit different trading decisions. Understanding the distinction helps you pick the right tool — or use both without redundancy.
What each one actually measures
ATR, developed by J. Welles Wilder in 1978, calculates the average of the True Range over N periods. True Range includes three components: the current high minus the current low, the absolute difference between the current high and the previous close, and the absolute difference between the current low and the previous close. The largest of these three values is the True Range for that bar. ATR then averages this value, typically over 14 periods.
Chaikin Volatility measures the rate of change of the smoothed high-low range. It uses only the first component of True Range — the high-low spread — ignores the gap-related components entirely, smooths the result with an EMA, and then calculates the percentage change over a lookback period.
Output format: absolute versus relative
ATR gives you an absolute number in the instrument's price units. An ATR of 75 on EUR/USD means the average true range is 75 pips. This number is directly usable for setting stop-losses, calculating position sizes, and defining risk in monetary terms. You can plug ATR straight into a risk management formula.
Chaikin Volatility gives you a percentage. A CV reading of +25% means ranges are 25% wider than they were N periods ago. You cannot use this directly for position sizing or stop placement. CV answers a different question: not "how much does this market move?" but "is this market moving more or less than it was recently?" That is a rate-of-change question, not a level question.
Gaps: the defining philosophical split
This is the biggest practical difference. ATR accounts for gaps because the True Range formula includes the distance from the previous close to the current high or low. A stock that closed at 100 and opens at 105 with a high of 106 and low of 104 has a True Range of 6 (106 minus the previous close of 100), not 2 (the high-low range of 106 minus 104). ATR captures the full extent of the move, including the overnight gap.
Chaikin Volatility sees only the 2-point high-low range during the session. The gap is invisible to it. For forex traders, this difference is minimal because gaps are rare. But for stock traders, it is significant. After earnings announcements, ATR will spike to reflect the gap, while CV only responds if the session's high-low range itself expanded. Both are valid — they just answer different questions.
Responsiveness and signal character
CV tends to be more responsive to sudden range changes because it measures percentage change rather than averaging absolute values. When a market transitions from tight ranges to wide ranges, CV spikes sharply — the percentage change from 30 pips to 60 pips is +100%, which produces a dramatic visual signal. ATR registers the same event more gradually because it averages the new wider bars with the older narrower ones over 14 periods. This makes CV better for detecting the onset of expansion, while ATR is better for understanding the current average volatility level.
When to use which
For stop-losses and position sizing, ATR wins — those calculations need absolute pip values, and ATR delivers them directly. For detecting breakout onset, CV has the edge because its percentage change catches expansion earlier and more dramatically. For comparing volatility across different instruments, CV's percentage output is naturally normalized — no need to mentally adjust between EUR/USD's 50-pip range and the S&P's 50-point range. For trailing stops, ATR-based methods like Chandelier exits are purpose-built. For identifying when a quiet market is waking up, CV's zero-line crossover is cleaner and more intuitive.
Using both together without redundancy
The ideal setup uses ATR for operational decisions (where to place stops, how large to size positions) and CV for analytical decisions (is volatility expanding or contracting, should I expect a breakout). This avoids the mistake of stacking two indicators that tell you the same thing. ATR and CV answer genuinely different questions, so running both adds information rather than redundancy.
A practical workflow: scan for instruments where CV has been deeply negative for at least 10 bars (prolonged compression). These are your breakout watchlist candidates. When price approaches a key level, check ATR to calculate your stop distance and position size. Enter the trade if price breaks the level and CV confirms with a move above zero. Manage the trade with ATR-based trailing stops. Each indicator does what it does best, and neither is asked to do something it was not designed for. (The best mechanics do not use one wrench for every bolt — and the best traders do not use one indicator for every question.)
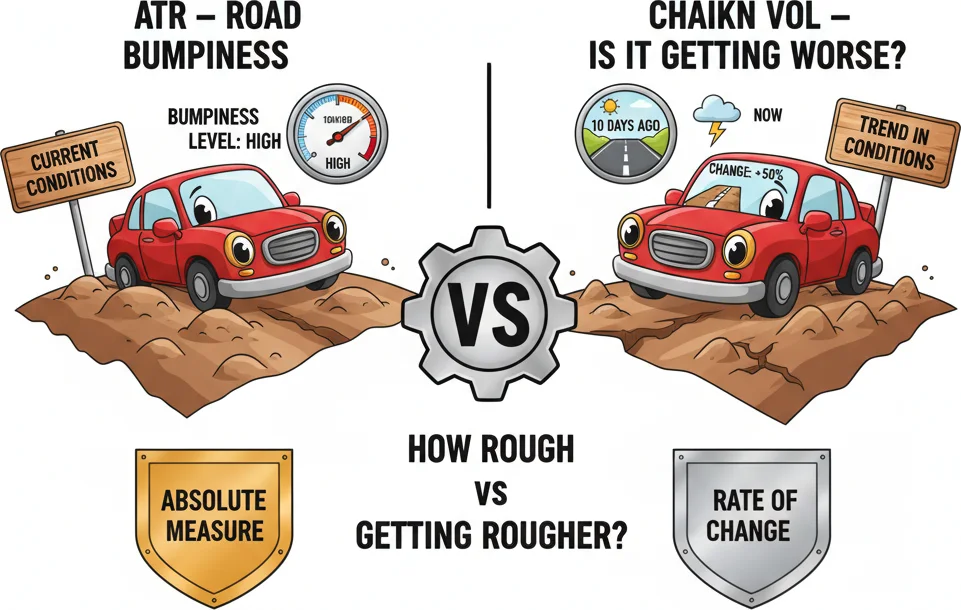
ATR tells you how bumpy the road is. Chaikin tells you if it is getting bumpier or smoother.
Frequently Asked Questions
Q1What is the Chaikin Volatility indicator and who created it?
The Chaikin Volatility (CV) indicator was created by Marc Chaikin, a Wall Street veteran who began his career in the 1960s and went on to develop several widely used indicators including the Accumulation/Distribution Line and the Chaikin Oscillator. The CV measures how quickly the high-low trading range is expanding or contracting by calculating the percentage change of an exponential moving average of the high-low spread. It oscillates around zero, with positive readings indicating expanding ranges and negative readings indicating compression.
Q2How is the Chaikin Volatility calculated?
The calculation has two steps. First, compute the high-low range for each bar and apply a 10-period Exponential Moving Average (EMA) to smooth it. Second, calculate the percentage change of that EMA compared to its value 10 periods ago using the formula: CV = [(Current EMA - EMA 10 periods ago) / EMA 10 periods ago] x 100. The result is a percentage that tells you how much the smoothed range has expanded or contracted relative to where it was 10 bars ago.
Q3What is the difference between Chaikin Volatility and ATR?
The two key differences are measurement scope and output format. ATR uses True Range, which accounts for gaps between the previous close and the current bar, and outputs an absolute value in pips or points — useful for setting stops and sizing positions. Chaikin Volatility uses only the high-low range within each bar, ignores gaps entirely, and outputs a percentage rate of change — better for detecting when volatility is expanding or contracting. In forex, the gap difference is minimal, but the output format makes each tool suited for different tasks: ATR for risk management, CV for regime detection.
Q4What are the best settings and timeframes for Chaikin Volatility?
The default settings are a 10-period EMA and a 10-period rate-of-change lookback, and they work well on H1, H4, and D1 charts. On H1, some traders shorten to 7/7 for more responsiveness during active sessions. On D1 and above, the defaults capture roughly two weeks of range data, which aligns well with typical consolidation-to-breakout cycles. Avoid using CV on timeframes below M15 with default settings, as single bars can cause misleading spikes. If you must use it on lower timeframes, increase the EMA period to 14 or 20 to smooth out the noise.
Q5Can Chaikin Volatility predict the direction of a breakout?
No. Chaikin Volatility measures range expansion and contraction, not price direction. A rising CV reading tells you the market is becoming more active, but it cannot tell you whether price will break up or down. This is why CV works best as a confirmation tool paired with directional analysis — trend indicators, support and resistance levels, or momentum oscillators. When price breaks a key level and CV simultaneously crosses above zero, the combination of directional signal plus volatility confirmation produces a higher-probability setup than either signal alone.
Top Brokers
About the Author
Daniel Harrington
Senior Trading Analyst
Daniel Harrington is a Senior Trading Analyst with a MScF (Master of Science in Finance) specializing in quantitative asset and risk management. With over 12 years of experience in forex and derivatives markets, he covers MT5 platform optimization, algorithmic trading strategies, and practical insights for retail traders.
Use This Indicator
Risk Disclaimer
Trading financial instruments carries significant risk and may not be suitable for all investors. Past performance does not guarantee future results. This content is for educational purposes only and should not be considered investment advice. Always conduct your own research before trading.