Cup and Handle Pattern: Trading Guide & Signals
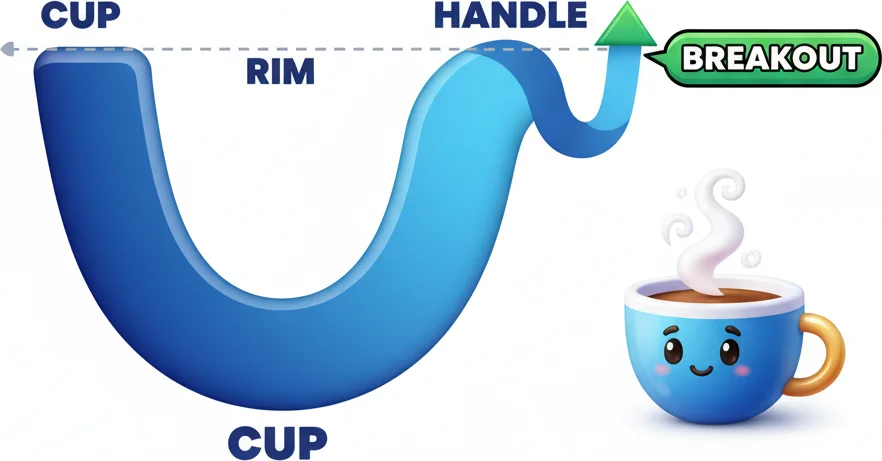
Cup and Handle is a bullish continuation pattern where a rounded bottom (cup) is followed by a small downward drift (handle) before a breakout to new highs.

Daniel Harrington
Senior Trading Analyst · MT5 Specialist
☕ 8 min read
Settings — C&H
| Category | chart-pattern |
| Default Period | null |
| Best Timeframes | H4, D1, W1 |
The Cup and Handle pattern has produced some of the most reliable breakout signals in technical analysis since William O'Neil formally documented it in 1988. Shaped by a rounded price base followed by a brief consolidation drift, the pattern signals that buyers have absorbed selling pressure and are ready to push prices to new highs. Understanding its mechanics separates traders who catch genuine breakouts from those who enter on false moves.
Key Takeaways
- The Cup and Handle is a two-phase structure measured against a prior uptrend. The cup portion forms when price declines ...
- The primary buy signal triggers when price closes above the cup's right rim — the pivot point — on elevated volume. This...
- Counterintuitively, shorter timeframes produce more Cup and Handle signals but far fewer reliable ones. The pattern perf...
1How the Cup and Handle Pattern Works (The Math, Simplified)
The Cup and Handle is a two-phase structure measured against a prior uptrend. The cup portion forms when price declines from a recent peak, rounds out over an extended period — typically 7 to 65 weeks on daily charts — and recovers to near the original high. The rounding shape matters: a V-shaped base is generally considered less reliable because it suggests panic selling rather than orderly accumulation. The handle then forms as a shallow pullback, ideally no deeper than 10–15% from the cup's right rim, drifting downward on declining volume. Volume is the mathematical backbone here. According to O'Neil's original research, volume should contract through most of the cup and handle formation, then surge at least 40–50% above the 50-day average on the breakout candle. The default lookback parameter of 100 bars captures enough price history to identify the full cup structure without introducing noise from older, irrelevant price action. On a D1 chart, 100 bars represents roughly five months of data — sufficient to validate the pattern's symmetry and depth. Depth is another measurable factor. Cups that retrace 12–33% from the prior high are statistically more productive than those retracing more than 50%, according to research published in technical analysis literature. Deeper cups often indicate distribution rather than accumulation.
The name says it all — a rounded bottom shaped like a teacup, with a small dip forming the handle before breakout.
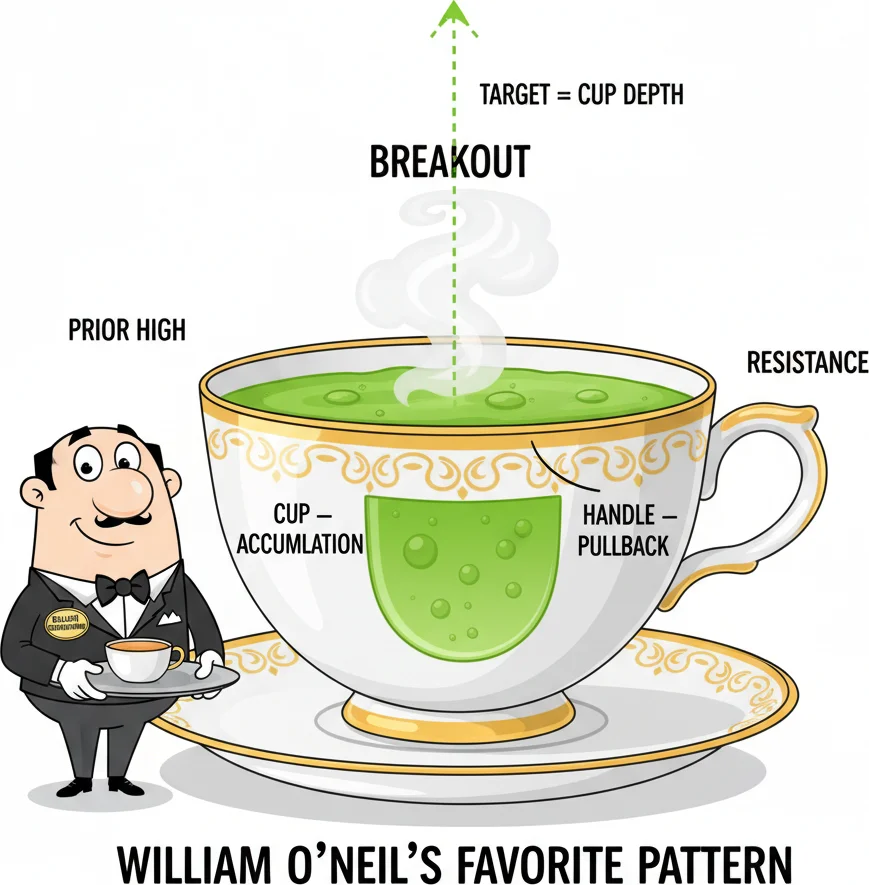
2Cup and Handle Signal Interpretation: Entries, Exits, and False Breakouts
The primary buy signal triggers when price closes above the cup's right rim — the pivot point — on elevated volume. This breakout level acts as the trade entry, and the measured price target is calculated by adding the cup's depth to the breakout point. For example: if a stock forms a cup with a low of $85 and a right rim at $100, the cup depth is $15, projecting a target of $115. The handle's low provides the natural stop-loss anchor. A close below the handle's lowest point invalidates the pattern, suggesting the breakout has failed. This gives the trade a defined risk structure before entry. False breakouts are the pattern's most common failure mode. Price briefly clears the pivot, then reverses — often when volume on the breakout bar is below average. Research from Thomas Bulkowski's pattern performance studies indicates Cup and Handle patterns have a failure rate of approximately 5% when volume confirms the breakout, rising sharply when volume is absent. There is no traditional bearish signal from this pattern. The Cup and Handle is a continuation structure, not a reversal tool. Attempting to short a failed Cup and Handle requires confirmation from separate bearish signals rather than the pattern itself. Pulsar Terminal's multi-level SL/TP tools allow traders to set the handle low as a stop and the measured target as a take-profit directly on the MetaTrader 5 chart, streamlining execution at the moment of breakout.

When the cup handle breaks out... just kidding, it's a fakeout!
“Counterintuitively, shorter timeframes produce more Cup and Handle signals but far fewer reliable ones.”
3Optimal Timeframe Settings: H4, D1, and W1 Compared
Counterintuitively, shorter timeframes produce more Cup and Handle signals but far fewer reliable ones. The pattern performs best when it has room to breathe across weeks or months rather than hours. On the H4 chart, the 100-bar lookback covers approximately 17 trading days. Patterns form quickly, but they are susceptible to intraday noise, news events, and liquidity gaps. H4 setups are most useful in forex markets during defined sessions, where volume data is more consistent. The D1 timeframe is widely considered the standard for this pattern. One hundred daily bars spans roughly five months, capturing medium-term institutional accumulation cycles. Breakouts on D1 charts tend to produce moves lasting several weeks, giving traders time to manage positions. The W1 chart extends the lookback to nearly two years of weekly data. These patterns are rarer — perhaps only a handful appear on any given instrument per year — but the breakout moves they generate are proportionally larger. Swing traders and position traders targeting 20–30% moves favor W1 setups. Across all timeframes, the handle should not exceed one-fifth of the cup's duration. A cup that took 60 days to form should produce a handle no longer than 12 days. Handles that drag on too long often signal indecision rather than controlled consolidation.
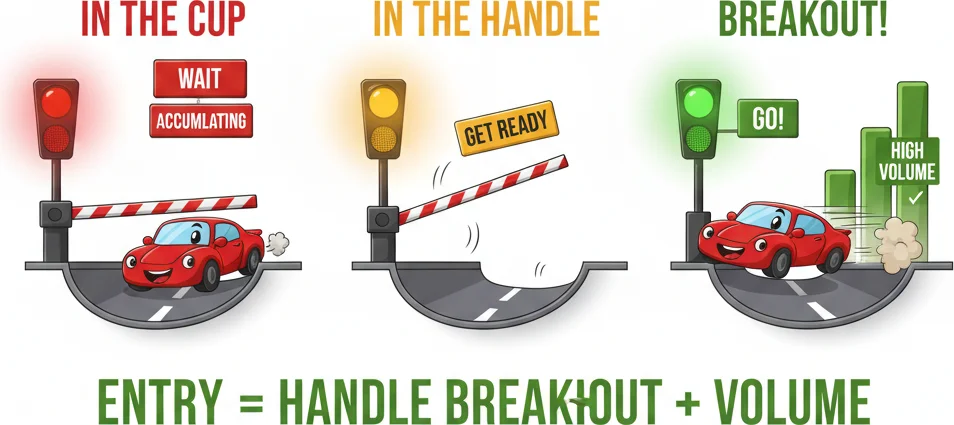
The entry is not inside the cup. It is not in the handle. It is the exact moment price clears the handle top on volume.
4Practical Application: A Real-World Cup and Handle Trade Setup
Apple Inc. (AAPL) formed a textbook Cup and Handle on the weekly chart between June 2023 and January 2024. Price peaked near $198 in July 2023, pulled back to approximately $165 — a 17% retracement — rounded out through October, and recovered to the prior high by December 2023. A shallow handle formed through late December, holding above the $190 level before breaking out in January 2024 on above-average volume. The measured move target from the $33 cup depth projected to approximately $231, a level AAPL reached by March 2024. The stop placement below the handle low at $186 represented a risk of roughly 2–3% from the breakout entry near $198. Risk-reward on the setup was approximately 1:5 before fees. For practical execution, the pattern requires monitoring three variables simultaneously: price relative to the pivot, volume on the breakout candle, and the handle's structural integrity. Traders using automated alerts on MetaTrader 5 can configure price-level notifications at the pivot point, reducing the need for constant chart monitoring. The pattern also pairs well with relative strength analysis — breakouts occurring while the instrument outperforms its sector benchmark historically show higher follow-through rates, according to momentum research published by Fidelity Investments in 2021.

Your cup and handle setup firing all the right signals for entry.
“William O'Neil's original description of the Cup and Handle focused on stocks on weekly charts.”
5Cup and Handle Variations: What the Textbook Doesn't Cover
William O'Neil's original description of the Cup and Handle focused on stocks on weekly charts. Applying it across different markets and timeframes introduces variations that the textbook doesn't always address — and understanding them prevents you from dismissing valid setups or, worse, trading invalid ones.
The high-handle variation is common in strong trending markets. Instead of the handle dipping 10-15% from the cup's rim, it only pulls back 3-5% before breaking out. This happens when buying pressure is so strong that sellers can barely create a pullback at all. These patterns are actually among the most bullish — the shallow handle indicates that no one wants to sell, even at prior resistance. The tradeoff is tighter stops (smaller handle = less room for a stop below the handle low), which means smaller position sizes for the same dollar risk.
The multi-handle pattern appears when the first handle breakout fails and price forms a second, slightly deeper handle. This is not necessarily bearish. If the second handle holds above the cup's midpoint and volume remains controlled, the pattern is still constructive. The second handle often shakes out impatient traders who entered on the first attempt, creating a cleaner move on the eventual breakout. However, a third handle attempt almost always signals that the pattern has failed — three failed breakouts mean sellers are too strong at that level.
The intraday Cup and Handle (H1 or H4) is controversial. O'Neil explicitly designed the pattern for weekly charts, and many purists argue it doesn't work on shorter timeframes. The reality is more nuanced: H4 Cup and Handle patterns on liquid instruments (EUR/USD, Gold, S&P 500 futures) can produce valid signals, but the measured move targets are proportionally smaller and the false breakout rate is higher. On H1 and below, the pattern's reliability degrades significantly because the 'accumulation' phase that defines the cup becomes too short to represent genuine institutional positioning.
On forex specifically, the Cup and Handle works best on D1 charts with pairs that exhibit trending behavior — USD/JPY, GBP/USD, and commodity-linked pairs like AUD/USD and USD/CAD. Range-bound pairs like EUR/CHF rarely produce valid Cup and Handle setups because they lack the sustained directional pressure needed to form the cup's rounded base.
One often-overlooked detail: the cup should be U-shaped, not V-shaped. A V-shaped base means price fell hard and bounced hard — that's a panic selloff followed by a relief rally, which has different structural implications than the gradual, rounded base that signals steady accumulation over weeks or months. V-shaped recoveries can precede valid breakouts, but they're structurally different from the classic Cup and Handle and should be evaluated with additional confirmation.
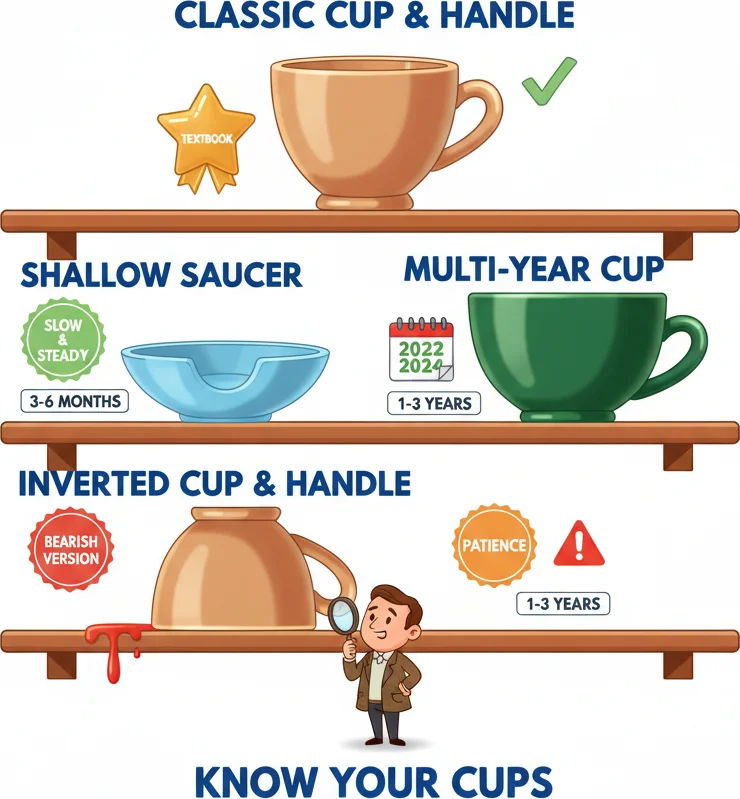
Not every cup looks like a textbook picture. Some are shallow saucers, some take years, and some are upside down.
Frequently Asked Questions
Q1How long does a Cup and Handle pattern take to form?
On daily charts, the cup portion typically takes 7 to 65 weeks to form, with the handle adding another 1 to 5 weeks. The total formation period ranges from roughly 2 months to over a year. Shorter cups (under 6 weeks) tend to be less reliable because they don't allow enough time for genuine institutional accumulation. The handle should not exceed one-fifth of the cup's duration — a cup that took 60 days should produce a handle no longer than 12 days. Handles that drag on too long indicate indecision rather than controlled consolidation.
Q2What makes a Cup and Handle different from a Double Bottom?
The key difference is shape and context. A Double Bottom has a V-shaped or angular base with two distinct low points at roughly the same level. A Cup and Handle has a rounded, U-shaped base that reflects gradual accumulation rather than two sharp tests of support. Additionally, the Cup and Handle includes a handle phase — a controlled pullback after the cup completes — which provides the actual entry trigger. The Double Bottom's entry triggers on the neckline break between the two lows, without requiring a handle formation. Both are bullish patterns, but they form under different market dynamics.
Q3Does volume really matter for the Cup and Handle pattern?
Volume is arguably the most critical confirmation factor. According to O'Neil's original research, volume should contract throughout most of the cup and handle formation as sellers exhaust themselves, then surge at least 40-50% above the 50-day average on the breakout candle. Without this volume expansion, the breakout failure rate increases dramatically. Bulkowski's studies show that Cup and Handle patterns with volume-confirmed breakouts have a failure rate of approximately 5%, rising sharply when volume is absent. On forex with tick volume, apply the same principle — a noticeable spike in tick count on the breakout bar validates the signal.
Q4How deep should the cup be for the pattern to be valid?
O'Neil's guidelines suggest the cup should retrace 12% to 33% from the prior high for the strongest setups. Cups retracing less than 12% may not represent genuine accumulation — the selloff wasn't deep enough to transfer shares from weak hands to strong hands. Cups retracing more than 50% often indicate distribution rather than accumulation, and the subsequent breakout is less likely to follow through. On forex pairs, translate these percentages to the instrument's typical swing range — a 12-33% retracement on EUR/USD daily translates to roughly 200-600 pips depending on the prevailing price level and volatility environment.
Q5Can you trade a Cup and Handle short (bearishly)?
Not with the pattern itself. The Cup and Handle is a bullish continuation pattern — there is no standard bearish version. If a Cup and Handle breakout fails (price clears the pivot, then reverses back below the handle low), that failure can be traded as a short, but you'd be trading the breakout failure, not the pattern. Some traders reference an 'Inverted Cup and Handle' as a bearish setup, but this isn't part of O'Neil's original work and has significantly less research backing its reliability. For bearish reversal setups, other patterns like Head and Shoulders or Double Tops are more appropriate tools.
Top Brokers
About the Author
Daniel Harrington
Senior Trading Analyst
Daniel Harrington is a Senior Trading Analyst with a MScF (Master of Science in Finance) specializing in quantitative asset and risk management. With over 12 years of experience in forex and derivatives markets, he covers MT5 platform optimization, algorithmic trading strategies, and practical insights for retail traders.
Use This Indicator
Risk Disclaimer
Trading financial instruments carries significant risk and may not be suitable for all investors. Past performance does not guarantee future results. This content is for educational purposes only and should not be considered investment advice. Always conduct your own research before trading.