Demand Index Indicator: James Sibbet's Supply & Demand Volume Tool
Demand Index combines price and volume data to identify buying and selling pressure, with positive values indicating demand exceeding supply.

Daniel Harrington
Senior Trading Analyst · MT5 Specialist
☕ 16 min read
Settings — DI
| Category | volume |
| Default Period | null |
| Best Timeframes | H1, H4, D1 |
Back in 1981, a technical analyst named James Sibbet had a simple but powerful idea: what if you could measure the actual tug-of-war between buyers and sellers by combining price movement with volume into a single line? The result was the Demand Index — an indicator that attempts to quantify whether demand or supply is winning at any given moment. Unlike most oscillators that only look at price, the DI weighs how much conviction is behind each move by factoring in volume. The output is a line oscillating around zero: positive means buyers are in control, negative means sellers are running the show. It sounds straightforward, and the core concept is. But the details — particularly Sibbet's six original trading rules and the divergence signals this indicator produces — are what make the Demand Index genuinely useful on H4 and D1 charts for traders who want to see beyond price alone.
Key Takeaways
- James Sibbet introduced the Demand Index in 1981 with a premise that remains relevant over four decades later: price mov...
- The Demand Index formula is more involved than most oscillator calculations, which is partly why it flew under the radar...
- The zero line is the Demand Index's most important structural feature — and also the one that trips up the most traders ...
1James Sibbet's Supply-Demand Framework for Technical Analysis
James Sibbet introduced the Demand Index in 1981 with a premise that remains relevant over four decades later: price movement without volume context is only half the story. A 2% rally might look identical on two different days, but if one rally occurs on triple the normal volume and the other on a fraction of it, the market is telling you very different things about conviction and sustainability.
Sibbet's framework sits within a broader school of thought — volume analysis — that stretches back to the early 20th century work of Richard Wyckoff. Where Wyckoff developed an entire methodology around reading volume bars and price action together, Sibbet distilled the concept into a single mathematical formula that could be plotted as an indicator line. Think of the Demand Index as Wyckoff's principles compressed into an oscillator you can add to any chart in two clicks.
The core philosophy is that markets are driven by supply and demand, and volume is the best available proxy for the intensity of that supply and demand at any price level. When buyers are aggressive, they absorb available supply at higher and higher prices — and they do so on increasing volume. When sellers are in control, volume expands on down moves as positions are liquidated and shorts pile in. The Demand Index captures this dynamic by computing separate measures of buying pressure and selling pressure, then expressing the ratio as a single value.
Sibbet published six original rules for interpreting the indicator, and they remain the foundation that most traders reference today:
| Rule | Signal | Interpretation |
|---|---|---|
| 1 | DI diverges from price direction | Bearish warning — momentum isn't confirming the move |
| 2 | Extreme DI peak followed by new price highs | Bullish — strong demand drove the peak, and follow-through is likely |
| 3 | Higher prices with low DI readings | Potential market top — price is climbing without volume support |
| 4 | DI crosses the zero line | Trend change — the balance of power has shifted |
| 5 | DI stays near zero | Weak, indecisive price action that probably won't last |
| 6 | Long-term DI divergence from price | Major top or bottom forming — the biggest signals the indicator produces |
These rules aren't predictions in isolation — they're conditional statements. Rule 3, for instance, doesn't say "sell now." It says the structural conditions for a top are present. Whether you act on that depends on what the rest of your analysis says. This is an important distinction that separates useful application from mechanical over-reliance.
The historical context matters here too. Sibbet developed the Demand Index during an era when technical analysis was predominantly used in commodity futures and stock markets, where exchange-reported volume was available and reliable. The indicator was designed for environments with genuine volume data — a detail that becomes relevant when we discuss applying it to modern forex markets, where tick volume serves as a proxy rather than a true measure of transaction size.
One thing Sibbet got right that many indicator creators missed: he didn't clutter the tool with adjustable parameters. The Demand Index has no user-configurable lookback period, no smoothing factor to tweak. It is what it is. While some traders view this as a limitation (you can't optimize it for a specific instrument), it's actually a strength — there's no temptation to curve-fit the settings to past data, which is the silent killer of many trading strategies.
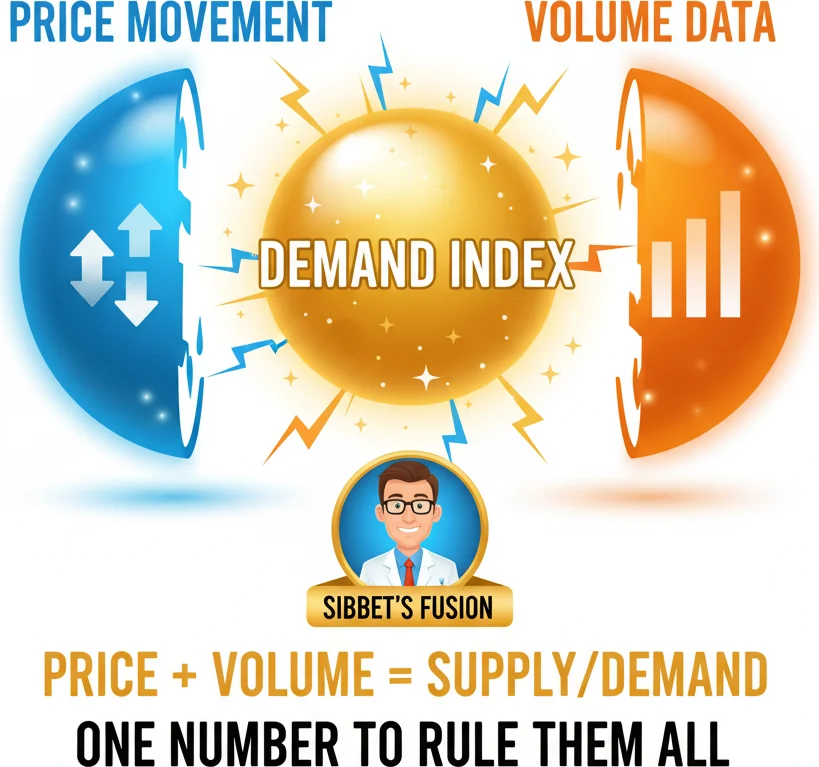
Most indicators look at price OR volume. Sibbet is Demand Index smashes both together into a single number.
2How Demand Index Combines Price Movement and Volume
The Demand Index formula is more involved than most oscillator calculations, which is partly why it flew under the radar compared to simpler tools like RSI or MACD. But you don't need to implement it from scratch to understand what it's doing — and understanding the logic will make you a better reader of its signals.
At a high level, the calculation works in three stages:
Stage 1: Compute a weighted price. The indicator takes each bar's High, Low, and Close to calculate a typical price value. It then measures the range by looking at the highest high and lowest low over the last two periods. This range component captures volatility — the DI is sensitive to how much price is actually moving, not just where it closes.
Stage 2: Calculate Buy Power and Sell Power separately. This is where things get interesting. The formula compares current volume against an exponential moving average of volume. If volume is above its average — a sign of unusual activity — the buy or sell power gets amplified. Price direction determines which side gets the credit: if price moved up, the buy power calculation benefits; if price moved down, selling pressure increases.
The math uses an exponential function that adjusts based on how much price moved relative to the recent range. A small price move on heavy volume produces a different reading than a large price move on light volume. The formula essentially asks: "Is price moving because of genuine participation, or is it drifting on thin air?"
Stage 3: Compute the ratio and normalize. The final Demand Index value is derived from the ratio of sell power to buy power. If buy power exceeds sell power, the DI is positive (output = 100 × (1 - ratio)). If sell power exceeds buy power, the DI is negative (output = 100 × (ratio - 1)). The result can range from -100 to +100, though in practice readings beyond +/-50 are uncommon outside of major news events.
| DI Reading | What It Means | Market Context |
|---|---|---|
| +30 to +100 | Very strong buying pressure | Breakout, trend acceleration, news-driven surge |
| +10 to +30 | Moderate buying pressure | Healthy uptrend with volume support |
| 0 to +10 | Slight buying edge | Mild demand, possible consolidation |
| 0 to -10 | Slight selling edge | Mild supply pressure, possible drift |
| -10 to -30 | Moderate selling pressure | Established downtrend with volume confirmation |
| -30 to -100 | Very strong selling pressure | Capitulation, panic selling, heavy distribution |
Here's the practical takeaway: the Demand Index is doing something that would take you several minutes of manual analysis on every bar — comparing price direction, price magnitude, volume level, and volume trend — and compressing all of it into a single number. It's a workload reduction tool as much as it is a signal generator.
One important nuance: the DI uses exponential smoothing internally, which means it reacts faster to recent changes than a simple moving average would. This makes it relatively responsive — a sudden volume spike will show up in the DI quickly rather than being averaged away over 14 or 20 periods. That responsiveness is a double-edged sword: it catches genuine shifts early but also picks up noise during volatile, choppy sessions. On H4 and D1 charts, this responsiveness is an asset. On M15, it can generate more head-fakes than actionable signals.
If you want to see the full mathematical notation, the Sierra Chart documentation provides the most complete technical reference available online. But honestly, unless you're programming the indicator from scratch, understanding the three-stage logic above is sufficient for intelligent interpretation.
“The zero line is the Demand Index's most important structural feature — and also the one that trips up the most traders when they use it mechanically.”
3Demand Index Zero-Line: Buyers vs Sellers in Control
The zero line is the Demand Index's most important structural feature — and also the one that trips up the most traders when they use it mechanically.
The concept is clean: when the DI is above zero, buying pressure exceeds selling pressure. When it's below zero, sellers have the upper hand. A crossing from one side to the other signals a shift in the balance of power. In theory, you could build a system that simply goes long on a cross above zero and short on a cross below.
In practice, you'd get eaten alive by false signals on lower timeframes. So let's break down what actually matters.
Decisive crosses vs. noise. The DI doesn't need to delicately tiptoe across zero for the signal to count. In fact, readings that hover between -3 and +3, wobbling back and forth across the zero line, are telling you something important: neither side has conviction. Rule 5 from Sibbet's original framework covers exactly this — DI near zero means weak, directionless price action. Don't trade it. Wait.
What you're looking for is a decisive cross: the DI line jumps through zero with visible momentum, moving from, say, -12 to +8 in one or two bars. That kind of thrust indicates that volume-weighted pressure has genuinely shifted. The bigger the jump through zero, the more significant the signal.
| Zero-Line Behavior | What It Suggests | Trading Implication |
|---|---|---|
| Sharp cross from negative to positive | Demand overtaking supply decisively | Potential buy signal — especially on H4/D1 |
| Sharp cross from positive to negative | Supply overtaking demand decisively | Potential sell signal |
| Hovering around zero (-5 to +5) | No clear winner, low conviction | Stay flat — no edge in either direction |
| DI positive for 10+ bars | Sustained buying pressure | Trend likely healthy — look for pullback entries |
| DI negative for 10+ bars | Sustained selling pressure | Downtrend intact — rallies are selling opportunities |
Timeframe matters enormously. On H1 charts, the DI will cross zero multiple times per day on most instruments, and many of those crosses lead nowhere. Session transitions (London open, New York open) create temporary volume surges that push the DI across zero without any structural change in market direction. By the time you enter, the cross has already reversed.
On H4 charts, zero-line crosses carry significantly more weight. Each H4 bar incorporates enough volume data that a cross represents a genuine multi-hour shift in participation dynamics. This is the timeframe where zero-line crosses become actionable for swing traders.
On D1 charts, a zero-line cross is a relatively rare event — you might see only 2-3 per month on major forex pairs. But when it happens, it often marks the beginning of a sustained directional move. A DI that was negative for two weeks and then crosses decisively above zero on the daily chart is worth paying serious attention to.
How to trade zero-line crosses properly:
- Wait for a decisive cross (not a hesitant wobble through zero)
- Confirm with price action — is price breaking a recent swing high or low in the same direction?
- Check the higher timeframe — if D1 DI is positive and H4 just crossed above zero, you have alignment
- Place your stop on the opposite side of the recent swing, not at some arbitrary distance
- Watch for the DI to stay on the new side for at least 2-3 bars — if it immediately reverses, exit early
A useful filter: combine zero-line crosses with a simple moving average. If the DI crosses above zero while price is also above the 50-period SMA, the signal is structurally stronger than a cross that occurs below the moving average. The MA provides trend context that the DI alone doesn't capture.
One last nuance: when the DI crosses zero and then immediately pulls back to retest the zero line without going through — that retest is often a high-probability entry point. It's the indicator equivalent of a breakout-and-retest pattern. The initial cross shows the shift; the pullback to zero gives you a better risk-reward entry. If the retest holds, enter in the direction of the original cross with a tight stop below zero.

Above zero, buyers dominate. Below zero, sellers rule. The zero line is the battlefield dividing line.
4Demand Index Divergence: An Early Warning for Trend Changes
If zero-line crosses are the Demand Index's bread and butter, divergences are its secret weapon. And frankly, divergence analysis is where this indicator earns its keep against more popular alternatives.
Divergence occurs when price and the DI are telling different stories. Price makes a new high, but the DI doesn't. Or price drops to a new low, but the DI makes a higher low. These disagreements between price and volume-weighted pressure are early warnings that the current trend may be running on fumes.
Why does the DI produce particularly useful divergences? Because it incorporates volume. A regular RSI divergence tells you price momentum is slowing, which is valuable. A DI divergence tells you that price momentum is slowing and the volume behind the move is deteriorating. That's a stronger statement about the structural health of the trend.
Bearish Divergence Setup
Price makes a higher high. The DI makes a lower high (or fails to make a new high at all). This means that even though price pushed higher, the volume-weighted buying pressure was weaker on the second push than the first. Sellers are absorbing demand more effectively at the higher level.
On daily charts, bearish DI divergences have historically appeared several bars before price reverses — often 3 to 8 bars, which translates to roughly one to two trading weeks of lead time. That window is enough to tighten stops, reduce position size, or prepare a counter-trend entry plan.
Bullish Divergence Setup
Price makes a lower low. The DI makes a higher low. Translation: yes, price dropped further, but sellers are losing steam. Volume behind the decline is diminishing, and whatever buying is occurring is proportionally stronger than on the previous down leg. This is exactly the pattern that forms at market bottoms when selling exhaustion meets early accumulation.
| Divergence Type | Price Action | DI Behavior | Signal |
|---|---|---|---|
| Bearish regular | Higher high | Lower high | Potential top — demand weakening |
| Bullish regular | Lower low | Higher low | Potential bottom — selling pressure fading |
| Bearish hidden | Lower high | Higher high | Continuation of downtrend |
| Bullish hidden | Higher low | Lower low | Continuation of uptrend |
The hidden divergence bonus. Most traders only look for regular (classic) divergences, but hidden divergences are equally valuable — and often more so for trend-following traders. A bullish hidden divergence occurs when price makes a higher low (the uptrend is intact) but the DI makes a lower low. This seemingly contradictory signal actually confirms the trend: the brief DI dip occurred during a healthy pullback, and price's refusal to make a lower low shows that buyers stepped in before the selling pressure intensified. These hidden divergences are continuation signals, not reversal signals.
Practical divergence trading rules:
-
Never trade a divergence in isolation. A divergence is a warning, not a trigger. Wait for a confirming price signal — a break of a short-term trendline, a reversal candlestick pattern (engulfing, pin bar), or a close beyond a recent swing point.
-
Multi-bar divergences are stronger than two-bar divergences. If price makes three consecutive higher highs while the DI makes three consecutive lower highs, the divergence is far more significant than a single instance. The longer the disagreement persists, the more pressure builds for a resolution.
-
Respect the timeframe hierarchy. A divergence on D1 outweighs a divergence on H4, which outweighs H1. If D1 shows no divergence but H1 does, the H1 divergence may resolve as a minor pullback rather than a trend reversal.
-
Combine with support and resistance. A bearish DI divergence that forms right as price touches a major resistance level is a far higher-probability signal than one occurring in the middle of nowhere. The confluence of structural resistance and weakening demand pressure is a potent combination.
-
Track volume separately as a sanity check. If the DI is showing a bearish divergence but raw volume bars are actually increasing on the latest rally, something doesn't add up — the DI's internal smoothing may be lagging. In those cases, wait for clarity rather than jumping in.
A concrete example: In a textbook bearish divergence scenario on EUR/USD D1, price rallied to a fresh multi-week high while the DI peaked several points below its reading from the previous price high two weeks earlier. The divergence warned that buying pressure was declining even as price climbed. Within a week, price reversed and dropped 150+ pips. The DI flagged the deterioration a full five trading days before the reversal candle printed — a timeline that gives swing traders genuine room to adjust their positioning.
Divergence analysis isn't foolproof (nothing in trading is — if someone tells you otherwise, they're selling something). Divergences can persist for weeks in strong trends before resolving. But as an early warning system, the Demand Index's volume-weighted divergences are among the more reliable signals in the technical analysis toolkit.

When divergence signals a plot twist the crowd hasn't figured out yet.
“Let's be honest: the Demand Index is not a popular indicator.”
5Is Demand Index Worth Adding to Your Chart in 2026?
Let's be honest: the Demand Index is not a popular indicator. You won't find it in most "top 10 indicators" lists, it doesn't come pre-loaded on MetaTrader 5 by default, and your average YouTube trading guru has probably never mentioned it. So the fair question is: does it actually add value, or is it a relic from 1981 that belongs in the technical analysis museum?
The answer depends on what you're looking for and what you're already using.
The case for adding DI to your chart:
-
It fills a genuine gap. If your current setup is all price-based (RSI, MACD, moving averages), none of those tools are telling you anything about volume. The DI adds a dimension that pure price indicators can't provide. Volume confirmation turns a "maybe" signal into a "probably" signal.
-
The divergence signals are genuinely useful. As discussed above, DI divergences combine price and volume disagreement into a single visual cue. Finding these divergences manually by comparing price charts and volume bars is tedious and error-prone. The DI automates that comparison.
-
No parameters to over-optimize. In a world where traders spend hours backtesting RSI(14) vs RSI(9) vs RSI(21), the DI's lack of adjustable settings is refreshing. It either works for your instrument and timeframe or it doesn't — no illusion of improvement through curve-fitting.
-
Works well on H4 and D1. For swing traders and position traders who check charts once or twice a day, the DI produces clean signals at these timeframes without the noise that plagues faster settings.
The case against:
-
Volume quality on forex is a real limitation. Forex spot markets provide tick volume, not real transaction volume. The DI was designed for exchange-traded instruments where volume is genuine. On major forex pairs during liquid sessions (London/New York overlap), tick volume is a reasonable proxy. On exotic pairs or during thin Asian hours, the DI becomes unreliable because the volume input itself is unreliable.
-
Platform availability is inconsistent. The DI isn't built into MetaTrader 5 or most retail platforms. You'll need to find a custom indicator on MQL5, TradingView (where community scripts exist), or use a more advanced platform like Sierra Chart, NinjaTrader, or Quantower where it's included. This isn't a dealbreaker, but it is a hurdle.
-
No objective overbought/oversold levels. Because the DI is unbounded, you can't say "+70 is overbought" the way you can with RSI. What counts as an extreme reading varies by instrument and by market regime. You need to visually calibrate by looking at recent DI history on your specific chart.
-
It can lag during sudden reversals. The internal exponential smoothing helps with noise reduction but means the DI occasionally catches up to sharp V-reversals a bar or two late.
| Factor | DI Advantage | DI Limitation |
|---|---|---|
| Data dimension | Combines price AND volume | Volume quality varies (tick vs real) |
| Parameters | None to over-optimize | Can't customize for different instruments |
| Signal type | Excellent divergence detection | No fixed overbought/oversold zones |
| Timeframe | Clean on H4 and D1 | Noisy on M15 and H1 |
| Availability | Free on advanced platforms | Not built into MT5 by default |
| Learning curve | Sibbet's 6 rules are clear | Unbounded scale requires visual calibration |
Who should use it?
Swing traders and position traders on H4 and D1 who already have a price-based system and want to add volume confirmation without cluttering their charts with multiple volume tools. If you're currently using RSI + a moving average, replacing RSI with the DI (or adding DI alongside it) gives you a fundamentally different data perspective. RSI tells you price momentum. DI tells you volume-weighted demand pressure. Together, they cover both dimensions of market behavior.
Who should skip it?
Scalpers and intraday traders on M5/M15. The DI generates too much noise at these timeframes, and the tick volume issue in forex makes the readings structurally suspect for short-duration trades. If you're a scalper, something like VWAP or order flow tools will serve you better.
The bottom line: the Demand Index is an underappreciated indicator with genuine analytical value — particularly for its divergence signals on higher timeframes. It won't revolutionize your trading overnight, and it requires a bit more effort to set up than mainstream tools. But if you're looking for a volume-based edge that most retail traders aren't using (which has its own advantage in terms of avoiding crowded signals), the DI is worth a serious test drive on your H4 and D1 charts.
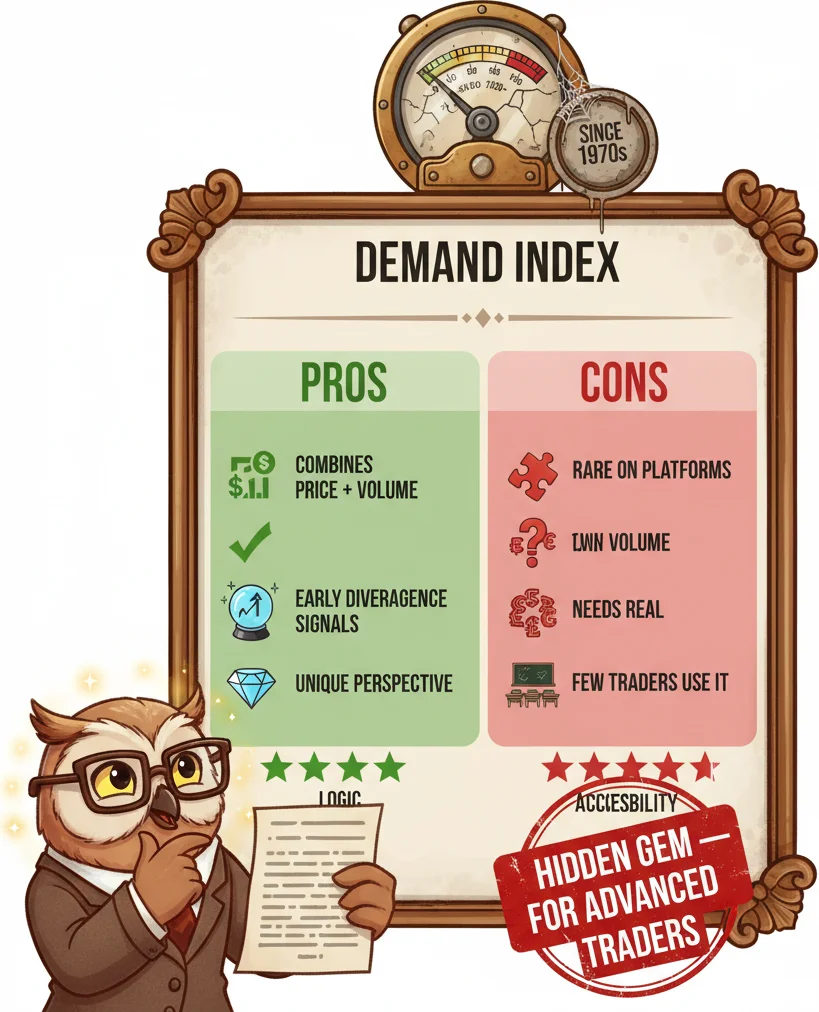
The Demand Index is a hidden gem from the 1970s — powerful logic, but rarely found on modern platforms.
Frequently Asked Questions
Q1What does the Demand Index measure exactly?
The Demand Index measures the balance between buying pressure and selling pressure by combining price movement direction and magnitude with volume data. A positive reading means volume-weighted buying pressure exceeds selling pressure for the period. A negative reading means the opposite. The further from zero, the more extreme the imbalance between demand and supply.
Q2Does the Demand Index work on forex, or only on stocks and futures?
The DI works on forex but with an important caveat: spot forex uses tick volume (number of price changes) rather than true transaction volume. This makes the indicator a proxy measure rather than a precise read of actual order flow. On major pairs during liquid sessions — particularly the London/New York overlap — tick volume correlates well enough with real volume that the DI produces useful signals. On exotic pairs or during thin Asian hours, trust it less.
Q3Are there any adjustable settings or parameters for the Demand Index?
No. The standard Demand Index has no user-configurable parameters — no lookback period, no smoothing factor. This is by design: Sibbet built the formula with fixed internal calculations. While this means you can't optimize the indicator for a specific instrument, it also eliminates the risk of curve-fitting. The only variable you control is which timeframe you apply it to, with H4 and D1 being the most effective for most traders.
Q4How is the Demand Index different from On Balance Volume (OBV)?
OBV is cumulative — it adds volume on up-close days and subtracts volume on down-close days, producing a running total that trends over time. The Demand Index is an oscillator that fluctuates around a zero line, measuring the current ratio of buying to selling pressure. OBV is better for confirming long-term accumulation or distribution trends. The DI is better for timing entries and exits using zero-line crosses and divergence signals. They complement each other well when used together.
Q5Where can I find the Demand Index indicator on my trading platform?
The DI is built into Sierra Chart, NinjaTrader, Quantower, MetaStock, and thinkorswim. On TradingView, search the community scripts library for 'Demand Index' — several well-rated implementations exist. On MetaTrader 5, the DI is not included by default, but you can find free and paid versions on the MQL5 marketplace. Search for 'Demand Index Sibbet' to find the most accurate implementations.
Top Brokers
About the Author
Daniel Harrington
Senior Trading Analyst
Daniel Harrington is a Senior Trading Analyst with a MScF (Master of Science in Finance) specializing in quantitative asset and risk management. With over 12 years of experience in forex and derivatives markets, he covers MT5 platform optimization, algorithmic trading strategies, and practical insights for retail traders.
Use This Indicator
Risk Disclaimer
Trading financial instruments carries significant risk and may not be suitable for all investors. Past performance does not guarantee future results. This content is for educational purposes only and should not be considered investment advice. Always conduct your own research before trading.