DeMarker Indicator Guide: Tom DeMark's Exhaustion & Reversal Tool
DeMarker compares the current high and low to the previous period's values to assess price exhaustion and potential reversal areas.

Daniel Harrington
Senior Trading Analyst · MT5 Specialist
☕ 16 min read
Settings — DeM
| Category | oscillator |
| Default Period | 14 |
| Best Timeframes | M15, H1, H4 |
Most oscillators are built on closing prices. The DeMarker indicator ignores them entirely. Developed by Tom DeMark — the same analyst who advised George Soros, Paul Tudor Jones, and Steven Cohen — the DeM oscillator measures exhaustion by comparing period highs and lows against the previous bar, producing a 0-to-1 reading that flags when buyers or sellers are running out of steam. With default thresholds at 0.30 and 0.70 and a standard 14-period lookback, DeMarker specializes in one thing: catching reversals before they fully develop. If you have ever watched a trend look unstoppable only to collapse without warning, this is the tool that was quietly flashing red three bars earlier.
Key Takeaways
- Before we touch the indicator itself, it helps to understand the mind behind it — because Tom DeMark is not your average...
- The DeMarker indicator answers a specific question that most oscillators dance around: are buyers (or sellers) still pus...
- The DeMarker oscillator divides the 0-to-1 range into three zones, and each zone carries a different statistical profile...
1Tom DeMark: The Advisor to Hedge Fund Giants
Before we touch the indicator itself, it helps to understand the mind behind it — because Tom DeMark is not your average technical analyst publishing indicators from a home office.
Thomas R. DeMark built his career at the intersection of institutional money and market timing. After earning his B.A. and M.B.A. from Marquette University, he spent six years (1972-1978) as an officer at National Investment Services, a multibillion-dollar pension fund manager. His role there was specific: research strategies to improve the firm's investment timing. Dissatisfied with the tools available at the time, he started building his own. By 1982, he had founded DeMark Investment Advisory, consulting directly for hedge funds, mutual funds, and investment counseling firms.
Then things got interesting. In 1988, Paul Tudor Jones — one of the most successful macro traders in history — hired DeMark as executive vice president of Tudor Investment Corp. Think about that for a moment: a technical analyst given a C-suite role at a hedge fund that was already legendary. That does not happen unless your methods produce results that survive live trading with real capital.
By the mid-1990s, DeMark had become a special advisor to Steven A. Cohen, then running SAC Capital Advisors (now Point72 Asset Management). Cohen, who managed over $15 billion, relied on DeMark's timing tools for over 27 years. In 2008, Cohen and John Burbank of Passport Capital became partners in DeMark Analytics, LLC — essentially buying equity in DeMark's intellectual property.
The client list reads like a Wall Street hall of fame: George Soros, Leon Cooperman of Omega Advisors, Michael Steinhardt, and former Treasury Secretary Robert Rubin (during his time at Goldman Sachs). DeMark developed more than 70 market timing tools over his career, including the Sequential, Combo, and Range Expansion Index indicators — each used by institutional desks worldwide. His indicators are available as premium add-ons on Bloomberg, CQG, and TradingView.
His track record includes publicly documented calls: the October 4, 2011 U.S. market bottom (called within one point of the exact low, months in advance), the December 2012 Shanghai Composite bottom, and Bitcoin's exact top on December 18, 2017 and exact bottom on December 14, 2018. In 2020, the Chartered Market Technicians Association awarded him their Lifetime Achievement Award for nearly five decades of contributions to technical analysis.
All of his work rests on two foundational principles: supply and demand dynamics, and Fibonacci relationships. DeMark's philosophy centers on pinpointing inflection points — the precise moments where buying or selling pressure is about to exhaust itself. He is adamant that without risk management and discipline, even the best timing tools are worthless.
Why does this biography matter for learning the DeMarker indicator? Because the tool was built by someone who needed his indicators to work under the most demanding conditions imaginable — managing billions, advising traders who would fire him if signals failed consistently, and operating in markets where a few ticks of edge translate to millions of dollars. The DeMarker was not designed as an academic exercise. It was designed to make money.

Tom DeMark tools are used by SAC Capital, Tudor Jones, and Goldman Sachs. This is not a retail toy.
2How DeMarker Measures Buying and Selling Exhaustion
The DeMarker indicator answers a specific question that most oscillators dance around: are buyers (or sellers) still pushing price into new territory, or have they run out of fuel?
The calculation is elegant in its simplicity. It runs in two stages, and neither one involves a closing price.
Stage 1 — Building the raw components
Two values are computed for each bar:
- DeMax: If the current bar's high is greater than the previous bar's high, DeMax equals the difference between the two highs. If the current high is equal to or lower than the previous high, DeMax is zero.
- DeMin: If the current bar's low is lower than the previous bar's low, DeMin equals the difference (previous low minus current low). If the current low is equal to or higher, DeMin is zero.
This is the core insight. DeMax captures upside extension — the market's ability to reach higher highs. DeMin captures downside extension — the market's ability to reach lower lows. When either value is zero, it means the market failed to extend in that direction on that bar. And here is where DeMark's genius shows: those zeros are not discarded. They are fed directly into the moving average, which means every failure to extend pulls the average down.
Stage 2 — The ratio
DeM = SMA(DeMax, N) / [SMA(DeMax, N) + SMA(DeMin, N)]
With the default period of 14, both simple moving averages use 14 bars. The result is a normalized ratio permanently confined between 0 and 1.
When the market is consistently making higher highs — strong buying pressure — DeMax values are positive and DeMin values tend toward zero. The numerator grows relative to the denominator, pushing DeM toward 1.0. When the market is making lower lows — strong selling pressure — the reverse occurs, and DeM drops toward 0.
The critical behavioral property is what happens during exhaustion. Imagine a strong uptrend where price has been making higher highs for ten consecutive bars. DeMax values are consistently positive, and DeM is above 0.70. Then, on bar eleven, the high is equal to the previous bar's high — no new ground. DeMax becomes zero. On bar twelve, the high is actually lower. Another zero. Those two zeros flowing into the 14-period SMA immediately begin dragging the average down, and the DeM reading starts falling — often before price itself has begun to decline.
This is why DeMark's tool is classified as a leading indicator. It does not wait for price to reverse. It detects the moment when the ability to push further has weakened. Picture a sprinter who is still running forward but whose stride length is shortening with every step. The stopwatch still shows forward progress, but the biomechanics say the deceleration has already begun. That is what DeMarker reads.
Why highs and lows instead of closes?
Closing prices are the market's consensus at the end of a period. They are important, but they miss the intrabar battle. A bar can close near its open (a doji) and look neutral, while its high and low tell a completely different story — aggressive buying that was completely absorbed by sellers, or vice versa. DeMarker captures this struggle because it measures the extremes, not the settlement.
This design makes the indicator particularly sensitive on instruments with wide intraday ranges — forex majors during session overlaps, index CFDs around economic releases, and commodity futures during inventory reports. Anywhere that wicks carry real information, DeMarker has a structural advantage over close-based oscillators.
A note on the SMA choice
Unlike RSI, which typically uses an exponential moving average (Wilder's smoothing), DeMarker uses a simple moving average. The practical consequence: once a zero value enters the SMA window, it stays there for the full 14-period lookback with equal weight. An EMA would discount that zero gradually. The SMA keeps it fully weighted until it falls off the back of the window. This makes exhaustion signals stickier in DeMarker — once the indicator starts dropping from overbought, it tends to keep dropping rather than bouncing back on a single strong bar.

When DeMarker hits 0.30 or 0.70 - the market's basically running a fever.
“The DeMarker oscillator divides the 0-to-1 range into three zones, and each zone carries a different statistical profile for what happens next.”
3The 0.30/0.70 Zones: Spotting Reversals Before They Happen
The DeMarker oscillator divides the 0-to-1 range into three zones, and each zone carries a different statistical profile for what happens next.
Above 0.70 — Overbought territory
When DeM crosses above 0.70, the 14-period average of upside extensions significantly outweighs the downside extensions. The market has been making higher highs with consistency. Counterintuitively, this does not automatically mean "sell now." In strong trending conditions, DeM can remain above 0.70 for 20 or more bars without producing a meaningful pullback.
The actionable signal is not the initial crossing above 0.70 — it is the subsequent crossing back below 0.70. That downward cross indicates the market has lost its ability to sustain new highs. Buying exhaustion has set in. The 1-3 bars immediately following the downward cross through 0.70 represent the highest-probability window for short entries or long profit-taking.
Below 0.30 — Oversold territory
The mirror image. DeM below 0.30 means the market has been consistently making lower lows. Selling pressure dominates. The buy signal triggers when DeM crosses back above 0.30 from below, indicating that sellers can no longer push into new low ground.
On H1 charts across major forex pairs, the crossing-back-above-0.30 signal produces better mean-reversion trades when filtered by the higher-timeframe trend direction. Without trend filtering, the win rate sits close to random. With it, the edge becomes meaningful — typically in the 55-60% range on major pairs.
Between 0.30 and 0.70 — The neutral zone
Readings in this range carry no statistically significant directional edge. However, the 0.50 midpoint serves as a useful momentum divider. During a confirmed uptrend, DeM consistently holding above 0.50 validates the trend. A dip toward 0.50 from elevated levels can signal a pullback entry opportunity rather than a reversal.
Divergence — The highest-quality signal
Divergence between price and DeMarker produces the most reliable reversal signals, though they require patience.
-
Bearish divergence: Price prints a higher high, but DeM prints a lower high (ideally already below 0.70 on the second peak). This combination suggests that despite new price highs, the market's ability to extend upward has actually weakened. The buying pressure behind the new high is hollower than the buying pressure behind the previous high.
-
Bullish divergence: Price prints a lower low, but DeM prints a higher low (ideally already above 0.30 on the second trough). Selling pressure is fading even as price continues to drop.
Divergence signals on H4 charts typically resolve within 3-8 bars. The delay can feel uncomfortable — you spot the divergence but price keeps moving against you for several bars before reversing. This is normal behavior and is why divergence entries benefit from waiting for a candlestick confirmation (pin bar, engulfing pattern) rather than entering immediately on the divergence formation.
Adjusting thresholds by timeframe
The standard 0.30/0.70 levels work best on H1 and H4 with the default 14-period setting. For lower timeframes like M15, widening the thresholds to 0.25/0.75 filters out a significant portion of marginal signals. For daily charts, tightening to 0.35/0.65 produces fewer but higher-conviction signals.
A practical rule of thumb: if your DeMarker settings produce more than 8-10 threshold touches per week on a single instrument, the thresholds are too tight for the timeframe you are trading. Widen them until signal frequency drops to a manageable 4-6 per week.
Combining zones with price structure
DeMarker readings gain their strongest predictive power when they align with visible price structure. A DeM reading below 0.30 that coincides with a horizontal support level or a rising trendline produces a significantly higher-quality buy signal than a sub-0.30 reading in open space. Similarly, DeM above 0.70 at a previous resistance zone or a measured move target carries more weight than an overbought reading mid-trend with no structural barrier ahead.
The zones tell you the internal state of the market. Price structure tells you where external participants are likely to act. When both align, the probability of a reversal increases substantially.
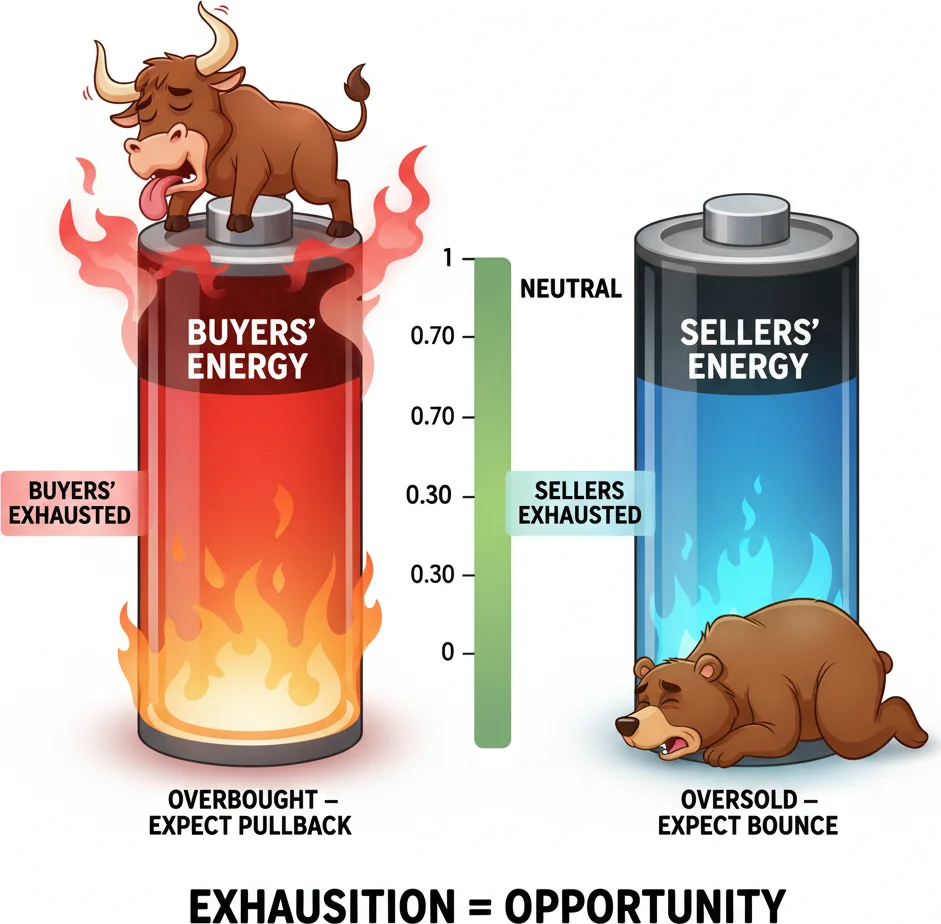
Below 0.30, sellers are exhausted. Above 0.70, buyers are gassed. That is where reversals brew.
4DeMarker for Forex: A Counter-Trend Scalping Setup
The DeMarker indicator was built to detect exhaustion, which makes it a natural fit for counter-trend trading — the art of selling into strength and buying into weakness. Here is a structured scalping setup designed specifically for forex majors on the M15 and H1 timeframes.
The Setup — "Exhaustion Fade"
This strategy fades short-term exhaustion moves within the context of a higher-timeframe range or against an overextended trend leg. It is not a trend-following system. If you are uncomfortable trading against short-term momentum, this approach will feel wrong approximately 40% of the time. That is by design.
Configuration
- Indicator: DeMarker, period 14 on H1 or period 21 on M15
- Thresholds: 0.70/0.30 on H1; 0.75/0.25 on M15 (wider to reduce noise)
- Trend filter: 50-period SMA on the same chart. This is non-negotiable — counter-trend scalping without a trend filter is how accounts meet their maker. (Pun intended, but also genuinely true.)
- Best pairs: EUR/USD, GBP/USD, USD/JPY, AUD/USD (tightest spreads, most liquid)
- Best sessions: London-New York overlap (13:00-17:00 UTC). Volume during this window validates the exhaustion readings. Asian session signals on these pairs are statistically weaker.
Entry rules — Long (buy)
- Price is above the 50 SMA (confirming the broader bias is bullish — you are buying a dip, not catching a falling knife).
- DeMarker drops below 0.30 (H1) or 0.25 (M15), indicating short-term selling exhaustion.
- DeMarker crosses back above 0.30/0.25. This is the trigger — not the initial drop below the threshold.
- Confirm with a bullish candlestick signal on the trigger bar or the bar immediately after: pin bar with a lower wick at least twice the body size, or a bullish engulfing pattern.
- Enter long on the close of the confirmation candle.
Entry rules — Short (sell)
Mirror the above: price below the 50 SMA, DeMarker above 0.70/0.75, cross back below the threshold, bearish candlestick confirmation.
Stop-loss placement
Place the stop 2-3 pips below the swing low that formed during the oversold reading (for longs) or above the swing high during the overbought reading (for shorts). On EUR/USD H1, this typically means a 15-25 pip stop. On M15, expect 8-15 pips.
Take-profit targets
Two approaches work well:
- Fixed ratio: 1.5:1 reward-to-risk minimum. If your stop is 20 pips, target at least 30 pips. This is the conservative approach.
- DeMarker-based exit: Hold the position until DeMarker reaches the opposite threshold (from below 0.30 to above 0.70, or vice versa). This catches larger reversals but extends the holding period and exposes you to more noise.
A hybrid approach — taking half the position off at 1.5:1 and holding the remainder until DeMarker hits the opposite zone — balances consistency with occasional outsized wins.
A worked example on EUR/USD H1
Imagine EUR/USD has been trading above its 50 SMA at 1.0900. Price dips to 1.0870 over three bars, and the DeMarker drops to 0.27. On the fourth bar, DeM crosses back above 0.30, and the bar closes as a bullish pin bar with a long lower wick. You enter long at 1.0878 (the close of the pin bar). Your stop goes at 1.0862 — three pips below the swing low at 1.0865. That is a 16-pip stop. Your first target is 1.0902 (1.5:1, or 24 pips). You move half the position to this level and trail the rest until DeMarker approaches 0.70.
What to avoid
- Do not fade moves during major news releases (NFP, FOMC, ECB rate decisions). Exhaustion signals are meaningless when a fundamental catalyst is driving price. Wait at least 30 minutes after the release for the initial volatility spike to settle.
- Do not take counter-trend entries when the 50 SMA is sloping sharply. A flat or gently sloping SMA indicates a range or a mild trend — ideal conditions. A steep SMA slope means strong trend momentum, and counter-trend entries carry significantly higher failure rates.
- Do not stack DeMarker signals. If the first entry hits your stop and DeMarker immediately produces another entry signal in the same direction, skip it. Consecutive failures in one direction usually mean the trend context has shifted and the setup is no longer valid.
Expected performance
With strict adherence to the trend filter and session timing, this setup historically produces win rates in the 55-62% range on major forex pairs. The edge is not enormous — it is not supposed to be. Counter-trend scalping is a frequency game. You take many small-edge trades and let the law of large numbers work over time. One losing week does not invalidate the approach. One losing month deserves a parameter review.

Counter-trend scalping with DeMarker - catch reversals faster than your WiFi drops.
“The RSI (Relative Strength Index) was already established and widely used when Tom DeMark created the DeMarker indicator.”
5DeMarker vs RSI: Why DeMark Built His Own Oscillator
The RSI (Relative Strength Index) was already established and widely used when Tom DeMark created the DeMarker indicator. So why build another oscillator that looks suspiciously similar on the chart? Because DeMark identified specific structural weaknesses in RSI that his clients — managing billions of dollars — could not afford to tolerate.
The fundamental difference: what price data enters the formula
RSI calculates average gain and average loss based exclusively on closing prices. If today's close is higher than yesterday's close, the difference is a "gain." If lower, it is a "loss." The ratio of average gains to average losses, smoothed over 14 periods, produces the RSI value.
DeMarker ignores closing prices entirely. It compares each bar's high against the previous bar's high (DeMax) and each bar's low against the previous bar's low (DeMin). This means DeMarker captures the market's attempt to reach new extremes — the actual frontier of buying and selling pressure — while RSI only sees where the market settled at the end of the bar.
Why does this matter in practice? Consider a bar on EUR/USD H1 that opens at 1.0850, spikes to 1.0890 (a 40-pip wick), then collapses and closes at 1.0855 — just 5 pips above the open. RSI sees a 5-pip gain and registers mild bullish pressure. DeMarker sees a 40-pip attempt to push higher (if that 1.0890 high exceeded the previous bar's high) and records the full extension. The exhaustion story — aggressive buyers who were completely absorbed by sellers — is visible in DeMarker but largely invisible in RSI. (RSI basically missed the entire fight because it only checked the scoreboard at the final whistle.)
Moving average type: SMA vs EMA
RSI typically uses an exponential moving average (Wilder's smoothing method, technically), which gives more weight to recent data points. DeMarker uses a simple moving average, which weights all periods equally. The practical consequence: RSI reacts faster to sudden price spikes but also recovers faster, which can produce premature exit signals. DeMarker's SMA approach means that once a zero value (a failed extension) enters the calculation, it persists in the average for the full lookback period, making the exhaustion signal stickier and harder to reverse on a single anomalous bar.
Leading vs lagging behavior
Because DeMarker measures the weakening of new-high or new-low production — not just the direction of closes — it tends to signal exhaustion 1-3 bars before RSI on the same instrument and timeframe. In high-volatility environments (news-driven forex sessions, for example), those 1-3 bars can represent a significant timing advantage for entries and exits.
DeMark specifically designed his indicator to minimize lag. His stated goal was to create the optimal oscillator without the drawbacks of existing tools. Whether he fully achieved that is debatable, but the empirical evidence supports the claim that DeMarker produces earlier exhaustion warnings than RSI in most market conditions.
Scale differences
RSI oscillates between 0 and 100, with overbought at 70 and oversold at 30. DeMarker oscillates between 0 and 1, with equivalent thresholds at 0.70 and 0.30. The levels are identical in concept — only the scale differs. Some charting platforms scale DeMarker to 0-100 to match RSI visually, which can create confusion if you are not aware of which scale your platform uses. Always check before applying threshold rules.
When RSI wins
RSI performs better in strongly trending markets where the close-to-close momentum measurement captures the dominant move cleanly. During a multi-day trend on a daily chart, RSI's smoothing keeps the reading directionally stable, while DeMarker can produce premature exhaustion signals on days where the trend pauses briefly (equal highs for one bar) before resuming.
RSI is also more widely used, which means more traders are watching the same overbought/oversold levels. In markets driven partly by collective behavior — which is all markets — the self-fulfilling prophecy effect gives RSI a slight edge at standard levels.
When DeMarker wins
DeMarker outperforms RSI in ranging and counter-trend conditions, where the ability to detect exhaustion before the close confirms it provides a genuine timing edge. It also performs better on lower timeframes (M15-H1) where intrabar price action — wicks, spikes, failed breakouts — carries more informational content than the close alone.
For swing traders and scalpers who trade reversals, DeMarker is the sharper tool. For trend-followers who ride momentum, RSI remains the standard.
Side-by-side comparison
| Feature | DeMarker (DeM) | RSI |
|---|---|---|
| Price data | Highs and lows | Closing prices |
| MA type | Simple Moving Average | Exponential (Wilder's) |
| Scale | 0 to 1 | 0 to 100 |
| OB/OS levels | 0.70 / 0.30 | 70 / 30 |
| Signal timing | Leading (1-3 bars earlier) | Slightly lagging |
| Best use case | Reversals, exhaustion | Trends, momentum |
| Platform availability | MT4/MT5 built-in | Universal |
The bottom line
DeMark did not build his oscillator because RSI was broken. He built it because RSI was not designed for what he needed: an early-warning system for trend exhaustion that institutional traders could act on before the crowd noticed the reversal. Whether that edge justifies switching from RSI depends entirely on whether you trade reversals or trends. If reversals are your game, DeMarker deserves a permanent spot on your chart.
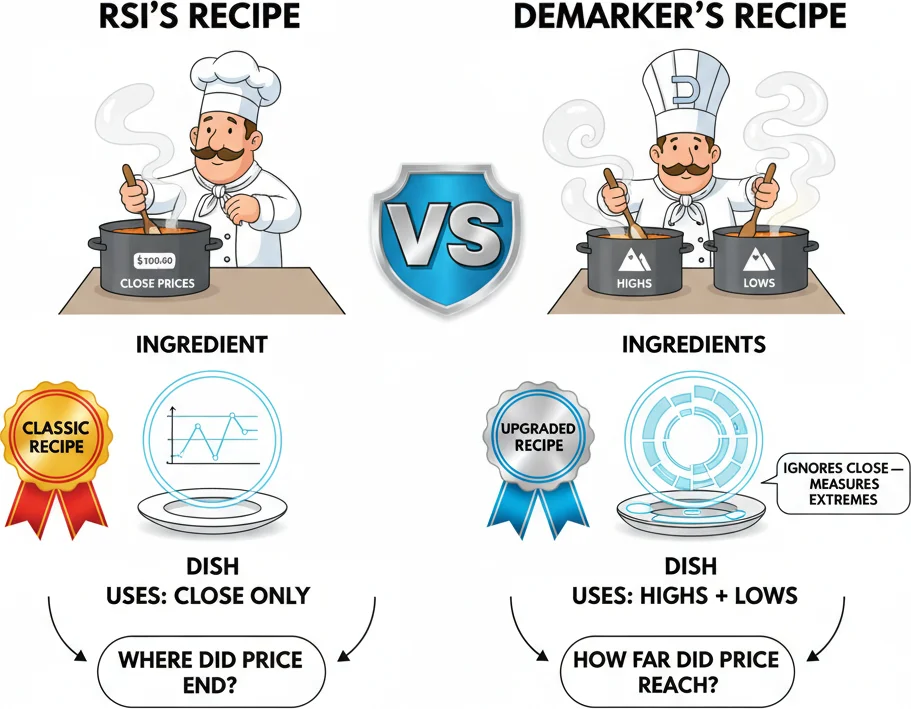
RSI uses closing prices. DeMarker uses highs and lows. Same goal, different raw material — and different edge.
Frequently Asked Questions
Q1What is the DeMarker indicator and how does it differ from other oscillators?
The DeMarker (DeM) indicator is a momentum oscillator created by Tom DeMark that measures buying and selling exhaustion by comparing current highs and lows against the previous bar's highs and lows. Unlike RSI or Stochastic — which rely on closing prices — DeMarker uses intrabar extremes (highs and lows) to detect when the market's ability to push into new territory is weakening. This design makes it a leading indicator that can signal reversals 1-3 bars before close-based oscillators. It oscillates between 0 and 1, with 0.70 marking overbought and 0.30 marking oversold conditions.
Q2What are the best DeMarker settings for scalping and day trading?
For H1 day trading, the default 14-period setting with 0.70/0.30 thresholds is well-calibrated and produces approximately 4-8 threshold signals per week on major forex pairs. For M15 scalping, increase the period to 21 and widen the thresholds to 0.75/0.25 to filter out false signals caused by microstructure noise. For H4 swing trading, a shorter period of 8-10 captures swing exhaustion faster. The key principle: shorter timeframes need wider thresholds or longer periods to compensate for increased noise, while longer timeframes can use tighter thresholds for higher-quality signals.
Q3Can the DeMarker indicator be used as a standalone trading system?
No — and this applies to every oscillator, not just DeMarker. Used alone with default settings, DeMarker threshold crossings produce win rates barely above 50% on most instruments. The indicator becomes profitable when combined with at least one additional filter: a trend direction indicator (like a 50-period SMA), price structure levels (support and resistance), or candlestick confirmation patterns. The strongest setups combine three conditions — for example, DeMarker below 0.30 at a horizontal support level with a bullish engulfing candle. Multi-condition setups push win rates into the 60-65% range.
Q4How do you read DeMarker divergence signals?
Bullish divergence occurs when price makes a lower low but the DeMarker indicator makes a higher low — this means selling pressure is fading even though price is still declining, and a bounce is likely. Bearish divergence occurs when price makes a higher high but DeMarker makes a lower high — buying power is weakening despite new price highs. Divergence signals are the highest-quality signals the DeMarker produces, but they require patience: on H4 charts, divergence typically takes 3-8 bars to resolve. Wait for a candlestick confirmation pattern before entering rather than trading the divergence formation itself.
Q5Is the DeMarker indicator available in MetaTrader 5?
Yes. The DeMarker indicator is included as a built-in oscillator in MetaTrader 5 (MT5) and MetaTrader 4 (MT4). You can find it under Insert, then Indicators, then Oscillators, then DeMarker. The default period is set to 14, and the indicator displays in a separate window below the price chart, oscillating between 0 and 1. You can customize the period, line color, and style directly in the indicator settings. The 0.30 and 0.70 threshold levels can be added as horizontal lines in the indicator window for visual reference. No custom installation or download is required.
Top Brokers
About the Author
Daniel Harrington
Senior Trading Analyst
Daniel Harrington is a Senior Trading Analyst with a MScF (Master of Science in Finance) specializing in quantitative asset and risk management. With over 12 years of experience in forex and derivatives markets, he covers MT5 platform optimization, algorithmic trading strategies, and practical insights for retail traders.
Use This Indicator
Risk Disclaimer
Trading financial instruments carries significant risk and may not be suitable for all investors. Past performance does not guarantee future results. This content is for educational purposes only and should not be considered investment advice. Always conduct your own research before trading.