Directional Movement Index (DMI): +DI/-DI Crossover Strategy & ADX Guide
DMI consists of +DI and -DI lines that measure upward and downward price pressure, used alongside ADX to determine trend direction and strength.

Daniel Harrington
Senior Trading Analyst · MT5 Specialist
☕ 14 min read
Settings — DMI
| Category | trend |
| Default Period | 14 |
| Best Timeframes | H1, H4, D1 |
Quick question: what if the most famous indicator ever created was actually just one piece of a bigger system that most traders never fully explore? The Relative Strength Index (RSI) gets all the spotlight, but the Directional Movement Index — born from the same mind and the same 1978 book — might be the more practical tool for trend traders. DMI doesn't just tell you a trend exists. It tells you who's winning right now, bulls or bears, and it does so with two competing lines fighting it out on your chart. If you've ever stared at a moving average crossover and wondered whether the trend had real muscle behind it, DMI is your answer.
Key Takeaways
- In 1978, a mechanical engineer turned trader named J. Welles Wilder Jr. published a book called New Concepts in Technica...
- Forget everything else for a moment and focus on just two lines: +DI and -DI. These are the heart of the DMI system, and...
- The DMI crossover is the most widely traded signal from the Directional Movement System, and for good reason — it's stra...
1Wilder's Other Masterpiece: DMI and the Directional Movement System
In 1978, a mechanical engineer turned trader named J. Welles Wilder Jr. published a book called New Concepts in Technical Trading Systems. That single book introduced the RSI, Parabolic SAR, Average True Range, and the Directional Movement System — any one of which would have been a career-defining contribution. Forbes Magazine called him the premier technical trader of his era two years later, and honestly, no single author has matched that level of output since.
The Directional Movement System was Wilder's attempt to answer a deceptively simple question: is price actually moving in a direction, or is it just chopping around? He broke the answer into components. The +DI (Positive Directional Indicator) measures upward price pressure. The -DI (Negative Directional Indicator) measures downward price pressure. And the ADX (Average Directional Index) measures how strong the trend is, regardless of whether it's up or down.
Here's the part most traders miss: DMI and ADX are not separate indicators that happen to work well together. They are parts of one unified system. ADX is literally derived from the +DI and -DI values — it's the smoothed average of the difference between them, divided by their sum. You cannot calculate ADX without first calculating DMI. Think of it this way: DMI is the engine, and ADX is the speedometer attached to that engine.
The calculation starts with something called Directional Movement. For each candle, Wilder compared the current high to the previous high (+DM) and the current low to the previous low (-DM). Only the larger of the two counts — you can't have both positive and negative directional movement on the same bar. If neither the high nor the low extends beyond the prior candle's range, directional movement is zero. That bar is essentially noise, not trend.
These +DM and -DM values are then smoothed over a lookback period (default 14) and normalized by dividing by the Average True Range for the same period. This ATR normalization is brilliant because it makes the readings comparable across different instruments. A +DI reading of 30 on EUR/USD means the same relative bullish pressure as a +DI of 30 on Gold or the S&P 500, even though their absolute price ranges are wildly different.
Wilder built DMI in an era of pad-and-pencil calculations — no computers, no charting platforms. The fact that his system remains a default indicator on every modern trading platform nearly five decades later tells you something about how fundamentally sound the logic is. MetaTrader 5 plots it as three lines: +DI (typically green), -DI (typically red), and ADX (typically blue or white). Most traders glance at the crossovers and ignore the rest. By the end of this guide, you'll know how to use all three lines together the way Wilder intended.
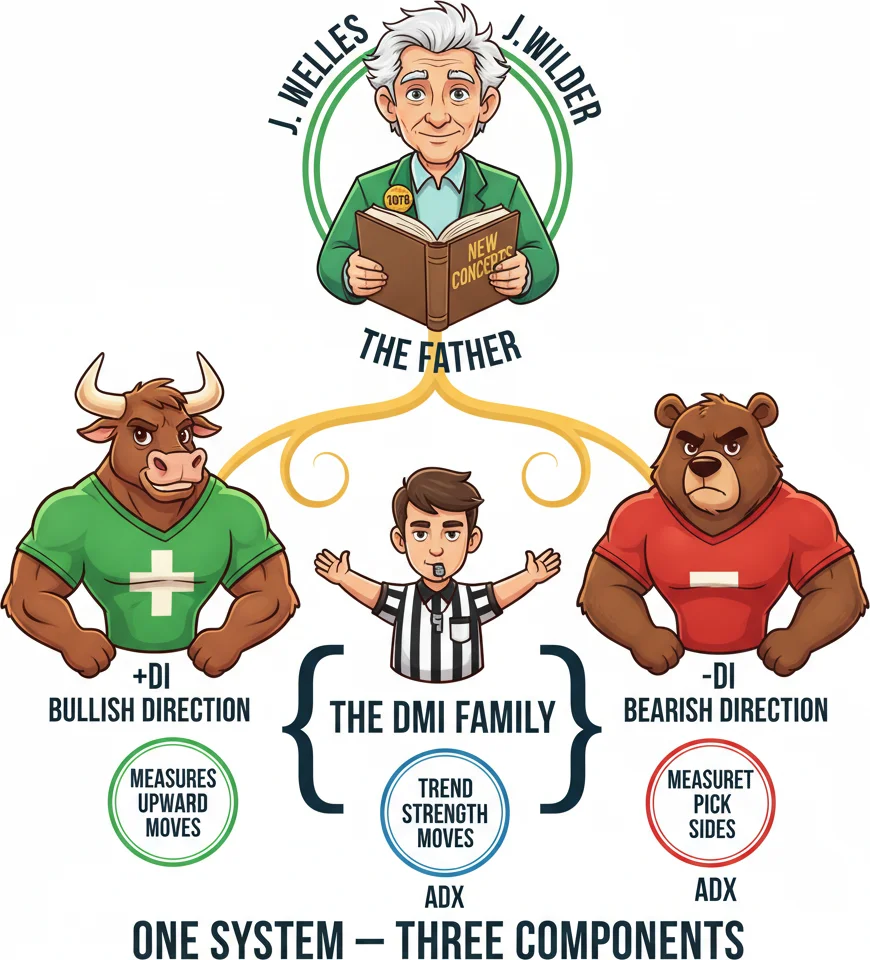
Wilder did not just create one indicator — he built a whole directional movement SYSTEM. DMI is the family.
2+DI and -DI: Bulls vs Bears in One Chart
Forget everything else for a moment and focus on just two lines: +DI and -DI. These are the heart of the DMI system, and understanding their relationship is worth more than memorizing a dozen other indicators.
+DI measures how aggressively price is pushing higher. Specifically, it tracks how much of each candle's range represents upward extension beyond the previous candle. When +DI is rising, it means successive candles are consistently making higher highs — buyers are in control and pushing price into new territory. When +DI is falling, the upward extensions are shrinking. Bulls are losing energy even if price hasn't reversed yet.
-DI does the mirror opposite. It tracks downward extension — how much of each candle's range pushes below the previous candle's low. Rising -DI means bears are consistently pushing price to new lows. Falling -DI means the selling pressure is easing.
The relationship between these two lines tells you the directional story at a glance. When +DI sits above -DI, the market is in a bullish phase — upward directional movement exceeds downward. When -DI sits above +DI, bears are dominant. The wider the gap between the two lines, the more decisive the trend. A +DI at 35 with -DI at 12 describes a completely different market than +DI at 22 and -DI at 19.
Now here's where it gets practical. Both lines oscillate between 0 and roughly 50 in most market conditions. Values below 10 on either line indicate almost no directional pressure in that direction. Values above 30 indicate strong directional pressure. When both lines are clustered between 15 and 20, the market is in directional equilibrium — neither side has control, and the price is likely chopping sideways.
This compression state is actually one of the most useful DMI patterns. When +DI and -DI converge to within 2-3 points of each other after being far apart, the market is coiling for a directional move. It's the DMI equivalent of a Bollinger Band squeeze. The line that breaks away first signals the direction of the coming move.
Let's walk through a real-world scenario. On EUR/USD H4 during a typical trend development, you might see +DI climb from 15 to 28 over several days while -DI drops from 22 to 11. That's a clear shift from equilibrium to bullish dominance. The crossover point — where +DI crossed above -DI — was your early signal. The widening gap confirmed the trend was accelerating.
But what happens at the other end? Eventually, +DI peaks and starts declining while -DI flattens or ticks up. The gap narrows. This convergence warns you the trend is losing directional conviction, even if price hasn't reversed. Experienced traders use this narrowing as a signal to tighten stops or take partial profits — the directional energy that drove the trend is dissipating.
One subtlety: +DI and -DI are both positive numbers. They never go below zero. A common beginner mistake is thinking -DI represents negative territory or losses. It doesn't. It simply measures the strength of downward directional movement. A -DI of 40 isn't bad or good in itself — it just means bears are pushing aggressively. Context determines whether that's a short opportunity or a warning to avoid long entries.

When +DI and -DI cross, it's like bulls and bears finally picking sides.
“The DMI crossover is the most widely traded signal from the Directional Movement System, and for good reason — it's straightforward, it's mechanical, and when filtered properly, it works.”
3The DMI Crossover Strategy: Simple Rules, Solid Results
The DMI crossover is the most widely traded signal from the Directional Movement System, and for good reason — it's straightforward, it's mechanical, and when filtered properly, it works. But the key phrase there is "filtered properly." Raw DMI crossovers without an ADX filter will chew up your account in ranging markets. Let's build this strategy the right way.
The basic signal: go long when +DI crosses above -DI. Go short (or exit longs) when -DI crosses above +DI. On its own, this is a trend-following system that catches every directional shift. The problem is that it also catches every fake shift, every whipsaw, and every choppy Monday morning where the lines cross back and forth three times before lunch.
The ADX filter fixes this. Only take crossover signals when ADX is above 25 and rising. An ADX above 25 tells you a genuine trend is developing — there's enough directional momentum to sustain the move beyond the crossover point. An ADX below 20 tells you the market is ranging, and crossovers in that environment are essentially random noise. The zone between 20 and 25 is ambiguous — some traders use 20 as their threshold, others use 25. In backtesting across major forex pairs on the H4 timeframe, the 25 threshold consistently produces fewer but higher-quality signals.
Wilder himself added another filter called the extreme point rule. On a bullish crossover, note the high of the candle where +DI crosses above -DI. Don't enter immediately — wait for price to break above that high on a subsequent candle. If price fails to exceed the crossover candle's high, the signal is invalidated. This single rule eliminates a surprising number of false entries, particularly in choppy markets where crossovers happen on wide-range indecisive candles.
Here's the complete rule set for the H4 timeframe on forex pairs:
Long entry: +DI crosses above -DI. ADX is above 25 and rising. Price breaks above the high of the crossover candle. Stop loss placed below the most recent swing low.
Short entry: -DI crosses above +DI. ADX is above 25 and rising. Price breaks below the low of the crossover candle. Stop loss placed above the most recent swing high.
Exit rules are equally important. The primary exit is a reversal crossover — if you're long and -DI crosses above +DI, close the position. A secondary exit signal comes from ADX: if ADX peaks above 40 and then turns downward, the trend's momentum is fading. This doesn't mean an immediate reversal, but it's a strong cue to tighten your trailing stop or take partial profits.
Let's look at a practical example. Suppose GBP/USD on H4 shows +DI crossing above -DI at 1.2650 while ADX reads 27 and is trending upward. The crossover candle's high is 1.2680. You set a buy stop at 1.2682 (slightly above the high). Price breaks through the next candle — you're in. Stop loss goes at 1.2590, the swing low from two days prior. Over the next week, ADX climbs to 38, the gap between +DI and -DI widens, and price reaches 1.2820. Then ADX peaks at 42 and starts declining. You tighten your trailing stop to 1.2780. Eventually -DI crosses back above +DI at 1.2760 and you're stopped out with approximately 100 pips profit.
Backtest data on the S&P 500 using a 10-day DI crossover strategy showed an average trade gain of 0.42% with a profit factor of 1.71 — meaning for every dollar lost, $1.71 was gained. These aren't spectacular numbers, but they're consistent and they improve significantly when combined with the ADX filter and proper position sizing. The strategy was invested approximately 55% of the time, meaning nearly half the time you're in cash waiting for setups — which some traders see as a feature, not a bug.
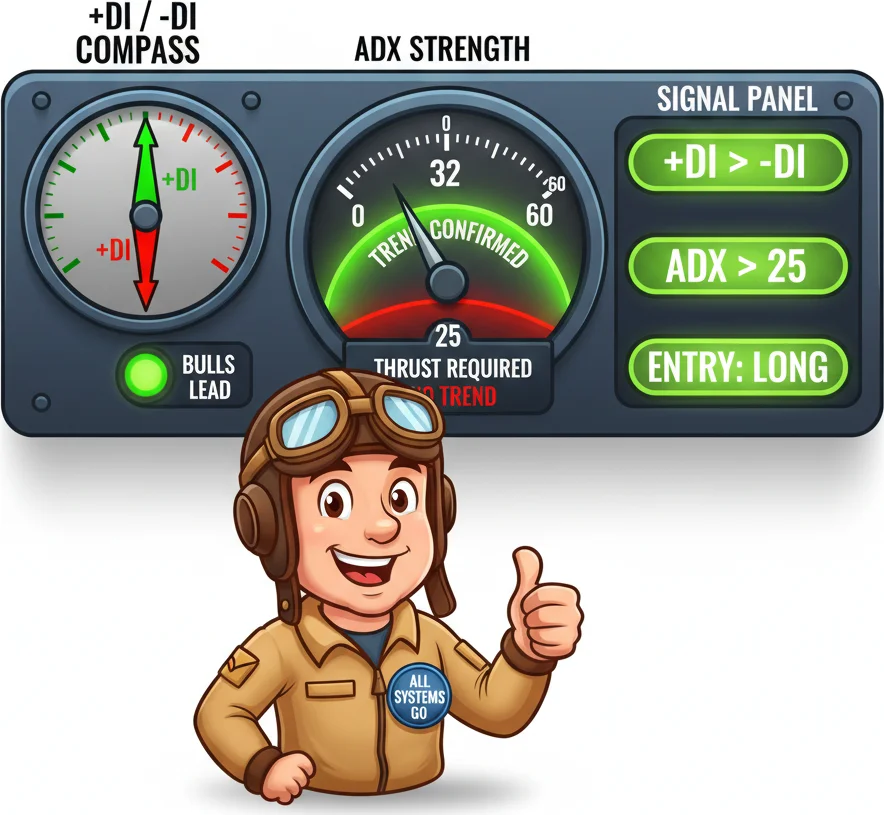
+DI above -DI? Bulls lead. -DI above +DI? Bears lead. ADX above 25? The trend is real. Three lines, one system.
4DMI vs ADX: Same Family, Different Jobs
This is the section that clears up one of the most common points of confusion in technical analysis. New traders constantly mix up DMI and ADX, use the terms interchangeably, or think they're completely unrelated indicators that just happen to appear on the same chart. None of those assumptions are correct.
Let's set the record straight with a simple analogy. Imagine you're watching a tug-of-war match. DMI (+DI and -DI) tells you which team is pulling harder and in which direction the rope is moving. ADX tells you how intense the contest is — are both teams pulling with everything they've got, or are they barely trying? You need both pieces of information to understand what's happening.
DMI is directional. It has two lines that move independently. +DI going up means bulls are gaining ground. -DI going up means bears are gaining ground. The crossover between them marks the moment one side takes the lead from the other. DMI answers the question: who's winning right now?
ADX is non-directional. It's a single line that only measures trend strength. An ADX of 35 tells you a strong trend is underway, but it says nothing about whether that trend is up or down. A rising ADX during a downtrend is just as significant as a rising ADX during an uptrend — both indicate the trend is gaining conviction. ADX answers the question: how strong is the current trend?
Here's where the math connects them. The DX (Directional Index) is calculated as the absolute difference between +DI and -DI, divided by their sum, times 100. ADX is simply a smoothed moving average of the DX values — typically over 14 periods. So ADX literally cannot exist without +DI and -DI. It's a derivative measure built on top of them.
Why does this matter for trading? Because using ADX alone means you're throwing away directional information. An ADX reading of 30 looks identical whether +DI is above -DI (bullish trend) or -DI is above +DI (bearish trend). Plenty of traders add ADX to their charts, see a rising value, and assume bullish momentum — that's a dangerous misread. Always check which DI line is on top before interpreting an ADX reading.
Conversely, using DMI crossovers without ADX means you're taking every directional shift signal regardless of whether the market has enough trending energy to follow through. In ranging markets, +DI and -DI cross back and forth repeatedly, generating whipsaw after whipsaw. ADX below 20 is your explicit warning that these crossovers are unreliable.
The naming convention adds to the confusion. On MetaTrader 5, the indicator is listed as "Average Directional Movement Index" and plots all three lines — +DI, -DI, and ADX. On TradingView, it's often called "Directional Movement" or "DMI." Some platforms label it simply "ADX" but still display the DI lines. Despite the different names, it's all the same Wilder system. If you see three lines with two crossing each other and one measuring their spread, you're looking at the complete Directional Movement System.
The practical takeaway: always use all three lines together. DMI for direction, ADX for confirmation. A +DI/-DI crossover with ADX above 25 and rising is a high-probability signal. The same crossover with ADX below 20 is a coin flip. A rising ADX confirms the crossover's validity. A flat or declining ADX undermines it. Wilder designed these as one system — splitting them apart defeats the purpose.
One more distinction worth understanding: ADX tends to lag behind DMI. The DI crossover happens first, then ADX starts rising as the trend develops. This means by the time ADX confirms the trend (reaching 25+), you've already missed some of the initial move. That's the tradeoff for higher signal quality — you sacrifice early entry for fewer false signals. Aggressive traders enter on the DMI crossover itself; conservative traders wait for ADX confirmation. Both approaches have merit depending on your risk tolerance.

DMI spots the trend direction while ADX measures how strong that trend actually is.
“Most DMI tutorials focus on crossovers and ignore absolute levels entirely.”
5Reading DMI Extremes: When +DI Hits 40+ (And What Happens Next)
Most DMI tutorials focus on crossovers and ignore absolute levels entirely. That's a mistake, because the actual values of +DI and -DI carry significant information about trend maturity and exhaustion.
Under normal market conditions, +DI and -DI typically oscillate between 10 and 30. Readings above 35 on either line are elevated. Readings above 40 are extreme. And when either +DI or -DI pushes above 45-50, you're looking at a market that has moved hard and fast in one direction — the kind of move that rarely sustains itself for much longer.
This isn't because DMI has built-in overbought or oversold levels like RSI. The indicator doesn't work that way. Instead, extreme DI readings reflect a statistical reality: directional movement that intense tends to mean-revert. A +DI above 40 means the vast majority of recent candles have been extending significantly above their predecessors' highs. That level of consistent upward pressure is unsustainable because it requires an unbroken stream of new buyers willing to push price higher on every single bar.
Here's what typically happens in practice. During a strong EUR/USD rally on the H4 chart, +DI might climb steadily from 18 to 32 over a week. The trend is healthy and building. Then news hits — a dovish Fed statement, say — and price surges. +DI spikes to 42. ADX rockets past 40. Everything looks incredibly bullish. And then... the rally stalls. Not because the trend reversed, but because the directional movement was so extreme that it exhausted the available buying pressure. Price consolidates or pulls back, +DI drops back to 25-30, and the trend either resumes at a more moderate pace or rolls over entirely.
The parallel holds for -DI. During a sharp selloff, -DI above 40 signals panic-level selling intensity. These moves often mark selling climaxes — the point where the last bears have piled in and the downside pressure is spent. Gold in March 2020 and the Swiss franc flash crash are historical examples where extreme -DI readings coincided with V-shaped reversals.
So how do you trade this? First, treat extreme DI readings as a warning, not a signal. A +DI above 40 doesn't mean you should immediately go short. The trend could continue — markets can stay irrational longer than you'd expect. Instead, use it as a risk management cue. If you're already long, tighten your trailing stop. Take partial profits. Move your stop to breakeven at minimum. The risk-reward of adding to a position when directional movement is this extreme is poor.
Second, watch what ADX does after an extreme DI reading. If ADX is above 40 and starts turning down while +DI is still elevated, that's your strongest exhaustion signal. The trend is losing its engine even though the last few candles looked powerful. This ADX rollover from extreme highs has historically preceded significant corrections across forex, equities, and commodities.
Third, combine extreme DI readings with support and resistance levels. A +DI spike above 40 that coincides with price hitting a major weekly resistance level is a much stronger exhaustion signal than the same DI reading in open space. The context amplifies the warning.
There's also a useful symmetry to watch for. After +DI spikes above 40 and then drops sharply, check whether -DI crosses above +DI soon after. That sequence — extreme +DI, rapid decline, then bearish crossover — frequently marks trend reversals on the H4 and D1 timeframes. It's the market going from euphoric buying to neutral to directional selling in a compressed timeframe.
One thing to keep in mind: extreme readings are relative to the instrument and timeframe. On highly volatile pairs like GBP/JPY, +DI above 40 happens more frequently than on EUR/USD. On D1 charts, extreme readings are rarer and more significant than on H1, where intraday volatility can push DI lines to extremes that reverse within hours. Calibrate your extremes to the specific market you're trading — look at the past 6-12 months of DI values to establish what counts as genuinely extreme for that instrument.
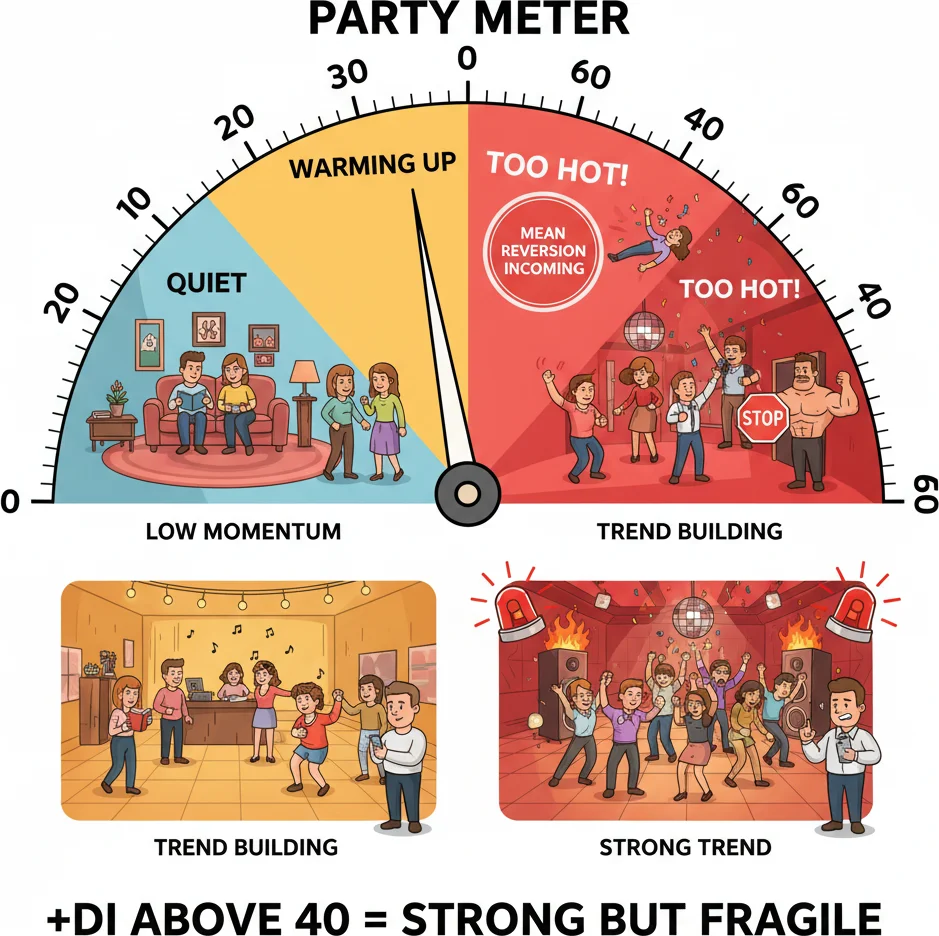
When +DI shoots above 40, the bulls are partying hard. History says the party usually does not last much longer.
Frequently Asked Questions
Q1What is the difference between DMI and ADX?
DMI consists of two lines (+DI and -DI) that show trend direction — which side, bulls or bears, currently has the upper hand. ADX is a single line derived from those DMI values that measures trend strength without indicating direction. An ADX of 35 means a strong trend exists, but you need to check whether +DI is above -DI (bullish) or -DI is above +DI (bearish) to know the direction. They are parts of the same system created by Wilder and work best when used together.
Q2What is the best DMI period setting for forex trading?
The default 14-period setting works well on H4 and D1 charts, which are the most popular timeframes for DMI-based strategies. On H1, consider increasing the period to 20-21 to filter out intraday noise, since 14 hourly candles covers less than two trading days. On D1, the 14-period lookback smooths about three weeks of price action, which aligns well with intermediate swing trends. Avoid reducing the period below 10, as the added sensitivity usually generates more false crossovers than useful signals.
Q3How do you trade DMI crossovers effectively?
The most reliable approach is to combine +DI/-DI crossovers with an ADX filter. Only take long signals when +DI crosses above -DI while ADX is above 25 and rising. Apply Wilder's extreme point rule: after a bullish crossover, note the high of the crossover candle and only enter when price breaks above it on a subsequent candle. Place your stop loss below the most recent swing low. Exit when the opposite crossover occurs or when ADX peaks above 40 and starts declining.
Q4Does DMI work in ranging or sideways markets?
No, DMI is specifically designed for trending markets and performs poorly in sideways conditions. When the market is ranging, +DI and -DI cross back and forth frequently, generating constant whipsaw signals. You can identify these low-probability environments by checking ADX: readings below 20 indicate a trendless market where DMI crossovers should be ignored. Wait for ADX to climb above 25 before acting on any DMI signals to avoid the bulk of false entries.
Q5What does it mean when +DI or -DI reaches extreme levels above 40?
A +DI or -DI reading above 40 indicates unusually intense directional pressure that is often unsustainable. While it confirms a strong trend is underway, it also warns that the move may be approaching exhaustion. If you are already in a position aligned with the extreme reading, it is a signal to tighten stops and consider taking partial profits rather than adding exposure. Watch the ADX line — if ADX has also been above 40 and starts turning downward while the DI line remains elevated, the trend's momentum is fading and a correction or reversal often follows.
Top Brokers
About the Author
Daniel Harrington
Senior Trading Analyst
Daniel Harrington is a Senior Trading Analyst with a MScF (Master of Science in Finance) specializing in quantitative asset and risk management. With over 12 years of experience in forex and derivatives markets, he covers MT5 platform optimization, algorithmic trading strategies, and practical insights for retail traders.
Use This Indicator
Risk Disclaimer
Trading financial instruments carries significant risk and may not be suitable for all investors. Past performance does not guarantee future results. This content is for educational purposes only and should not be considered investment advice. Always conduct your own research before trading.