Double Top/Bottom Pattern: Trading Guide 2024
Double Top/Bottom patterns form when price tests the same level twice and fails to break through, signaling potential trend reversals at key support or resistance.

Daniel Harrington
Senior Trading Analyst · MT5 Specialist
☕ 9 min read
Settings — Double
| Category | chart-pattern |
| Default Period | null |
| Best Timeframes | H1, H4, D1 |
Double Top and Double Bottom patterns rank among the most reliable chart formations in technical analysis, appearing across all asset classes with a documented completion rate of approximately 65-75% when confirmed by volume data. First codified by technical analysts in the early 20th century, these patterns form when price tests a critical level twice within a defined lookback window — set at 50 bars by default — and retreats both times, signaling exhaustion of the prevailing trend.
Key Takeaways
- The indicator scans a rolling 50-bar window and identifies two price peaks (Double Top) or two price troughs (Double Bot...
- A surprising number of traders act on the pattern before confirmation, which research from the Technical Analysis of Sto...
- The default 50-bar lookback performs differently across timeframes, and the distinction is significant for position sizi...
1How Double Top/Bottom Patterns Work: The Mechanics
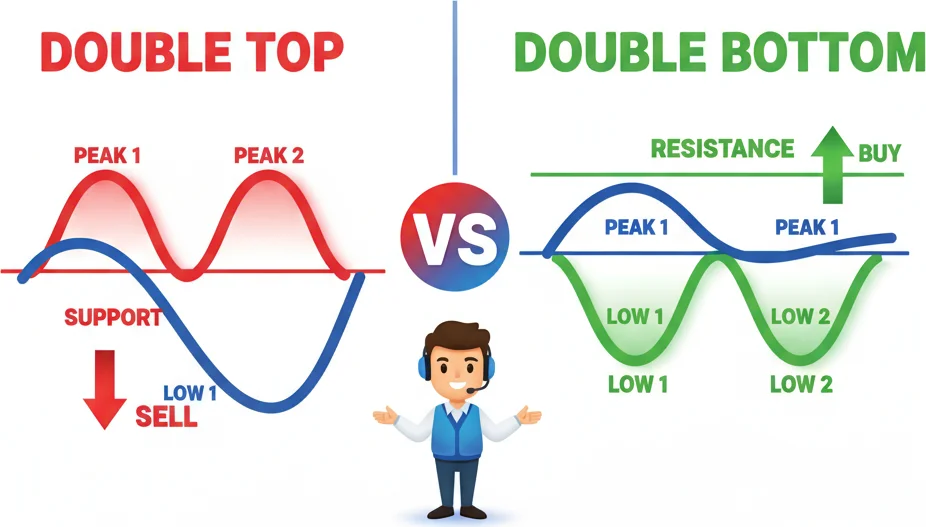
The indicator scans a rolling 50-bar window and identifies two price peaks (Double Top) or two price troughs (Double Bottom) that sit within a defined proximity threshold of each other — typically 0.5% to 2% price difference between the two swing points. The pattern is not confirmed until price breaks the 'neckline': the intervening trough between two peaks (for a Double Top) or the intervening peak between two troughs (for a Double Bottom).
The math is straightforward. The distance from the neckline to the two matching highs or lows defines the measured move target. If EUR/USD forms a Double Top with peaks at 1.1050 and a neckline at 1.0950, the projected target sits at 1.0850 — a 100-pip measured move mirrored below the neckline.
The 50-bar lookback parameter controls sensitivity. Shorter windows catch smaller, faster-forming patterns on intraday charts. Longer windows — achievable by increasing the parameter beyond 50 — filter for major structural turning points on daily or weekly charts. The range is technically unbounded, meaning the indicator adapts to any timeframe without fixed price thresholds.
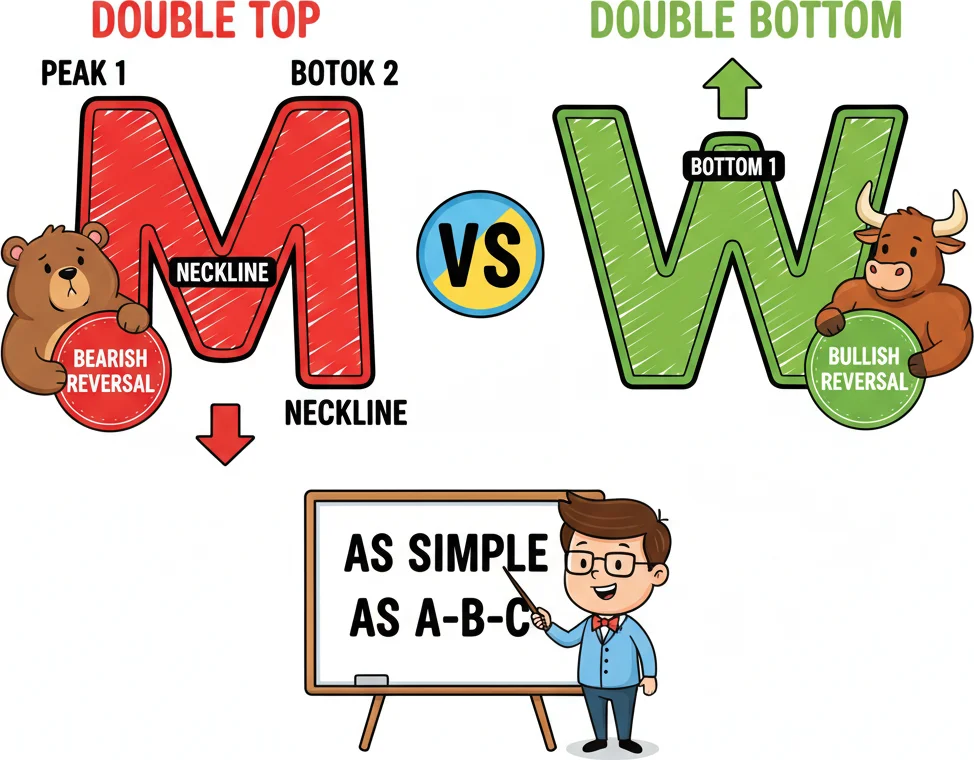
Double top is an M. Double bottom is a W. If you can read the alphabet, you can spot these patterns.
2Signal Interpretation: What Buy, Sell, and Divergence Mean
A surprising number of traders act on the pattern before confirmation, which research from the Technical Analysis of Stocks & Commodities journal attributes as the primary cause of false-signal losses in pattern-based strategies.
The confirmed sell signal on a Double Top triggers on a candle close below the neckline, not at the second peak. Entry at the second peak carries substantially higher failure risk — studies suggest up to 40% of apparent Double Tops resolve as continuation patterns when the neckline holds. The confirmed buy signal on a Double Bottom mirrors this logic: a candle close above the neckline activates the long thesis.
Divergence adds a second layer of confirmation. When price reaches the second top at a level equal to or slightly below the first top while momentum indicators (RSI, MACD) print lower highs, bearish divergence strengthens the reversal case. The inverse applies to Double Bottoms. Volume behavior matters equally: declining volume on the second peak of a Double Top, followed by expanding volume on the neckline break, represents the textbook high-confidence setup.
False breakouts occur most frequently when the two price extremes are separated by fewer than 10 bars — a pattern that forms too quickly to represent genuine supply/demand exhaustion.

When your double top signal finally confirms - plot twist, the trend is actually reversing!
“The default 50-bar lookback performs differently across timeframes, and the distinction is significant for position sizing and holding periods.”
3Optimal Settings by Timeframe: H1, H4, and D1 Compared
The default 50-bar lookback performs differently across timeframes, and the distinction is significant for position sizing and holding periods.
On the H1 chart, 50 bars covers approximately two trading days. Patterns complete faster — sometimes within 4 to 8 hours — but carry a higher noise-to-signal ratio. Scalpers and intraday traders using H1 may consider reducing the lookback to 30-40 bars to capture shorter-duration patterns, accepting more frequent signals with tighter stops.
H4 is the most commonly cited 'balanced' timeframe for this indicator. Fifty bars spans roughly 8-10 trading days, giving the pattern enough room to form genuine structural significance. The measured move targets on H4 Double Tops/Bottoms typically range from 50 to 200 pips on major forex pairs, providing workable risk-reward ratios of 1:1.5 to 1:2.5.
D1 charts with the default 50-bar lookback cover approximately 10 weeks of price action. These patterns are rare — perhaps 4 to 8 qualifying formations per year on a major pair like GBP/USD — but carry the strongest statistical follow-through. A D1 Double Top on GBP/USD in September 2023 near the 1.2750 resistance zone preceded a 400-pip decline over the following six weeks, illustrating the magnitude of moves these formations can precede.
For D1 analysis, increasing the lookback to 60-80 bars is worth testing, as it prevents the indicator from flagging shorter consolidation ranges as valid double-pattern structures.
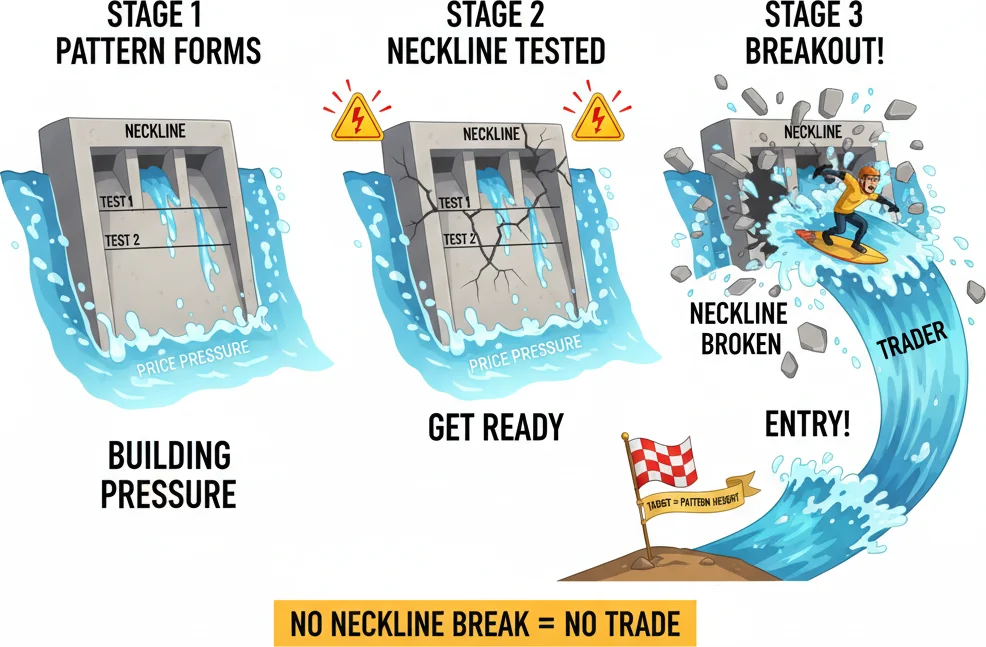
The two peaks or valleys are just the setup. The REAL signal is when the neckline breaks — that is your entry.
4Double Top vs Double Bottom: Asymmetric Behavior You Need to Know
Most guides treat Double Tops and Double Bottoms as mirror images. They are not. Markets fall differently than they rise, and this asymmetry has measurable consequences for how each version of the pattern performs.
Double Tops tend to complete faster than Double Bottoms. The time between the first and second peak is typically 20-35% shorter than the time between the first and second trough in a Double Bottom. The reason is psychological: fear moves markets faster than greed. When buyers fail to push through resistance a second time, the resulting selloff is often sharp and decisive. When sellers fail to break support a second time, the recovery tends to be more gradual — buyers step in cautiously rather than aggressively.
This timing difference affects how you manage the trade. Double Top breakdowns often deliver most of their measured move within the first 5-10 bars after the neckline break. Double Bottom breakouts tend to grind higher over a longer period, with pullbacks and retests along the way. For Double Tops, consider taking a larger initial position and securing profits quickly. For Double Bottoms, a scaled-in approach with patience for the measured move often works better.
Volume behavior also differs. In a textbook Double Top, volume on the second peak should be lower than the first — showing fading buying interest. But in Double Bottoms, the ideal volume signature is the opposite: higher volume on the second low suggests capitulation selling, which is actually bullish because it means the last sellers have been flushed out.
The 'Adam and Eve' variant adds another dimension. An Adam top (sharp, spike-like) followed by an Eve top (rounded, broader) typically produces stronger breakdowns than two sharp peaks or two rounded peaks. The combination of panic (Adam) followed by distribution (Eve) creates a more complete exhaustion of buying pressure. The same logic applies in reverse for bottoms: an Adam bottom followed by an Eve bottom is the strongest variant.
One last asymmetry: Double Bottoms overshoot their measured move targets more frequently than Double Tops. Bullish momentum tends to accelerate once resistance breaks, while bearish moves often decelerate as buyers step in at lower prices. Plan your take-profit levels accordingly — consider trailing a portion of Double Bottom positions beyond the measured move, while being more mechanical about taking profits at the target on Double Tops.

Double bottoms vs double tops - same pattern, complete opposite vibes like an UNO reverse!
“Identifying a Double Top or Bottom is the easy part.”
5Practical Trade Plan: From Pattern Detection to Exit
Identifying a Double Top or Bottom is the easy part. Converting it into a profitable trade requires a step-by-step process that handles the messy reality of execution.
Step 1: Validate the pattern structure. The two peaks (or troughs) must be within 0.5-2% of each other in price. Peaks separated by fewer than 10 bars are suspect — the pattern formed too quickly to represent genuine supply/demand exhaustion. Peaks separated by more than the lookback window (50 bars default) may no longer be structurally relevant. The sweet spot is 15-35 bars between peaks on H4 charts.
Step 2: Identify the neckline. For a Double Top, the neckline is the lowest point between the two peaks. For a Double Bottom, it's the highest point between the two troughs. Draw it as a horizontal line. If the price between the two peaks forms a V-shape, the neckline is obvious. If the price meandered, use the most significant trough (highest volume or sharpest reversal point) as your neckline.
Step 3: Wait for confirmation. The neckline break must be a full candle close, not just a wick. On H4, wait for the 4-hour candle to close before acting. On D1, wait for the daily close. Entering on an intrabar break increases your false breakout exposure substantially. RSI or MACD divergence at the second peak adds confidence — if the second peak shows weaker momentum than the first, the reversal thesis is stronger.
Step 4: Choose your entry approach. Aggressive entry: sell (or buy) at the close of the neckline-break candle. Conservative entry: wait for a retest of the broken neckline. The retest provides a better entry price and tighter stop, but it only occurs in roughly 50-60% of cases. A hybrid approach splits the position — half at the breakout, half on the retest — and captures both scenarios.
Step 5: Set stops and targets. Stop loss goes above the second peak (for Double Tops) or below the second trough (for Double Bottoms). This is the only stop placement that respects the pattern's logic — if price exceeds the second peak, the pattern has failed, period. The measured move target equals the distance from the neckline to the peaks, projected from the breakout point. On a EUR/USD H4 Double Top with peaks at 1.1050 and a neckline at 1.0950, the target is 1.0850.
Step 6: Manage the position. Consider taking 50% off at half the measured move and trailing the remainder with a stop at breakeven. Double Tops frequently pause at the 50% mark before continuing — locking in partial profits at that level protects against the pattern only partially completing. If volume expands on the breakdown and RSI enters oversold territory near the measured move target, the move is likely exhausting — close the remaining position rather than hoping for overextension.
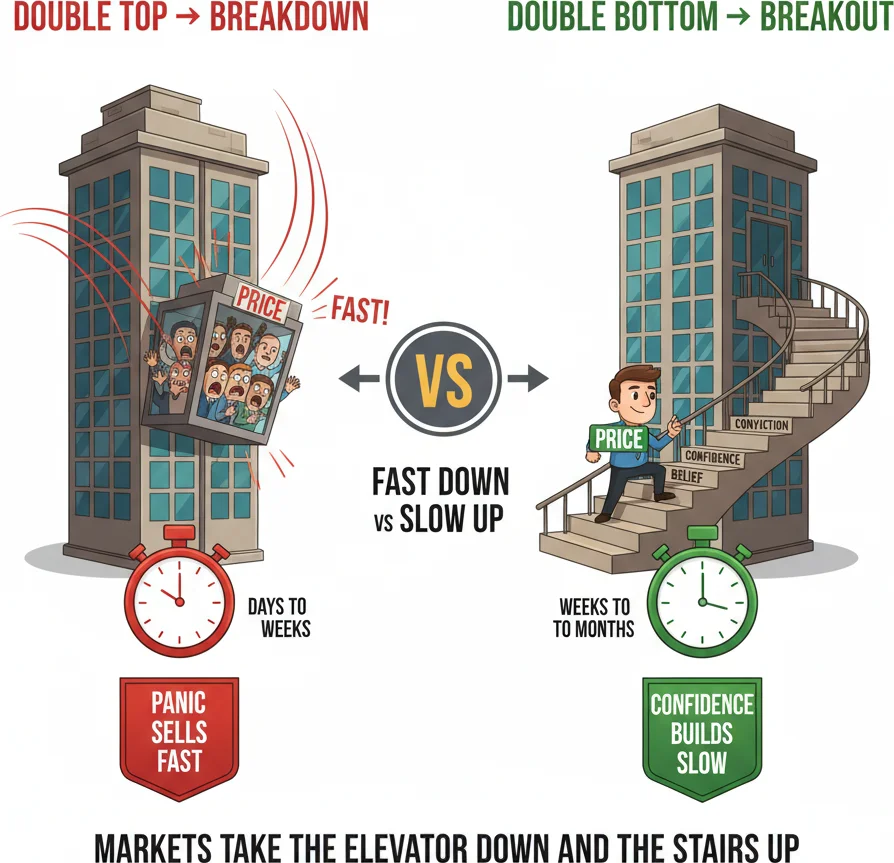
Double tops crash fast because panic sells. Double bottoms build slowly because confidence takes time.
Frequently Asked Questions
Q1How reliable is the Double Top pattern?
When confirmed by a neckline break and volume expansion, Double Tops complete their measured move approximately 65-75% of the time on daily charts. The reliability drops on shorter timeframes — H1 patterns complete at closer to 55-60% due to increased noise and false breakouts. The single biggest factor affecting reliability is whether you wait for the neckline break or attempt to trade the second peak directly. Trading the second peak without neckline confirmation has a failure rate of roughly 40%, since many apparent Double Tops resolve as continuation patterns.
Q2What is the difference between a Double Top and a trading range?
A Double Top has two distinct peaks at a similar price level with a meaningful pullback between them, followed by a neckline break that triggers a reversal. A trading range has multiple touches of both support and resistance without the definitive break. The key distinction is resolution: if price makes two highs, pulls back, then breaks the neckline, it's a Double Top. If price keeps bouncing between the highs and lows without breaking either boundary, it's a range. The 50-bar lookback helps filter this — patterns that take too long to resolve are more likely ranges than genuine Double Tops.
Q3Does the second peak need to be at exactly the same price as the first?
No — and it almost never is in practice. The two peaks should be within 0.5-2% of each other. A second peak slightly lower than the first is actually a marginally stronger bearish signal because it shows buyers couldn't even reach the prior high. A second peak slightly higher than the first (by less than 2%) can still be valid — this is sometimes called a 'double top with a marginal new high' and can trap breakout buyers who interpret the new high as bullish continuation, making the subsequent reversal even more powerful.
Q4How do you calculate the price target for a Double Top or Bottom?
Measure the vertical distance from the neckline to the two peaks (or troughs) and project that same distance from the neckline break in the breakout direction. For example: Double Top with peaks at 1.1050 and a neckline at 1.0950 gives a distance of 100 pips. The measured move target is 1.0850 — that 100 pips projected below the neckline. This target is a minimum expectation — strong Double Top breakdowns can exceed it, but it's the standard benchmark for the initial target and helps determine whether the risk-reward ratio justifies the trade.
Q5Can a Double Top fail and turn into a bullish breakout?
Absolutely. If price makes two peaks at resistance, pulls back, then rallies and closes convincingly above both peaks instead of breaking the neckline, the pattern has failed as a reversal. This failure becomes a potent bullish signal — all the traders who sold the second peak are now trapped short, and their forced buying as they cover adds fuel to the upside breakout. Some traders specifically look for failed Double Tops as long entry setups, using a stop just below the second pullback low and targeting at least the measured move above the broken resistance level.
Top Brokers
About the Author
Daniel Harrington
Senior Trading Analyst
Daniel Harrington is a Senior Trading Analyst with a MScF (Master of Science in Finance) specializing in quantitative asset and risk management. With over 12 years of experience in forex and derivatives markets, he covers MT5 platform optimization, algorithmic trading strategies, and practical insights for retail traders.
Use This Indicator
Risk Disclaimer
Trading financial instruments carries significant risk and may not be suitable for all investors. Past performance does not guarantee future results. This content is for educational purposes only and should not be considered investment advice. Always conduct your own research before trading.