Elder Force Index (EFI): Advanced Applications of Alexander Elder's Volume Tool
Elder Force Index multiplies the price change by volume to gauge the force behind each price move, with spikes indicating significant institutional activity.

Daniel Harrington
Senior Trading Analyst · MT5 Specialist
☕ 19 min read
Settings — EFI
| Category | volume |
| Default Period | 13 |
| Best Timeframes | H1, H4, D1 |
If you already know that the Force Index multiplies price change by volume and oscillates around zero, good — we are past the basics. This page is about what happens when you stop using the EFI as a simple crossover tool and start treating it as a diagnostic instrument for market health. Alexander Elder designed the Force Index as part of a broader trading system, not as a standalone signal generator, and the most powerful applications emerge when you use it that way. We are talking about detecting market regime changes before they show up on price alone, comparing force across different instruments in a portfolio, reading climactic volume spikes that mark exhaustion points, layering weekly and daily timeframes for high-probability entries, and combining the EFI with Elder-Ray (Bull Power and Bear Power) to build the complete Alexander Elder analytical framework. These are the techniques that separate traders who dabble with the Force Index from those who actually extract consistent edge from it.
Key Takeaways
- Most traders use the Force Index to confirm existing trends. That is fine, but it is like using a thermometer only to co...
- Here is something that surprises many traders: the Elder Force Index is one of the few indicators that can meaningfully ...
- When the Elder Force Index produces an extreme spike — a reading far outside its normal range — something significant ju...
1Beyond the Basics: EFI as a Market Regime Detector
Most traders use the Force Index to confirm existing trends. That is fine, but it is like using a thermometer only to confirm that summer is hot. The real value of a thermometer is telling you when the season is about to change — and the EFI can do the same thing for market regimes.
A market regime, in practical terms, is the dominant behavioral pattern: trending up, trending down, or range-bound. Each regime requires a fundamentally different approach. Trend-following strategies print money in directional regimes and bleed in ranges. Mean-reversion strategies thrive in ranges and get destroyed by trends. Knowing which regime you are in — and more importantly, when it is shifting — is arguably the highest-value skill in trading.
The 13-period EFI provides regime information through three observable behaviors:
Behavior 1 — Sustained polarity. When the 13-period EFI stays above zero for weeks at a time, only briefly dipping to the zero line before bouncing back, you are in a bullish regime. The market is consistently generating volume-weighted upward force. Every pullback attracts buyers with enough participation to overwhelm sellers. This is a trend-following environment — buy the dips, trail your stops, and let winners run.
The mirror applies for bearish regimes: the EFI camps below zero, and every bounce into positive territory is shallow and short-lived. Sellers dominate with volume behind them.
Behavior 2 — Zero-line oscillation. When the EFI chops back and forth across zero with no sustained period on either side — crossing every few bars, never building momentum in either direction — you are in a range-bound regime. Volume-weighted force is balanced. Neither bulls nor bears can establish dominance. This is where trend-following strategies get chopped to pieces, and where mean-reversion strategies (buying support, selling resistance) work best.
Here is the key diagnostic: count how many zero-line crosses the 13-period EFI produces in a 20-bar window. More than four crosses suggests a range regime. Fewer than two suggests a trending regime. It is a rough heuristic, but it works surprisingly well as a quick regime filter.
Behavior 3 — Regime transition signals. The most valuable — and most difficult — regime to catch is the transition itself. A market that has been range-bound for weeks suddenly breaks into a trend, or a strong trend exhausts itself and collapses into a range.
The EFI signals regime transitions through a specific pattern: after a prolonged period of zero-line oscillation (range regime), the EFI breaks decisively to one side and stays there. The first few bars of sustained positive or negative territory after a range period mark the birth of a new trend. Elder noted that divergences between the EFI and price become particularly meaningful when they coincide with a zero-line crossover — that combination often marks the precise moment a regime shift occurs.
Conversely, after a prolonged trending regime, watch for the EFI to start producing lower highs (in an uptrend) while price continues making higher highs. This is the classic divergence pattern, but in regime terms, it signals the transition from trending to range-bound. The trend is not necessarily reversing — it may simply be losing the volume-weighted momentum needed to sustain directional movement.
Practical regime detection framework on D1:
| EFI Pattern (13-period) | Regime | Strategy Implication |
|---|---|---|
| Sustained above zero, 10+ bars | Bullish trend | Trend-following: buy pullbacks |
| Sustained below zero, 10+ bars | Bearish trend | Trend-following: sell rallies |
| Frequent zero crosses (4+ per 20 bars) | Range-bound | Mean-reversion: fade extremes |
| Breakout from oscillation to sustained polarity | Regime transition | Increase position size, breakout entries |
| Divergence after sustained polarity | Trend exhaustion | Reduce exposure, tighten stops |
Why regime detection matters more than individual signals: A single EFI zero-line crossover might be right or wrong — that is the nature of any indicator signal. But correctly identifying the current regime improves the win rate of every other strategy you run. If you know the market is trending, you filter out counter-trend signals from all your indicators, not just the EFI. If you know the market is ranging, you stop chasing breakouts. The EFI does not need to provide perfect entry timing if it consistently keeps you on the right side of the regime divide.
One practical tip that makes this approach more robust: apply regime detection on the daily chart, then execute trades on H4 or H1. The daily EFI filters out the intraday noise that makes regime detection on lower timeframes unreliable. Once the daily chart tells you the regime, you can use any entry method you trust on the lower timeframe — the regime filter has already done the heavy lifting.
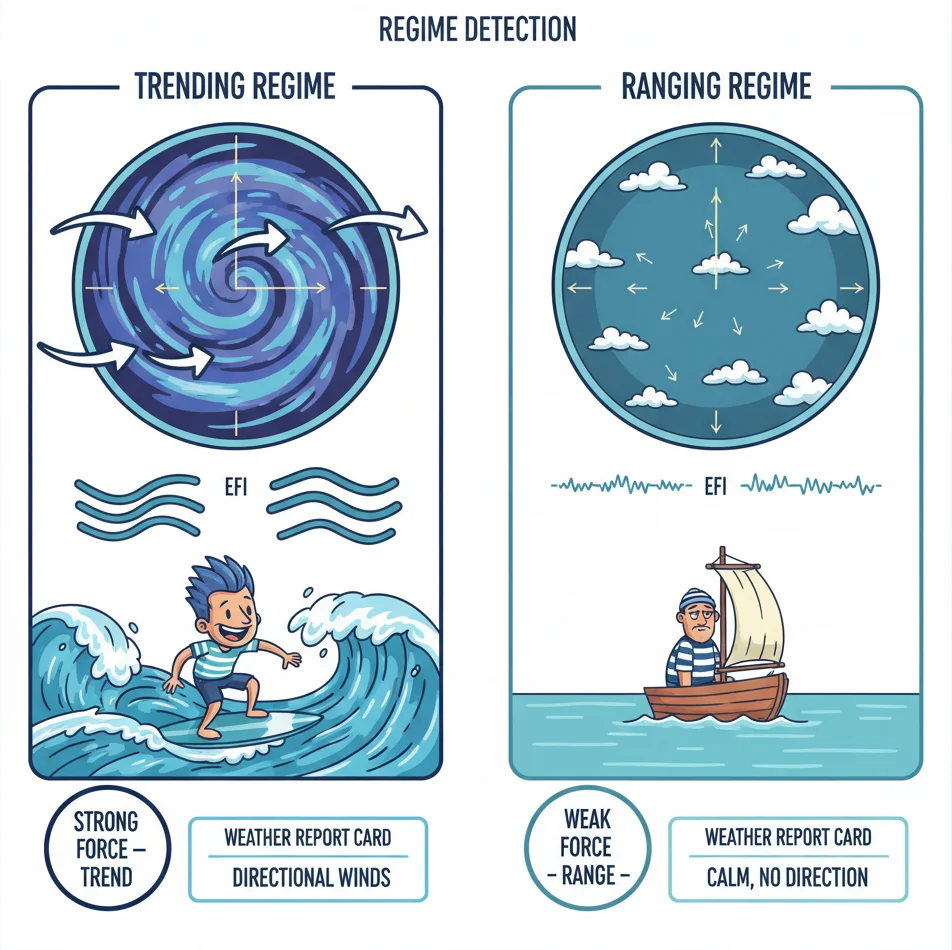
When EFI swings in wide arcs, the market is trending. When it oscillates in a tight band, you are in a range.
2EFI for Portfolio Management: Comparing Force Across Instruments
Here is something that surprises many traders: the Elder Force Index is one of the few indicators that can meaningfully compare momentum across completely different instruments — if you know how to normalize it. Most oscillators are self-contained. An RSI of 70 on EUR/USD and an RSI of 70 on gold both mean overbought, but you cannot say which instrument has stronger momentum. The Force Index, because it incorporates volume, opens the door to cross-instrument comparison. But you need to handle the scaling problem first.
The raw Force Index value depends on three factors: price level, price volatility, and volume scale. Gold at $2,000 per ounce with 200,000 contracts traded produces astronomically larger Force Index values than EUR/USD at 1.0800 with 15,000 tick volume counts. Comparing those raw numbers is meaningless — it would be like comparing the weight of an elephant and a mouse and concluding the elephant is more forceful. Well, obviously.
Normalization approach 1 — Percentage-based EFI. Instead of using (Close - Previous Close) x Volume, use ((Close - Previous Close) / Previous Close) x Volume. This converts the price change component from absolute pips to percentage change, which partially levels the playing field across instruments with different price levels. EUR/USD moving 0.5% on 10,000 ticks becomes comparable to gold moving 0.5% on 10,000 contracts. The volume component still differs in absolute terms, but the percentage normalization removes the price-level distortion.
Normalization approach 2 — Z-score EFI. Calculate the standard deviation of the EFI over a lookback period (50 or 100 bars works well), then express the current EFI value as a Z-score: (Current EFI - Mean EFI) / Standard Deviation of EFI. A Z-score of +2 means the current force reading is two standard deviations above its own average, regardless of whether the underlying instrument is EUR/USD, Nasdaq, or crude oil. This makes force readings directly comparable across any instrument.
How portfolio managers use normalized EFI:
Rotation signals. When you trade multiple instruments (say, six to eight major forex pairs), normalized EFI helps you allocate capital to the instruments with the strongest volume-backed momentum. If AUD/USD shows a normalized EFI of +2.1 while EUR/USD shows +0.4, the Australian dollar pair has significantly more bullish force behind it. All else equal, your long exposure should favor AUD/USD. This is basically momentum rotation with volume confirmation — and it tends to outperform pure price-momentum rotation because it filters out low-conviction moves.
Divergence across correlated instruments. EUR/USD and GBP/USD are positively correlated. If both are rallying but EUR/USD shows a rising normalized EFI while GBP/USD shows a falling one, the euro rally has more force behind it. This divergence between correlated pairs can signal which one to favor for new positions and which one might reverse first.
Sector or asset class comparison. For traders working across asset classes — forex, indices, commodities — normalized EFI identifies which asset class is attracting the most volume-weighted momentum at any given time. During risk-on periods, equity indices typically show stronger positive EFI than safe-haven currencies. During risk-off, gold and JPY pairs tend to dominate. Tracking these shifts with normalized EFI gives you an empirical, volume-backed read on market sentiment rather than relying on subjective interpretation.
| Portfolio Application | What Normalized EFI Tells You | Action |
|---|---|---|
| Rotation among similar instruments | Which has the most volume-backed momentum | Overweight strongest, underweight weakest |
| Correlated pair divergence | Which pair has more genuine conviction | Favor the one with stronger force |
| Cross-asset sentiment | Where capital is flowing with the most participation | Align with the dominant flow |
| Risk management | Which positions have declining force behind them | Tighten stops on weakening instruments |
Important caveat — tick volume vs. real volume matters here. Cross-instrument comparison is most reliable when all instruments use the same type of volume data. Comparing a forex pair (tick volume) against a futures index (real volume) introduces distortion even after normalization. Compare forex to forex, futures to futures. Mixing volume types undermines the exercise.
The normalization lookback period also matters. A 50-bar lookback on D1 captures roughly two months of data, suitable for swing and position traders. Day traders on H1 might need 20-30 bars to keep the normalization responsive. Match the lookback to your typical holding period.
This portfolio application is one of the most underutilized aspects of the EFI. Elder himself was a portfolio thinker who traded multiple markets simultaneously. The Force Index, once normalized, is uniquely suited for cross-instrument comparison because no other common indicator combines directional momentum and volume participation in a single number.

When comparing EFI across your portfolio - more layers means better force analysis!
“When the Elder Force Index produces an extreme spike — a reading far outside its normal range — something significant just happened.”
3EFI Spike Analysis: Reading Climactic Volume Events
When the Elder Force Index produces an extreme spike — a reading far outside its normal range — something significant just happened. A large number of market participants committed capital in a short period, producing a surge in both price movement and volume that lights up the indicator like a flare. These climactic events are some of the most actionable signals the EFI produces, but only if you interpret them correctly.
The first thing to understand: not all spikes mean the same thing. A spike in the direction of the existing trend has different implications than a spike against the trend. And a spike after a prolonged move means something different from a spike at the start of a move. Context determines whether a spike signals continuation, exhaustion, or reversal.
Exhaustion spikes — the most profitable pattern.
After a sustained uptrend, the EFI produces an unusually large positive spike. Price rockets higher on massive volume, the Force Index hits a reading well above anything seen in the preceding weeks, and it feels like the trend is accelerating. Counterintuitively, this is often the end, not the middle, of the move.
Why? Because climactic volume at the end of a trend typically represents the last wave of buyers piling in — often retail traders who finally got convinced the trend would last forever. Smart money, meanwhile, is selling into this buying frenzy, transferring their positions to the latecomers. The spike in volume is not new demand driving the trend further; it is old demand being satisfied by willing sellers at premium prices.
That massive positive spike often marks the exact point of maximum participation and maximum complacency. Within days, the Force Index collapses back toward zero — and often overshoots into negative territory as buying pressure evaporates entirely.
How to identify an exhaustion spike:
- The spike must occur after a sustained trend (at least 15-20 bars of directional movement on the 13-period EFI).
- The spike reading should be significantly above the recent range — at least 1.5x to 2x the previous highest reading in the current trend.
- The bar (or cluster of 2-3 bars) that produces the spike should show a large price range and heavy volume.
- Most critically: after the spike, the EFI should fail to sustain those elevated levels and collapse back toward zero within 3-5 bars.
If conditions 1-3 are met but condition 4 is not (the EFI stays elevated), you do not have an exhaustion spike — you have a momentum acceleration, which is bullish, not bearish. This distinction is critical. Never front-run an exhaustion spike; wait for the collapse back to zero.
Initiation spikes — catching the beginning of a move.
The opposite of an exhaustion spike is an initiation spike: a large EFI reading that occurs at the beginning of a new trend, typically after a prolonged range-bound period. Price breaks out of consolidation on heavy volume, the EFI surges from near-zero to a significant positive (or negative) reading, and unlike the exhaustion spike, the EFI sustains its elevated polarity rather than collapsing.
Initiation spikes work because a breakout on heavy volume indicates genuine institutional participation. The EFI spike confirms that the breakout is backed by real force, not just a stop-hunt or low-liquidity drift.
| Spike Type | Context | EFI Behavior After Spike | Trading Implication |
|---|---|---|---|
| Exhaustion spike | End of extended trend | Rapid collapse to zero/reversal | Prepare to exit or reverse |
| Initiation spike | Breakout from consolidation | Sustained elevated reading | Enter in direction of spike |
| Counter-trend spike | Brief spike against the trend | Quick return to trend-side polarity | Ignore — trend likely continues |
| News spike | Around economic data releases | Highly variable, often whipsaws | Wait for dust to settle |
Counter-trend spikes — the false alarm.
During a strong downtrend, the EFI occasionally produces a sharp positive spike. This looks dramatic but usually represents short-covering or bargain hunting, not a genuine reversal. The tell is what happens next: if the positive spike is immediately followed by the EFI falling back below zero within 2-3 bars, the downtrend is intact. The filter is simple: after a spike against the prevailing trend, require the EFI to sustain its new polarity for at least 5 bars before concluding that the trend has actually reversed.
Quantifying what counts as a spike.
Since the EFI is unbounded, you need a statistical framework to define extremes. The most practical method: calculate a Bollinger Band envelope around the EFI itself (20-period moving average plus/minus 2 standard deviations). Any reading that pierces the band qualifies as a spike. This automatically adjusts for different instruments and timeframes.
A simpler alternative: any EFI reading more than 2x the 20-period average of absolute EFI values is a spike. Less elegant but easier to implement mentally.
Either way, the spike itself is only the first half of the signal. What the EFI does in the 3-5 bars after the spike — sustain or collapse — completes the picture. Think of the spike as the question and the follow-through as the answer.
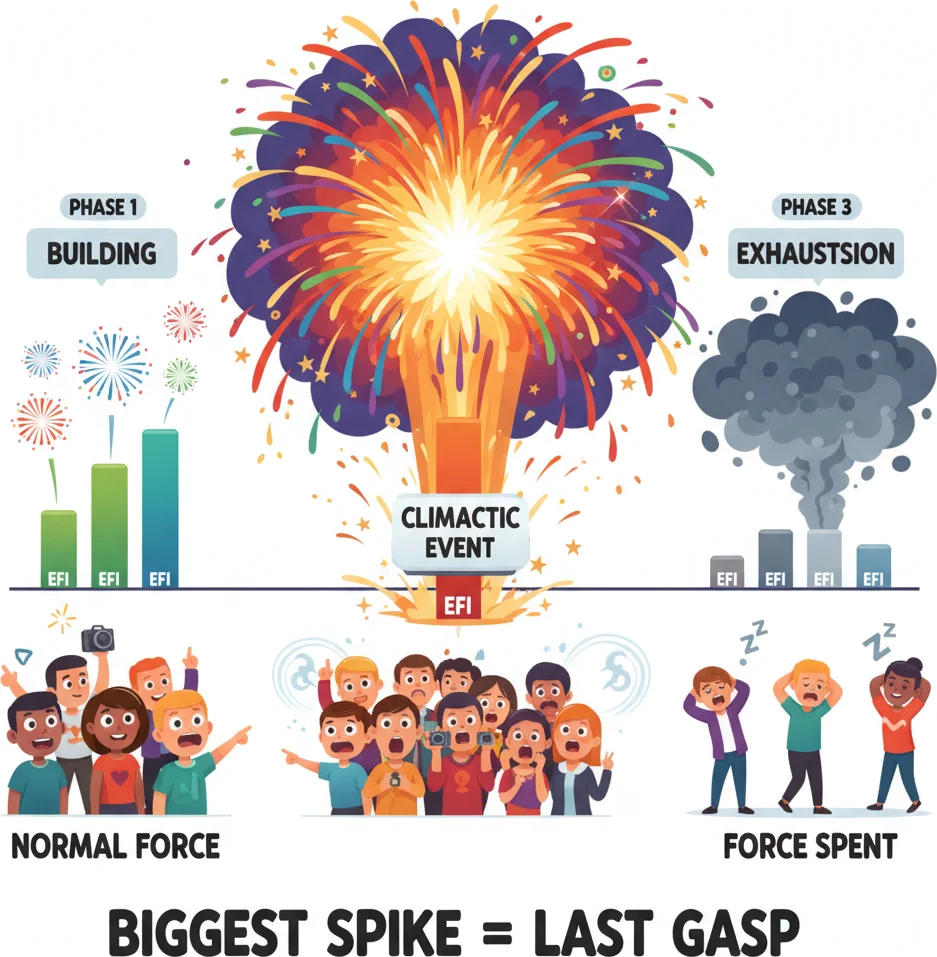
A massive EFI spike means extreme force was spent in one burst. Like a sprinter who gives everything in the first 50 meters.
4Multi-Timeframe EFI: Weekly Direction, Daily Timing
Alexander Elder was a multi-timeframe trader long before the concept became mainstream. His Triple Screen trading system, introduced alongside the Force Index, explicitly required analyzing three timeframes before taking a trade. The Force Index fits naturally into this framework, and using it across timeframes is arguably the most reliable way to trade with it.
The core principle is simple: higher timeframes set the direction, lower timeframes provide the timing. You never fight the higher timeframe, and you never chase the lower timeframe. The EFI on the higher chart tells you which side to be on; the EFI on the lower chart tells you when to pull the trigger.
The weekly-daily combination.
This is the classic Elder setup for position traders and swing traders working the daily chart.
Step 1 — Weekly EFI establishes direction. Apply the 13-period EFI to the weekly chart. When it is above zero, the medium-term trend is bullish — only look for buying opportunities. When it is below zero, only look for selling opportunities. This is your strategic filter. It changes infrequently (a weekly EFI crossover happens maybe four to six times per year on a major pair), which means your directional bias stays stable for weeks at a time.
Step 2 — Daily EFI provides entry timing. With the weekly direction established, switch to the daily chart and apply the 2-period EFI. In a bullish weekly regime, wait for the daily 2-period EFI to dip below zero — this means that on a daily basis, sellers briefly gained the upper hand, creating a pullback within the larger weekly uptrend. Buy when the 2-period daily EFI turns back positive. Your entry catches the pullback recovery with the backing of the weekly trend.
In a bearish weekly regime, the mirror applies: wait for the daily 2-period EFI to spike above zero (a brief daily bounce) and sell when it turns negative again.
Why this works better than single-timeframe analysis:
Single-timeframe EFI signals suffer from context blindness. A bullish zero-line crossover on the daily chart might be a genuine trend continuation — or it might be a counter-trend bounce within a bearish weekly environment. Without the weekly context, you cannot distinguish between the two. The multi-timeframe approach eliminates this ambiguity by anchoring every daily signal to the weekly trend.
Elder used a helpful analogy: the weekly chart is like the tide, and the daily chart is like the waves. You want to swim with the tide, not against it. A wave going against the tide (a daily pullback against the weekly trend) is your opportunity to enter in the direction of the larger force.
The daily-H4 combination (for more active traders).
Traders who find the weekly-daily pace too slow can compress the framework: use the daily 13-period EFI for direction and the H4 2-period EFI for timing. This produces more frequent signals — roughly one to three per week per major pair — while maintaining the multi-timeframe discipline.
| Timeframe Combination | Direction Timeframe | Entry Timeframe | Signal Frequency | Suited For |
|---|---|---|---|---|
| Weekly / Daily | Weekly 13-period EFI | Daily 2-period EFI | 1-3 per month | Position traders |
| Daily / H4 | Daily 13-period EFI | H4 2-period EFI | 1-3 per week | Swing traders |
| H4 / H1 | H4 13-period EFI | H1 2-period EFI | 2-5 per week | Active swing traders |
Entry rules for the multi-timeframe system:
-
Higher-timeframe 13-period EFI must be clearly on one side of zero — not waffling near the line. No direction means no trade.
-
Lower-timeframe 2-period EFI must dip to the opposite side of zero from the higher-timeframe bias. This countertrend dip is your entry setup.
-
Enter when the lower-timeframe 2-period EFI crosses back to the side of the higher-timeframe trend.
-
Stop-loss goes beyond the recent swing extreme created by the pullback.
-
Hold until the higher-timeframe EFI changes polarity or until the lower-timeframe EFI produces a trailing exit signal.
The alignment bonus.
The highest-probability trades occur when all three elements align: the higher-timeframe EFI is strongly on one side of zero (not just barely positive but clearly elevated), the lower-timeframe EFI has produced a clean pullback to the opposite side and is now crossing back, and the price chart shows the pullback touching a meaningful support or resistance level. When the EFI multi-timeframe setup aligns with a clear price structure, you have volume-weighted momentum, trend direction, and technical structure all pointing the same way. Those trades deserve your largest position sizes.
One small quality-of-life improvement: rather than manually checking weekly and daily charts, set up alerts on your platform for when the weekly 13-period EFI crosses zero (that changes your strategic bias) and when the daily 2-period EFI crosses zero in the counter-trend direction (that alerts you to a potential entry setup). This turns the multi-timeframe approach from a labor-intensive screen-watching exercise into an event-driven system where you only engage when the conditions are right.

When your weekly EFI direction perfectly times your daily entry - surprise success!
“Alexander Elder did not design the Force Index in isolation.”
5EFI Combined with Elder-Ray: The Complete Alexander Elder Toolkit
Alexander Elder did not design the Force Index in isolation. He created an entire ecosystem of analytical tools that work together as a unified trading system. The Elder-Ray indicator — which measures Bull Power and Bear Power — is the natural companion to the Force Index, and combining the two gives you the most complete picture of market dynamics that Elder's framework offers.
Let us quickly establish what Elder-Ray does.
Elder-Ray basics:
-
Bull Power = High of the bar minus the 13-period EMA. It measures how far buyers pushed price above consensus value. The larger the value, the stronger the buying pressure.
-
Bear Power = Low of the bar minus the 13-period EMA. It measures how far sellers pushed price below consensus. Normally negative; the more negative, the stronger selling pressure.
The 13-period EMA represents the market's consensus of value. Bull Power and Bear Power measure how far each side pushes price away from that consensus.
Why combine EFI and Elder-Ray?
They answer different questions:
- EFI answers: How much net force (price change x volume) are bulls or bears generating? It is a volume-weighted directional measurement.
- Elder-Ray answers: How far can bulls push above the average, and how far can bears push below it? It measures buying and selling pressure relative to a moving baseline.
Used together, you get four dimensions of information: net directional force (EFI), volume participation (EFI), buying pressure above consensus (Bull Power), and selling pressure below consensus (Bear Power). No single indicator gives you all four.
The combined framework — Elder's original approach:
Elder recommended using these tools together in his Triple Screen system, which works in three steps:
Screen 1 — Trend identification (weekly chart). Use the 13-period EMA slope or the weekly MACD histogram to identify the trend direction. You could substitute the weekly 13-period EFI here — if it is above zero, the trend is up; below zero, the trend is down.
Screen 2 — Counter-trend entry setup (daily chart). In a weekly uptrend, use the daily Elder-Ray Bear Power to identify pullbacks. When Bear Power dips below zero (sellers pushed the daily low below the EMA), a buying opportunity is forming. In a weekly downtrend, use daily Bull Power above zero to identify bounce setups for shorting.
Screen 3 — Precise entry timing (daily or intraday). Use the 2-period EFI to time the exact entry. In a weekly uptrend where daily Bear Power is negative (pullback in progress), buy when the 2-period EFI crosses back above zero — that is the precise moment force shifts back to the bulls.
This three-screen approach uses Elder-Ray for setup identification and EFI for timing. The Force Index tells you when the pullback is ending; Elder-Ray tells you that a pullback worth trading has occurred.
Practical signal combinations:
| EFI Signal | Elder-Ray Signal | Combined Interpretation | Action |
|---|---|---|---|
| EFI crossing above zero | Bear Power rising from deep negative | Pullback ending, bulls reasserting | Strong buy signal |
| EFI positive and rising | Bull Power expanding | Uptrend with growing buyer aggression | Hold longs, consider adding |
| EFI positive but declining | Bull Power shrinking | Uptrend losing buyer enthusiasm | Tighten stops |
| EFI crosses below zero | Bull Power goes negative | Trend reversal likely | Exit longs, potential short |
| EFI negative, Bear Power deeply negative | Both indicators bearish | Strong downtrend, no buying interest | Stay short or stay out |
The divergence cross-check.
One of the most powerful uses of the combined toolkit is cross-checking divergence signals. If you spot a bearish divergence on the EFI (price making higher highs, EFI making lower highs), check whether Bull Power confirms it. If Bull Power is also making lower highs — meaning buyers are pushing less far above the EMA on each successive rally — you have independent confirmation from two different Elder indicators that the uptrend is losing steam. That double confirmation is significantly more reliable than divergence from either indicator alone.
Similarly, bullish divergence on both EFI (higher lows while price makes lower lows) and Bear Power (less negative readings while price falls further) creates a compelling case that selling pressure is genuinely exhausting itself.
Setting up the Elder toolkit on MT5:
On MT5, Force Index lives under Indicators > Oscillators > Force Index, and Bulls Power / Bears Power are in the same folder. Set all to 13-period for consistency. A practical layout: price chart on top with a 13-period EMA overlay, Force Index in the first sub-window, Bull Power and Bear Power sharing the second sub-window.
When the indicators disagree.
The most informative moments come when EFI and Elder-Ray tell different stories. EFI is positive (net force is bullish) but Bear Power is becoming more negative (sellers push further below the EMA on each bar). This suggests that while the overall balance still favors bulls, sellers are growing more aggressive on each pullback. It is not a sell signal, but it is a warning to watch your position closely.
The Force Index gives the macro verdict (which side has more force). Elder-Ray provides the micro detail (how aggressively each side pushes from the consensus line). Together, they create a three-dimensional picture of market dynamics — one of the few complete indicator systems designed by a single mind with a coherent theory behind every component.

Elder built Force Index for power and Elder-Ray for direction. Together they are his complete market X-ray system.
Frequently Asked Questions
Q1What is the difference between the Elder Force Index (EFI) and the regular Force Index?
They are fundamentally the same indicator — both use the formula (Current Close - Previous Close) x Volume, smoothed with an EMA. The name Elder Force Index simply credits the creator, Alexander Elder, and is often used interchangeably with Force Index. The distinction on this page is about application level: the basic Force Index page covers the formula, zero-line crossovers, divergence, and tick volume considerations. This page focuses on advanced techniques like regime detection, portfolio-level comparison, spike analysis, multi-timeframe systems, and combining EFI with other Elder indicators.
Q2Can I use the Elder Force Index on forex pairs even though there is no real volume data?
Yes, with realistic expectations. Forex charts use tick volume (number of price changes per bar) instead of actual traded volume. Research shows tick volume correlates above 90% with real volume, so the EFI still captures relative differences between high-activity and low-activity periods. The advanced techniques on this page — regime detection, spike analysis, multi-timeframe setups — all work with tick volume because they rely on relative changes in force, not absolute volume levels. Just avoid comparing raw EFI values between forex pairs and exchange-traded instruments with real volume data.
Q3What is the best EMA period for the Elder Force Index?
Elder recommended two specific periods: 2 and 13. The 2-period EFI is a short-term timing tool for catching pullbacks within established trends — it crosses zero frequently and is best used for precise entries. The 13-period EFI is a medium-term trend confirmation tool that reveals sustained shifts in volume-weighted momentum. For the advanced applications covered here (regime detection, spike analysis, portfolio comparison), the 13-period is the workhorse. Some traders use longer periods like 50 or 100 for very long-term trend analysis, but these stray from Elder's original design.
Q4How do I combine the Elder Force Index with Elder-Ray (Bull Power and Bear Power)?
Use them in complementary roles. The EFI measures net directional force with volume, answering whether bulls or bears are winning overall. Elder-Ray measures how far buyers push above the 13-period EMA (Bull Power) and how far sellers push below it (Bear Power), showing the aggression of each side relative to consensus value. In practice, use the weekly EFI for trend direction, daily Elder-Ray Bear Power to identify pullbacks in uptrends (or Bull Power for bounces in downtrends), and the 2-period daily EFI to time the exact entry when force shifts back to the trend side.
Q5How do I tell the difference between an exhaustion spike and an initiation spike on the EFI?
Context and follow-through are the two keys. An exhaustion spike occurs after a prolonged trend and is typically the largest EFI reading of the entire move — it marks the climactic final push where the last wave of participants piles in. After the spike, the EFI collapses back toward zero within 3-5 bars. An initiation spike occurs after a range-bound period as price breaks out of consolidation. Unlike an exhaustion spike, the EFI sustains its elevated reading after the initial surge, confirming that the breakout has genuine volume-backed force behind it. Never act on the spike itself — wait to see whether the EFI sustains or collapses in the bars that follow.
Top Brokers
About the Author
Daniel Harrington
Senior Trading Analyst
Daniel Harrington is a Senior Trading Analyst with a MScF (Master of Science in Finance) specializing in quantitative asset and risk management. With over 12 years of experience in forex and derivatives markets, he covers MT5 platform optimization, algorithmic trading strategies, and practical insights for retail traders.
Use This Indicator
Risk Disclaimer
Trading financial instruments carries significant risk and may not be suitable for all investors. Past performance does not guarantee future results. This content is for educational purposes only and should not be considered investment advice. Always conduct your own research before trading.