Elliott Wave Indicator: Complete Trading Guide
Elliott Wave theory identifies recurring fractal wave patterns (five impulse waves and three corrective waves) driven by crowd psychology to forecast price direction.

Daniel Harrington
Senior Trading Analyst · MT5 Specialist
☕ 8 min read
Settings — EW
| Category | custom |
| Default Period | null |
| Best Timeframes | H4, D1, W1 |
Elliott Wave theory, formalized by Ralph Nelson Elliott in 1938, organizes price action into 8-wave sequences that repeat across every timeframe from 1-minute charts to multi-decade market cycles. Studies of major equity indices show these patterns completing with roughly 60–70% structural accuracy when wave counts align with volume confirmation — making it one of the most cited forecasting frameworks among institutional technical analysts.
Key Takeaways
- The core structure consists of exactly 8 waves: 5 impulse waves (labeled 1–5) moving in the direction of the primary tre...
- Counterintuitively, the highest-probability entry in Elliott Wave analysis is not at Wave 1 — it is at the start of Wave...
- Elliott Wave carries no adjustable numeric parameters — the 'settings' are the timeframe itself, which determines which ...
1How Elliott Wave Theory Works: The Math Behind the Pattern
The core structure consists of exactly 8 waves: 5 impulse waves (labeled 1–5) moving in the direction of the primary trend, followed by 3 corrective waves (labeled A–B–C) moving against it. Each wave subdivides into smaller versions of the same pattern — a fractal property that Elliott identified decades before Mandelbrot formalized fractal geometry in 1975.
The Fibonacci sequence underpins the proportional relationships between waves. Wave 2 typically retraces 50%, 61.8%, or 78.6% of Wave 1. Wave 3 — the strongest impulse — extends to 161.8% or 261.8% of Wave 1's length in the majority of textbook setups. Wave 4 retraces 23.6% to 38.2% of Wave 3, and Wave 5 often equals Wave 1 in length or extends to 61.8% of the combined Wave 1 and Wave 3 distance.
Corrective waves follow their own sub-rules. A zigzag correction (5–3–5) differs structurally from a flat correction (3–3–5) or a triangle (3–3–3–3–3). Misidentifying the corrective pattern accounts for most Elliott Wave forecasting errors.
The practical implication: wave counts provide probabilistic price targets, not certainties. A confirmed Wave 3 extension toward the 161.8% Fibonacci level gives a measurable price objective — a distinct advantage over indicators that only signal direction without magnitude.
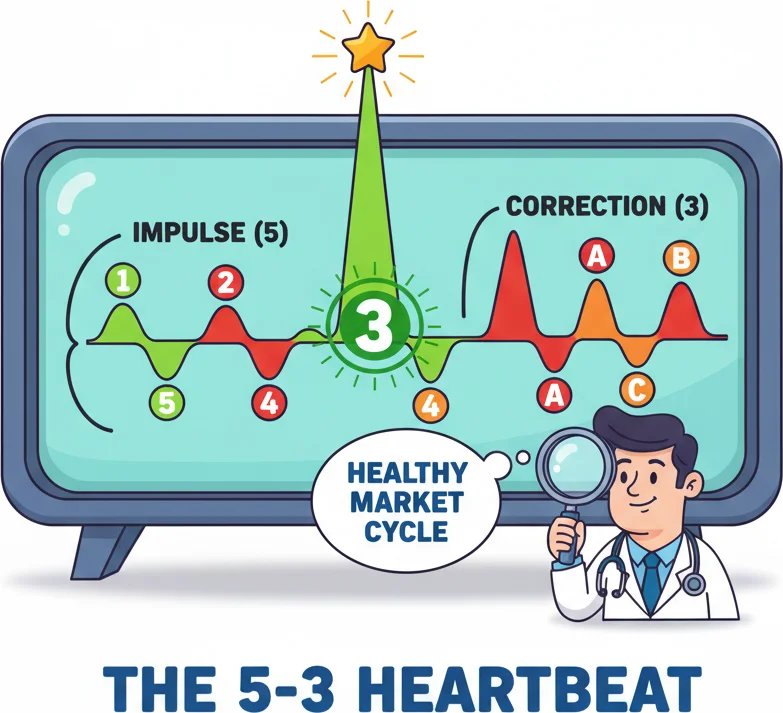
Five waves up, three waves down. That eight-wave cycle is the heartbeat of every market according to Elliott.
2Elliott Wave Signal Interpretation: Buy, Sell, and Invalidation Levels
Counterintuitively, the highest-probability entry in Elliott Wave analysis is not at Wave 1 — it is at the start of Wave 3, after Wave 2 completes its retracement.
Buy signals emerge when Wave 2 pulls back into the 50%–61.8% Fibonacci zone of Wave 1 and price shows a reversal structure (a completed A–B–C correction). The invalidation rule is absolute: if price breaches the origin of Wave 1, the wave count is wrong. That level functions as a hard stop.
Sell signals appear in two scenarios. First, at the completion of Wave 5, where momentum divergence frequently occurs — price makes a new high while oscillators such as RSI or MACD post a lower high. This 5th-wave divergence is one of the more reliable reversal signals across technical analysis. Second, within corrective sequences, Wave B of an A–B–C correction offers a counter-trend short entry, with Wave C targeting the 100%–161.8% extension of Wave A.
Invalidation levels are what separate Elliott Wave from vague pattern recognition. Every wave count carries a specific price level that, if broken, disproves the current count. Traders using Pulsar Terminal can set multi-level SL/TP orders directly at these invalidation and target levels, converting the wave structure into a structured risk management framework without manual recalculation.
Divergence between Wave 5 and momentum indicators has been documented across equity, forex, and commodity markets. A 2019 study published in the Journal of Technical Analysis found momentum divergence at wave termination points preceded reversals of 3% or more in 58% of cases across 12 major forex pairs.

When Elliott Wave signals align perfectly and you spot that Wave 3 setup!
“Elliott Wave carries no adjustable numeric parameters — the 'settings' are the timeframe itself, which determines which degree of wave cycle is being analyzed.”
3Optimal Elliott Wave Settings by Timeframe: H4, D1, and W1
Elliott Wave carries no adjustable numeric parameters — the 'settings' are the timeframe itself, which determines which degree of wave cycle is being analyzed.
The H4 (4-hour) chart captures Minor and Minute degree waves, typically completing full 8-wave cycles over days to weeks. This timeframe generates the most frequent trade setups but also the most ambiguous wave counts, since intraday noise can distort corrective structures. Confirmation from the D1 trend direction is standard practice before acting on H4 counts.
The D1 (daily) chart is the most widely cited timeframe for Elliott Wave analysis among professional analysts. Intermediate degree waves complete over weeks to several months, giving enough price data to identify wave structures with higher confidence. Fibonacci retracement levels drawn on D1 charts align with institutional order flow zones more reliably than on shorter timeframes.
The W1 (weekly) chart tracks Primary and Cycle degree waves — the large multi-month or multi-year trends. Weekly wave counts are used primarily for positional bias rather than entry timing. A trader identifying that price is in a Primary Wave 3 on the weekly chart can use that context to filter D1 entries, avoiding counter-trend positions during the most powerful trend phase.
As a calibration benchmark: the S&P 500's bull market from March 2009 to February 2020 is frequently cited as a textbook 5-wave impulse sequence at the Primary degree, with Wave 3 extending approximately 261.8% of Wave 1 — consistent with Elliott's original observations.
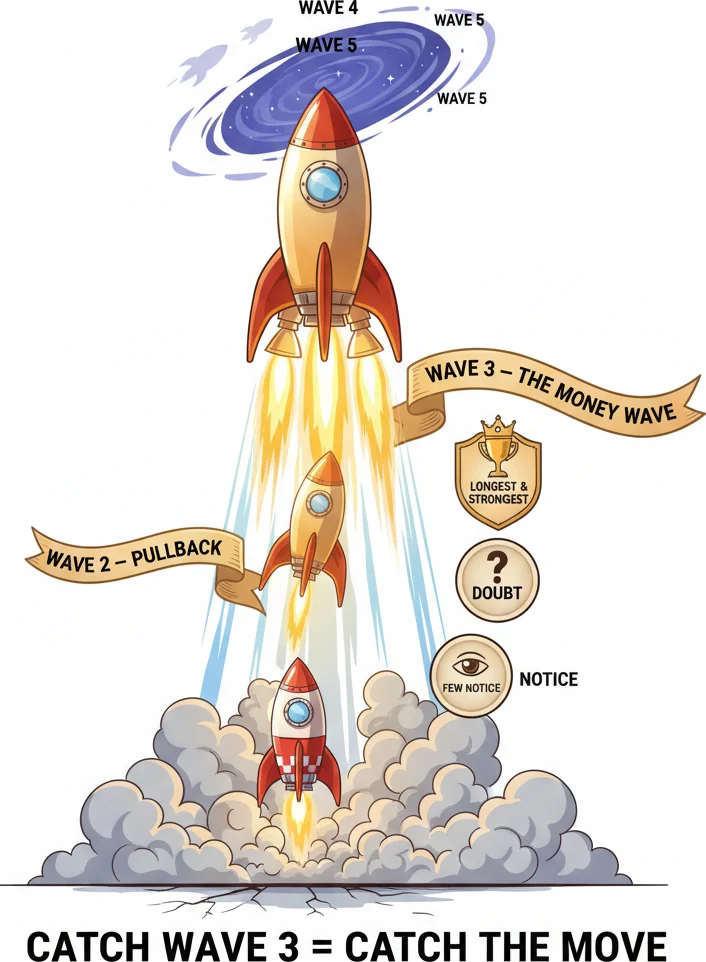
Wave 3 is the money wave — longest, strongest, and the one every Elliott trader dreams of catching.
4Practical Application: Trading Wave 3 and Wave C Setups
Wave 3 is the holy grail of Elliott Wave trading — the longest, strongest impulse wave that typically extends 161.8% or more of Wave 1. Here's how to build a trade around it.
Identifying the setup: After a clear Wave 1 impulse and Wave 2 correction, the Wave 3 entry forms. Wave 2 should retrace 50-61.8% of Wave 1 in most cases. The hard rule: Wave 2 can never retrace more than 100% of Wave 1. If it does, the count is wrong.
Entry: Buy when Wave 2 shows a completed A-B-C corrective structure at the 50-61.8% Fibonacci zone of Wave 1. Wait for a reversal candle or break above a short-term resistance level. Don't anticipate — confirm.
Stop: Below the origin of Wave 1. This is the absolute invalidation level. On H4 EUR/USD, this typically means 80-150 pips of risk, which requires position sizing discipline.
Target: The 161.8% extension of Wave 1 from the Wave 2 low. If Wave 1 was 120 pips, Wave 3 targets at least 194 pips from the Wave 2 low. Many Wave 3s extend to 261.8% — set partial profits at 161.8% and trail the rest.
The Wave C trade is the corrective counterpart. After an A-B-C correction begins, Wave C typically equals 100-161.8% of Wave A. Entering short at the top of Wave B (which itself usually retraces 38.2-61.8% of Wave A) gives a clean trade with the stop above the Wave B high and the target at the Wave C projection. Wave C moves are often as powerful as impulse waves because they represent the final capitulation phase of the correction.
One critical filter: always verify that your wave count aligns with the higher-timeframe structure. A Wave 3 on H4 that occurs within a larger Wave 3 on D1 produces the strongest, most extended moves. Conversely, a Wave 3 on H4 within a corrective Wave B on D1 carries significantly less conviction.

That moment when your Wave C correction turns into a beautiful reversal rally.
“Elliott Wave theory has a deserved reputation for subjectivity, and understanding why is essential for using it effectively rather than abandoning it out of frustration.”
5Why Elliott Wave Fails — and How to Manage the Subjectivity
Elliott Wave theory has a deserved reputation for subjectivity, and understanding why is essential for using it effectively rather than abandoning it out of frustration.
The core problem: the same price chart can support multiple valid wave counts simultaneously. One analyst sees Wave 3 unfolding; another sees Wave C of a larger correction. Both can construct logically consistent counts — and one is wrong. This ambiguity doesn't invalidate the theory, but it does mean that treating any single wave count as certain is a fundamental mistake.
The solution is the preferred count plus an alternative count. Professional Elliott Wave analysts always maintain at least two scenarios: their primary count (highest probability) and an alternative (what happens if the primary count fails). Each count carries a specific invalidation level — the price at which that count is proven wrong. This binary framework converts subjective analysis into actionable risk management: if price reaches the invalidation level, the primary count fails, and you switch to the alternative.
Corrective waves are where most analysts get lost. Impulse waves follow relatively clear 5-wave structures. Corrections, however, can take numerous forms — zigzags, flats, triangles, double/triple combinations — each with different internal structures. A correction that looks like a completed flat might actually be the A leg of a larger zigzag. This is where analysis paralysis sets in.
Practical mitigation: focus on impulse waves (Waves 1, 3, 5) rather than corrective waves. Impulse waves are structurally cleaner and carry higher-probability Fibonacci targets. Trade the start of Wave 3 (after Wave 2 completes) and the start of Wave 5 (after Wave 4 completes). Leave the corrective waves for identification purposes rather than trading purposes — unless the A-B-C structure is exceptionally clean.
Another limitation: Elliott Wave doesn't provide timing. You can identify that a Wave 3 should extend to 161.8% of Wave 1, but the theory says nothing about how long it will take. A Wave 3 target of 200 pips might be reached in two days or two months. Time stops — exiting a trade if the expected move hasn't materialized within a reasonable window — are not part of the theory but are essential for practical implementation.
Despite these limitations, Elliott Wave provides something few other analytical frameworks offer: structural context. Knowing whether you're in Wave 3 (the strongest trend phase) or Wave 5 (the exhaustion phase) fundamentally changes how aggressively you should position. That context alone is worth the analytical effort.

The biggest flaw? Give ten traders the same chart and you get ten different wave counts. Subjectivity is the enemy.
Frequently Asked Questions
Q1How many waves are in a complete Elliott Wave cycle?
A complete cycle consists of 8 waves: 5 impulse waves (labeled 1-5) moving in the direction of the primary trend, followed by 3 corrective waves (labeled A-B-C) moving against it. The impulse phase captures the trending move; the corrective phase captures the pullback. Each wave subdivides into smaller versions of the same pattern — a fractal property where Wave 3 itself contains 5 sub-waves, and Wave A contains 5 sub-waves within the correction.
Q2Which Elliott Wave is the strongest and most tradeable?
Wave 3 is almost always the longest and most powerful impulse wave. It typically extends to 161.8% or 261.8% of Wave 1's length, producing the largest directional moves of the cycle. Wave 3 is also the most tradeable because it follows a completed Wave 2 correction — which provides a clear entry zone (50-61.8% retracement of Wave 1) and a clear invalidation level (below Wave 1's origin). Most experienced Elliott Wave traders focus primarily on catching Wave 3.
Q3What are the strict rules of Elliott Wave theory?
Three inviolable rules: (1) Wave 2 can never retrace more than 100% of Wave 1 — if it does, the count is wrong. (2) Wave 3 can never be the shortest of the three impulse waves (1, 3, 5). (3) Wave 4 can never overlap the price territory of Wave 1 (in impulsive structures). If any of these rules are broken, the wave count must be revised. Beyond these hard rules, there are guidelines (like Wave 2 typically retracing 50-61.8%) that are frequently observed but not mandatory.
Q4Why do different analysts get different wave counts?
Because corrective structures can take multiple forms (zigzags, flats, triangles, combinations), the same price action can support multiple valid wave counts simultaneously. This subjectivity is the theory's most criticized limitation. The solution is to maintain a preferred count plus an alternative count, each with specific invalidation levels. When price reaches the invalidation level of the preferred count, you switch to the alternative. This converts subjective analysis into a binary risk management framework rather than trying to achieve certainty.
Q5Does Elliott Wave work on forex markets?
Yes, but with some caveats. Forex markets trend less persistently than equities, so impulse waves tend to be shorter and corrections more complex. The theory works best on major pairs (EUR/USD, GBP/USD, USD/JPY) on H4 and D1 timeframes, where institutional order flow creates cleaner wave structures. On exotic pairs or short timeframes, the fractal structure becomes too noisy to count reliably. Many forex-focused Elliott Wave practitioners combine wave counts with Fibonacci retracements and extensions to add mathematical precision to the structural framework.
Top Brokers
About the Author
Daniel Harrington
Senior Trading Analyst
Daniel Harrington is a Senior Trading Analyst with a MScF (Master of Science in Finance) specializing in quantitative asset and risk management. With over 12 years of experience in forex and derivatives markets, he covers MT5 platform optimization, algorithmic trading strategies, and practical insights for retail traders.
Use This Indicator
Risk Disclaimer
Trading financial instruments carries significant risk and may not be suitable for all investors. Past performance does not guarantee future results. This content is for educational purposes only and should not be considered investment advice. Always conduct your own research before trading.