Exponential Moving Average (EMA) Indicator: Settings, Signals & Day Trading Guide
EMA gives more weight to recent prices, making it more responsive to new information than the simple moving average.

Daniel Harrington
Senior Trading Analyst · MT5 Specialist
☕ 15 min read
Settings — EMA
| Category | trend |
| Default Period | 20 |
| Best Timeframes | M15, H1, H4 |
Here is a number that might change how you think about moving averages: on a 20-period EMA, yesterday's price carries about 9.5% of the total weight. The price from ten candles ago? Barely 4%. The one from twenty candles back? Less than 1.3%. The EMA is not just a line on your chart — it is a memory machine with a very strong opinion about what happened recently, and a very short attention span for anything older. That built-in bias toward fresh data is exactly what makes it the go-to indicator for traders who need their signals fast, not perfect.
Key Takeaways
- If you have ever used a Simple Moving Average (SMA), you already know the concept: add up the last N closing prices, div...
- If you hang around any forex trading community long enough, you will hear about the 8/21 EMA crossover. It is arguably t...
- If a single EMA is a thermometer, an EMA ribbon is a full weather station. By plotting multiple EMAs simultaneously — ty...
1What Makes the EMA 'Exponential' (And Why You Should Care)
If you have ever used a Simple Moving Average (SMA), you already know the concept: add up the last N closing prices, divide by N, plot the result. Clean, fair, democratic. Every price gets an equal vote.
The EMA throws democracy out the window. It runs on favoritism — and for good reason.
The word "exponential" refers to how the weights decay. Each candle further back in time receives exponentially less influence on the final number. Not linearly less. Not slightly less. Exponentially less — meaning the drop-off is steep and fast.
Here is the actual formula, which is simpler than it looks:
EMA = (Current Price x K) + (Previous EMA x (1 - K))
Where K = 2 / (Period + 1)
For a 20-period EMA, K = 2 / 21 = 0.0952. That means today's closing price contributes 9.52% to the new EMA value, while everything else — the entire accumulated history — contributes 90.48% through the previous EMA value.
Why should you care about this math? Because it has real consequences on your chart.
Imagine EUR/USD is trading at 1.0850 and suddenly spikes to 1.0920 on strong NFP data. A 20-period SMA barely flinches — that spike is just one of twenty equally-weighted values. But the 20-period EMA jumps noticeably, because it gives that fresh 1.0920 close nearly double the weight of an equivalent SMA contribution. In practice, EMAs reduce signal lag by roughly 30-40% compared to an SMA of the same period during trending conditions.
Here is a quick reference for how much weight the most recent price carries at different EMA periods:
| EMA Period | Multiplier (K) | Recent Price Weight | Typical Use |
|---|---|---|---|
| 8 | 0.222 | 22.2% | Scalping, fast entries |
| 12 | 0.154 | 15.4% | Short-term day trading |
| 20 | 0.095 | 9.5% | Swing trading (default) |
| 50 | 0.039 | 3.9% | Medium-term trend |
| 200 | 0.010 | 1.0% | Long-term trend, institutional |
Notice the pattern: a shorter period means the most recent candle has a louder voice. An 8-period EMA lets today's price scream at 22% volume. A 200-period EMA gives it a polite whisper at 1%. This is the core tradeoff every trader needs to internalize — speed versus smoothness.
One more thing worth knowing: the very first EMA value on any chart is calculated as a simple average. After that, every new bar feeds into the exponential formula. This means the first 50 or so bars of EMA data on any chart are still "warming up" and may not be fully reliable. Most platforms handle this behind the scenes, but if you are backtesting manually, skip the initial warm-up period.
Think of the EMA like a news-obsessed friend. They remember last week's headlines vividly, have a vague sense of what happened last month, and have essentially forgotten anything from three months ago. That recency bias is a feature, not a bug — at least when the market is trending.
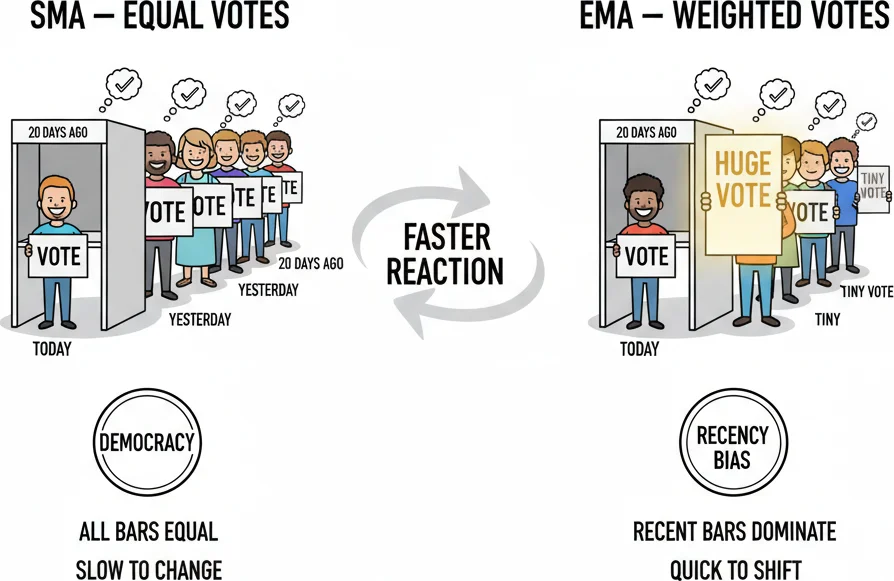
SMA treats every bar equally. EMA gives today is price a megaphone and last month is price a whisper.
2The 8/21 EMA Setup That Day Traders Swear By
If you hang around any forex trading community long enough, you will hear about the 8/21 EMA crossover. It is arguably the most popular dual-EMA setup in retail trading, and there are good reasons it has survived decades of market evolution.
The setup is straightforward: plot an 8-period EMA and a 21-period EMA on the same chart. The 8 EMA reacts fast (recent price weight: 22%). The 21 EMA reacts slower (recent price weight: 9.1%). The relationship between these two lines tells you a story about short-term momentum versus medium-term trend.
The core signals:
- Bullish crossover: The 8 EMA crosses above the 21 EMA. Short-term momentum is now faster than medium-term momentum — buyers are taking control.
- Bearish crossover: The 8 EMA crosses below the 21 EMA. Sellers are gaining ground.
Why 8 and 21 specifically? These are Fibonacci numbers (the sequence goes 1, 1, 2, 3, 5, 8, 13, 21, 34...), and while the mathematical connection to markets is debatable, the practical result is solid: 21 periods roughly equals one trading month on a daily chart, and 8 periods captures about a week and a half of price action. Together, they create a fast/slow pair that balances responsiveness with noise filtering.
How to trade it on H1 (step by step):
- Open your H1 chart on a major pair like GBP/USD or EUR/USD.
- Add two EMAs: 8-period (color it green or blue) and 21-period (color it red or orange).
- Wait for a bullish crossover — the 8 EMA crossing above the 21 EMA.
- Do not enter immediately at the cross. Wait for price to pull back toward the EMA zone (the space between the two lines).
- Enter when a bullish candle (engulfing, pin bar, or strong close) forms at or near the EMA zone.
- Place your stop-loss below the 21 EMA, adding a buffer of 1x ATR(14) to avoid normal wick noise.
- Target a minimum 1:2 risk-to-reward ratio, or trail your stop behind the 21 EMA as the trend develops.
For bearish setups, reverse everything.
The EMA zone concept is what separates mechanical crossover traders from those who actually make money with this setup. The space between the 8 and 21 EMAs acts as a dynamic support zone in uptrends and dynamic resistance in downtrends. Price frequently pulls back into this zone before continuing in the trend direction. Entering on the pullback rather than the crossover itself improves your average entry price and tightens your stop distance.
Here is where it gets practical. On GBP/USD H1 during a trending session, you might see the 8 EMA cross above the 21, followed by two to three candles of consolidation that dip back between the two lines. That dip is your opportunity — a discounted entry in the direction of fresh momentum.
Best pairs and timeframes for the 8/21 setup:
| Timeframe | Best Pairs | Notes |
|---|---|---|
| M15 | EUR/USD, USD/JPY | Fast signals, needs tight spreads (<1.5 pips) |
| H1 | GBP/USD, EUR/USD, AUD/USD | Sweet spot for most day traders |
| H4 | Any major pair | Fewer signals, higher quality per trade |
One honest caveat: the 8/21 crossover generates plenty of false signals during ranging markets. If you see the two EMAs flattening out and weaving back and forth across each other like tangled earbuds, that is not a trading environment — that is the market telling you to wait. Adding a trend filter (more on this in the false signals section) is essential for keeping this setup profitable.

The 8/21 EMA combo: faster than your regular moving average, smoother than your morning coffee.
“If a single EMA is a thermometer, an EMA ribbon is a full weather station.”
3EMA Ribbon: Reading Momentum Like a Pro
If a single EMA is a thermometer, an EMA ribbon is a full weather station. By plotting multiple EMAs simultaneously — typically six to eight lines spanning different periods — you get a visual map of momentum that reveals things no single line can show.
The most common EMA ribbon uses periods like 8, 13, 21, 34, 55, and 89 (all Fibonacci numbers), plotted together and color-coded from fastest to slowest. Some traders prefer a simpler version: 10, 20, 30, 40, 50, with each line a slightly different shade.
Reading the ribbon comes down to three patterns:
1. Fanning out — Strong trend in progress
When the ribbon lines spread apart like an opening hand, the trend is accelerating. The fastest EMA (8) is pulling away from the slowest (89), which means short-term momentum is significantly outpacing longer-term averages. This is the visual signature of a market that is trending hard, and it is generally a poor time to fade the move.
On USD/JPY H4 during a strong uptrend, you will see the 8 EMA on top, followed by 13, 21, 34, 55, 89 in descending order — all fanned out with visible space between each line. That stacking order is your confirmation that every timeframe of momentum agrees: up.
2. Compression — Consolidation or reversal warning
When the ribbon lines squeeze together and nearly overlap, momentum is dying. The market is consolidating, and all those different EMA periods are converging on roughly the same value. This is the visual equivalent of a coiled spring — energy is building, but direction is unclear.
Compression on its own is not a signal. It is a warning to be ready. Watch for the ribbon to begin expanding again — the direction of that new expansion usually indicates the next meaningful move.
3. Twist and invert — Trend reversal
The most powerful ribbon signal occurs when the lines twist, cross through each other, and restack in the opposite order. If the ribbon was stacked bullish (8 > 13 > 21 > 34 > 55 > 89) and it inverts to bearish (89 > 55 > 34 > 21 > 13 > 8), that is a confirmed trend change — not just a pullback.
This inversion does not happen instantly. On H1, a full ribbon twist typically takes 15-25 candles to complete. That lag is actually useful — it filters out fake reversals that only last a few bars.
The Guppy Multiple Moving Average (GMMA)
Daryl Guppy formalized a version of the ribbon that separates EMAs into two groups:
- Short-term group: 3, 5, 8, 10, 12, 15-period EMAs (representing retail traders and short-term sentiment)
- Long-term group: 30, 35, 40, 45, 50, 60-period EMAs (representing institutional and longer-term sentiment)
The gap between these two groups is the key. When the short-term group is well above the long-term group and both are expanding, the trend has broad agreement across timeframes. When the short-term group compresses into the long-term group, a trend change may be forming.
Practical ribbon trading on H1:
Plot EMAs at 8, 13, 21, 34, 55. During an uptrend, wait for a pullback that pushes price down into the ribbon — touching or entering the middle lines (21-34 zone). If price bounces from this zone with a strong candle and the ribbon remains in bullish order, that is a high-probability continuation entry. Your stop goes below the slowest EMA (55), and your target is the previous swing high or a 1:2 risk-reward projection.
The ribbon is not a magic bullet, but it gives you something a single EMA cannot: a visual sense of trend agreement across multiple momentum horizons. When all the lines agree, the odds shift in your favor.

When EMAs fan out in order, momentum is strong. When they tangle into spaghetti, the trend is dying.
4When the EMA Lies: False Signals and How to Filter Them
Here is the uncomfortable truth every EMA trader needs to accept: major currency pairs spend roughly 60-70% of their time in ranging, choppy, sideways conditions. And the EMA — every EMA, regardless of period — was built for trends. Using a trend-following tool in a trendless market is like bringing a surfboard to a swimming pool. You are going to have a bad time.
The most common false signal is the whipsaw. Price crosses above the 20 EMA, you go long, then three candles later it crashes back below. You stop out. Price bounces above again. You re-enter. It drops again. Each whipsaw costs you a spread plus a stop-loss, and the cumulative damage during a range-bound week can be brutal.
The 8/21 crossover is equally vulnerable. In a ranging market, the two EMAs flatten out and cross back and forth repeatedly — sometimes three or four times in a single session without a meaningful move in either direction.
So how do you stop the EMA from lying to you? You add filters.
Filter 1: The ADX (Average Directional Index)
The ADX measures trend strength on a scale from 0 to 100. It does not tell you direction — only whether the market is trending or ranging. The rule is simple:
- ADX above 25: the market has enough trend strength for EMA signals to be meaningful. Trade normally.
- ADX below 20: the market is in a range. EMA crossovers and bounces are statistically unreliable. Stay out or switch to a range-bound strategy.
- ADX between 20 and 25: gray zone. Reduce position size or require additional confirmation.
Adding this single filter eliminates a significant chunk of losing trades. When ADX on H1 is reading 15 and the 8 EMA crosses above the 21, that crossover means almost nothing. Skip it.
Filter 2: The 200 EMA as a directional gatekeeper
Before acting on any short-term EMA signal, check where price sits relative to the 200 EMA. Only take bullish signals when price is above the 200 EMA. Only take bearish signals when price is below it. This keeps you on the right side of the macro trend and filters out counter-trend setups that have a significantly lower success rate.
On EUR/USD H1, this gatekeeper alone would have kept you out of several false breakouts during the choppy consolidation phases of mid-2025, when the pair ranged between 1.0780 and 1.0860 for weeks.
Filter 3: Multi-timeframe confirmation
A bullish 8/21 crossover on H1 is more reliable when the H4 chart also shows price above its 20 EMA and trending upward. If the H1 says buy but the H4 says the broader trend is bearish, that H1 signal is swimming against the current.
The simplest approach: check one timeframe up. Trading on M15? Confirm direction on H1. Trading on H1? Confirm on H4. Trading on H4? Check the daily.
Filter 4: Crossover angle
Not all crossovers are created equal. When the 8 EMA pierces through the 21 EMA at a steep angle — roughly 30 to 45 degrees visually — the momentum behind the move is genuine. When the two lines cross at a nearly flat, horizontal angle, the crossover is more likely to reverse. Flat crossovers are the EMA's way of shrugging.
Filter 5: Wait for the close
Never act on an intra-candle crossover. The 8 EMA might cross above the 21 mid-bar, only to close back below by the time the candle completes. Always wait for the candle to close before evaluating any EMA signal. This patience costs you a few pips of entry but saves you from a disproportionate number of fakeouts.
The honest summary:
The EMA is a lagging indicator. It always will be. It reacts to what has already happened, and no period setting changes that fundamental reality. The trick is not to make the EMA predict — it is to use the EMA as one voice in a jury of indicators, and only act when the verdict is unanimous.
When the EMA screams 'buy' but the market just wanted to say hello to your stop loss.
“Enough theory.”
5Your First EMA Trade: A Step-by-Step Walkthrough
Enough theory. Let us walk through an actual EMA trade from chart setup to position close, using a realistic scenario on EUR/USD H1.
Step 1: Set up your chart
Open EUR/USD on the H1 timeframe. Add three indicators:
- 8-period EMA (green line)
- 21-period EMA (red line)
- 200-period EMA (gray dotted line — your trend gatekeeper)
Optional but recommended: add the ADX indicator (14-period) in a separate panel below the chart. You will use it to confirm whether the market is actually trending.
Step 2: Identify the macro trend
Look at the 200 EMA. Is price trading above it or below it?
For this example, EUR/USD is at 1.0870 and the 200 EMA sits at 1.0810. Price is above — your macro bias is bullish. You will only look for long (buy) setups.
Step 3: Wait for a crossover
Watch the 8 and 21 EMAs. During the London session open, increasing volume pushes EUR/USD from 1.0855 to 1.0880 over several candles. The 8 EMA curves upward and crosses above the 21 EMA. The crossover angle is steep — this is a genuine momentum shift, not a lazy drift.
Check the ADX: it reads 28. Above 25 means the trend has substance. Green light.
Step 4: Wait for the pullback (do NOT chase)
This is where discipline separates profitable EMA traders from everyone else. After the crossover, price often continues for two to three candles before pulling back. You do not chase the initial move.
Price reaches 1.0895, then starts to retrace. Over the next three candles, it dips back to 1.0872 — right into the zone between the 8 EMA (now at 1.0878) and the 21 EMA (at 1.0865). Price is testing the EMA zone as dynamic support.
Step 5: Enter on a confirmation candle
The fourth candle after the pullback prints a bullish engulfing pattern at 1.0875, closing at 1.0888. The candle body is entirely within or above the EMA zone. This is your entry.
- Entry price: 1.0888
- Stop-loss: Below the 21 EMA minus a 1x ATR buffer. ATR(14) on H1 reads 12 pips. The 21 EMA is at 1.0865. Your stop goes at 1.0853 (21 EMA minus 12 pips).
- Risk per trade: 1.0888 - 1.0853 = 35 pips
- Take-profit target: 1:2 risk-reward = 70 pips above entry = 1.0958. Alternatively, trail your stop below the 21 EMA as it rises.
Step 6: Manage the trade
Over the next 12 candles, EUR/USD climbs steadily. The 8 EMA stays above the 21, the ribbon is fanning — momentum is intact. Price reaches 1.0940.
You move your stop-loss up to breakeven (1.0888) once price has moved 1x your initial risk (35 pips) in your favor. This makes the trade risk-free.
Price continues to 1.0958 — your take-profit level. Position closed.
- Result: +70 pips at 1:2 risk-reward.
Step 7: Review what could have gone wrong
Not every trade works out this cleanly. Here is what to do if the scenario goes sideways:
- If price breaks below the 21 EMA after entry: exit at your stop. Do not average down. Do not hope.
- If the ADX drops below 20 while you are in the trade: tighten your stop to the 8 EMA. Momentum is fading.
- If the 8 EMA crosses back below the 21 while you are in a long trade: close immediately. The setup premise is invalidated.
Quick-reference checklist for any EMA trade:
| Step | Action | Why |
|---|---|---|
| 1 | Check 200 EMA direction | Confirm macro trend |
| 2 | Check ADX > 25 | Confirm trend strength |
| 3 | Wait for 8/21 crossover | Signal momentum shift |
| 4 | Wait for pullback to EMA zone | Get a better entry price |
| 5 | Enter on confirmation candle | Avoid fakeouts |
| 6 | Stop below 21 EMA + ATR buffer | Account for normal volatility |
| 7 | Target 1:2 RR or trail stop | Protect profits |
That is the complete workflow. No mystery indicators, no proprietary algorithms. Two EMAs, a trend filter, and the patience to wait for the pullback. The EMA does not make you money by being clever — it makes you money by keeping you aligned with momentum while other traders chase random price spikes.
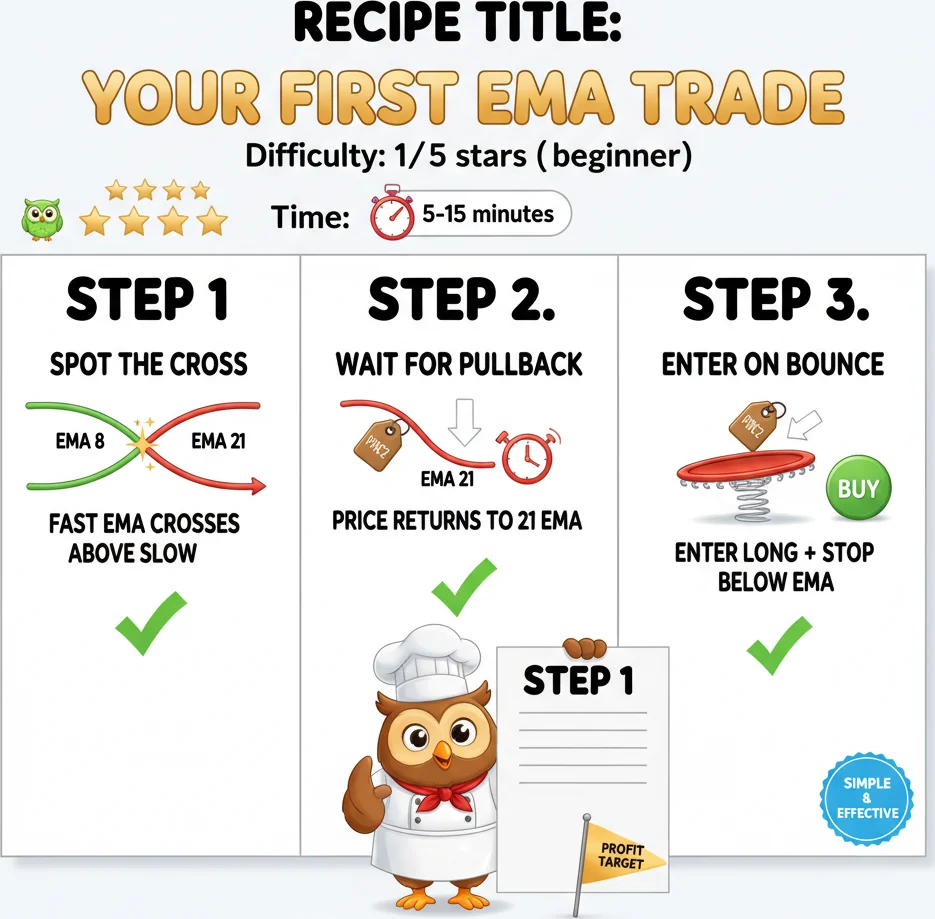
Your first EMA trade in three steps: spot the cross, wait for the pullback, enter on the bounce. That is it.
Frequently Asked Questions
Q1What is the difference between EMA and SMA, and which one should I use?
The EMA gives more weight to recent prices, making it react faster to new moves. The SMA treats all prices equally, producing a smoother but slower line. For day trading on M15 or H1 where speed matters, the EMA is generally the better choice. For longer-term analysis on daily or weekly charts where you want to filter out noise, the SMA works well. Many traders use both — an EMA for entries and an SMA (like the 200-day) for trend context.
Q2What are the best EMA periods for forex day trading?
The 8 and 21 EMA combination is the most popular for day trading. The 8 EMA captures short-term momentum, and the 21 EMA represents roughly one trading month of data. On M15, some scalpers prefer the 5/13 pair for even faster signals. On H1, the 8/21 or 9/21 setup hits the sweet spot between signal speed and reliability. Always add the 200 EMA as a trend filter regardless of which fast pair you choose.
Q3Why does the EMA give so many false signals in ranging markets?
The EMA is a trend-following tool by design — it excels when price is moving directionally and struggles when it is not. In a range, price oscillates above and below the EMA repeatedly without committing to a direction, triggering crossovers that reverse almost immediately. The best fix is adding the ADX indicator: when ADX is below 20, the market lacks trend strength and EMA signals should be ignored or treated with extreme caution.
Q4Can I use the EMA on crypto and stocks, or is it only for forex?
The EMA works on any market that produces an open-high-low-close chart — forex, stocks, crypto, commodities, indices. The math is identical. What changes is the optimal period setting, because different markets have different volatility profiles. Crypto markets like BTC/USD tend to be more volatile, so slightly longer EMA periods (like 13/34 instead of 8/21) can help reduce noise. Stock traders frequently use the 12/26 EMA pair, which mirrors the MACD default settings.
Q5How many EMAs should I put on my chart at once?
Two to three EMAs is the practical limit for clear decision-making. A fast EMA (8-12), a medium EMA (20-21), and the 200 EMA for trend context covers most trading needs. If you want more granularity, an EMA ribbon (6-8 lines) works, but use it for momentum reading rather than individual trade signals. Stacking five or more random EMAs without a clear purpose just creates visual noise that makes decision-making harder, not easier.
Top Brokers
About the Author
Daniel Harrington
Senior Trading Analyst
Daniel Harrington is a Senior Trading Analyst with a MScF (Master of Science in Finance) specializing in quantitative asset and risk management. With over 12 years of experience in forex and derivatives markets, he covers MT5 platform optimization, algorithmic trading strategies, and practical insights for retail traders.
Use This Indicator
Risk Disclaimer
Trading financial instruments carries significant risk and may not be suitable for all investors. Past performance does not guarantee future results. This content is for educational purposes only and should not be considered investment advice. Always conduct your own research before trading.