Gartley Harmonic Pattern: Complete Trading Guide
Gartley pattern is a harmonic XABCD structure using specific Fibonacci ratios where the B point retraces 61.8% of XA, identifying high-probability reversal zones.

Daniel Harrington
Senior Trading Analyst · MT5 Specialist
☕ 9 min read
Settings — Gartley
| Category | chart-pattern |
| Default Period | null |
| Best Timeframes | H1, H4, D1 |
You're watching EUR/USD form what looks like a textbook pullback, but something about the structure feels different — the retracements are too precise to be random noise. That precision is exactly what the Gartley harmonic pattern detects: a five-point XABCD price structure where each leg conforms to specific Fibonacci ratios, filtering out ordinary corrections and flagging genuine, high-probability reversal zones before the move completes.
Key Takeaways
- Most traders think of Fibonacci retracements as standalone tools — draw a level, wait for a bounce. The Gartley pattern ...
- A surprising number of traders misread Gartley completions and enter too early. The pattern does not signal the moment D...
- The Gartley pattern works across all timeframes, but the quality of its signals changes dramatically depending on where ...
1How the Gartley Pattern Works: The Math Behind the Structure
Most traders think of Fibonacci retracements as standalone tools — draw a level, wait for a bounce. The Gartley pattern takes that logic several steps further by requiring four consecutive price legs to each hit a specific Fibonacci ratio, creating a nested structure that filters out noise far more aggressively than any single retracement level can.
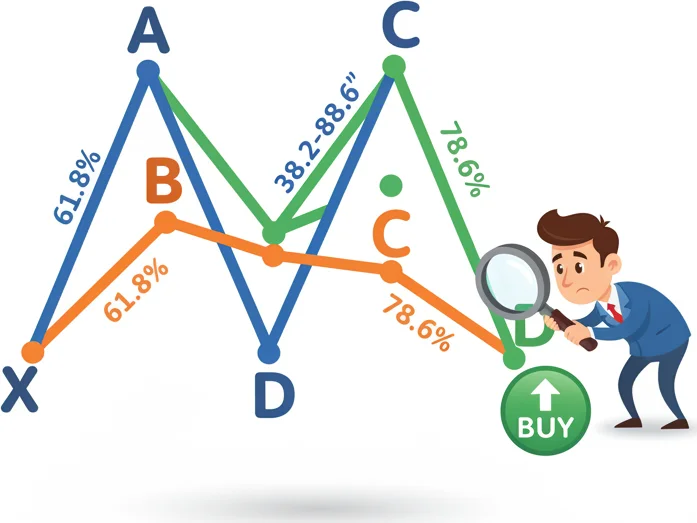
The pattern traces five pivot points labeled X, A, B, C, and D. Here is how each leg must behave:
XA leg: The initiating move — a strong directional swing in either direction. This leg sets the scale for everything that follows.
AB leg (xbRatio = 0.618): Price retraces exactly 61.8% of the XA move. This is the most critical ratio in the pattern. If B does not land near 61.8% of XA, the structure is not a valid Gartley — period. The 61.8% level is the golden ratio, and its appearance here is what gives the pattern its statistical edge.
BC leg (acRatio = 0.886): Price reverses from B and retraces between 38.2% and 88.6% of the AB leg. The default parameter targets 0.886, meaning C typically forms deep into the AB range.
CD leg (bdRatio = 1.272): The final and most actionable leg. Price reverses from C and extends to the D point, which sits at 127.2% of the BC leg. Simultaneously, D should fall near 78.6% of the original XA leg. This confluence — where the 127.2% BC extension and the 78.6% XA retracement overlap — is called the Potential Reversal Zone (PRZ).
Think of it like a combination lock. One correct number means nothing. All four ratios aligning simultaneously is what unlocks the trade signal. The PRZ is not a single price point but a small zone, typically 10–20 pips wide on H4 EUR/USD, where reversal probability concentrates.

H.M. Gartley published this pattern in 1935 in a book that cost $1,500 at the time. The original harmonic.
2Signal Interpretation: Reading Bullish and Bearish Gartley Setups
A surprising number of traders misread Gartley completions and enter too early. The pattern does not signal the moment D forms — it signals when price enters the PRZ and shows confirmation.
Bullish Gartley (buy signal): X is a swing low, A is a swing high, and the XABCD structure unfolds with D forming below X. When price reaches the PRZ at approximately 78.6% of XA (measured from X upward), the setup calls for a long entry. The market has completed a corrective structure and is positioned to resume the larger uptrend.
Bearish Gartley (sell signal): The mirror image. X is a swing high, A is a swing low, and D forms above X. Price reaching the PRZ signals a potential short entry as the corrective rally exhausts itself.
Entry refinement: Do not enter blindly at D. Wait for at least one confirming candle — a bullish engulfing on a bullish setup, or a bearish pin bar on a bearish setup. On H4 EUR/USD, this waiting period often costs 5–8 pips of entry precision but eliminates a significant percentage of false completions.
Stop-loss placement: Set the stop below X on bullish setups (above X on bearish). If price violates X, the harmonic structure is invalidated. Pulsar Terminal's multi-level SL/TP tools let you define this invalidation point directly on the chart and attach it to your order in a single click, removing manual calculation errors under pressure.
Target levels: The first target sits at C, the second at A, and the most aggressive target extends toward the 161.8% extension of the XA leg. Risk-to-reward ratios on properly formed Gartley patterns typically range from 1:2 to 1:4 depending on which target level is used.
Divergence reading: When the RSI or MACD shows divergence at the D point — price making a lower low while momentum makes a higher low on a bullish setup — the reversal probability increases materially. Divergence at D is not required but acts as meaningful confirmation.

When you finally spot that perfect Gartley pattern hiding in the charts.
“The Gartley pattern works across all timeframes, but the quality of its signals changes dramatically depending on where you apply it.”
3Optimal Timeframe Settings for H1, H4, and D1 Charts
The Gartley pattern works across all timeframes, but the quality of its signals changes dramatically depending on where you apply it. The default parameters (xbRatio: 0.618, acRatio: 0.886, bdRatio: 1.272) remain constant — Fibonacci ratios do not change with timeframe — but execution strategy must adapt.
H1 (one-hour chart): Best suited for intraday traders targeting 30–80 pip moves. H1 Gartley patterns complete faster, typically within 12–36 hours, but they generate more false completions due to intraday noise. On H1, tighten your PRZ tolerance — only accept setups where D lands within 5 pips of the theoretical 78.6% level. Wider zones on H1 often indicate sloppy structure. Focus on major sessions: London open and New York open produce the cleanest completions.
H4 (four-hour chart): The most balanced timeframe for Gartley trading. Patterns form over 3–10 days, PRZ zones are wider (15–30 pips on majors), and the signal-to-noise ratio is noticeably better than H1. H4 is where the default parameters perform closest to their backtested behavior. The 2020–2024 period saw particularly high-quality Gartley completions on H4 EUR/USD and GBP/USD during trending phases with periodic deep corrections.
D1 (daily chart): Reserved for position traders with tolerance for 200–600 pip targets. D1 Gartley patterns can take weeks to complete, but when they do, the PRZ rejections are often violent and fast. A D1 bullish Gartley completing at a major support zone can produce 300–500 pip moves within 5–10 trading days. The tradeoff is that stops are correspondingly large — often 150–250 pips — requiring appropriate position sizing.
Cross-timeframe confirmation: The highest-probability setups occur when a D1 Gartley PRZ aligns with an H4 bullish completion simultaneously. This multi-timeframe confluence is rare but produces some of the cleanest reversal trades available in the forex market.

Unlike the Butterfly and Crab, the Gartley never extends past X. It is the conservative, well-behaved harmonic.
4Practical Application: From Pattern Recognition to Executed Trade
Pattern recognition without a systematic execution process produces inconsistent results. Here is a repeatable workflow for trading Gartley setups.
Step 1 — Identify the XA leg: Scan for strong, impulsive moves on your chosen timeframe. XA should be a clear directional swing, not a choppy sideways grind. On H4, XA typically spans 80–200 pips on EUR/USD.
Step 2 — Validate the AB retracement: Draw a Fibonacci retracement from X to A. B must form within 2–3 pips of the 61.8% level on H4, or within 5 pips on D1. If B overshoots to 70% or beyond, discard the setup — this is not a Gartley.
Step 3 — Track BC: Once B confirms, measure the BC retracement of AB. The default acRatio of 0.886 means you are looking for C to form near the 88.6% retracement of AB. Mark this level in advance so you can anticipate the C pivot rather than react to it.
Step 4 — Project the D point: From C, project 127.2% of the BC leg (bdRatio: 1.272). Simultaneously, mark 78.6% of the XA leg from X. Where these two levels converge is your PRZ. Mark it as a zone, not a line.
Step 5 — Wait and confirm: Do not preposition orders inside the PRZ without confirmation. Watch for reversal candlestick patterns as price enters the zone. Volume spikes at the PRZ add confidence.
Step 6 — Execute with defined risk: Enter on confirmation, set stop beyond X, and pre-define your targets at C and A. Pulsar Terminal's one-click trading with pre-configured SL/TP levels makes this execution fast and precise — you set the levels based on the Gartley structure directly on the chart, then execute without manual order entry.
Common failure modes: The most frequent mistake is accepting a B point that retraces 65–70% of XA and labeling it "close enough." The 61.8% ratio is not a suggestion. Sloppy pattern qualification is the primary reason traders report poor results with harmonic setups.

Hitting those Fibonacci targets with surgical precision - that's the Gartley magic!
“The harmonic family includes the Gartley, Bat, Butterfly, and Crab — and confusing them is one of the most common errors in harmonic trading.”
5Gartley vs Other Harmonic Patterns: When Each One Applies
The harmonic family includes the Gartley, Bat, Butterfly, and Crab — and confusing them is one of the most common errors in harmonic trading. Each pattern uses a different set of Fibonacci ratios, which means they complete at different depths and produce different risk profiles.
The Gartley is the shallowest harmonic pattern. D completes at 78.6% of XA, meaning the pattern stays well within the original swing range. This makes it the most conservative harmonic setup — the reversal happens before price reaches the extreme. The tradeoff: stops placed beyond X are relatively far from the D entry, which can compress risk-reward ratios compared to deeper patterns.
The Bat completes at 88.6% of XA — deeper than the Gartley, with a tighter stop-to-X distance. The Bat uses a stricter 0.500 XB retracement (versus the Gartley's 0.618), which means fewer valid formations but higher structural precision. If a pattern looks like a Gartley but B retraces only 50% of XA, it's a Bat, not a Gartley — and the D completion level changes accordingly.
The Butterfly extends beyond X, with D at 127.2% of XA. The Crab goes even further — D at 161.8% of XA. These extended patterns identify reversals at price extremes that the Gartley cannot reach. They're higher-risk (the stop is tighter but the failure rate is higher because price has already overextended) but potentially higher-reward.
Practical decision framework: when price is pulling back moderately within a clear trend, look for Gartley setups. When price is retracing deeply, check for Bat formations. When price overshoots the prior swing point, evaluate Butterfly or Crab structures. The pattern type is determined by the ratios, not by trader preference — forcing a Gartley label onto a Bat structure leads to incorrect D-point projections and misplaced stops.
One advantage the Gartley holds over extended patterns: because it completes inside the prior range, the reversal occurs in 'safe' territory where the original trend structure hasn't been violated. This makes Gartley completions psychologically easier to trade — you're entering with the prior trend still technically intact, rather than buying into what looks like a breakdown (Crab/Butterfly) or catching a deep retracement (Bat).
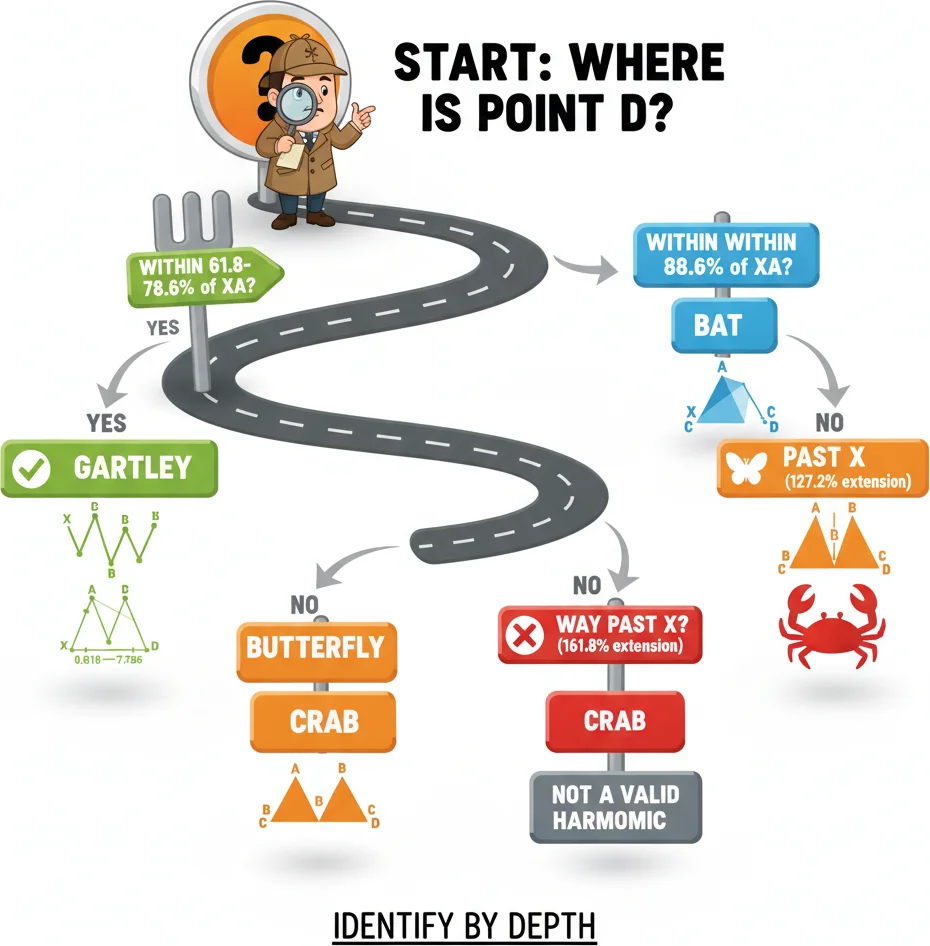
If the retracement stays shallow, think Gartley. If it goes deep, check for Bat. Past the origin? Butterfly or Crab.
Frequently Asked Questions
Q1What Fibonacci ratios define a valid Gartley pattern?
The Gartley requires four specific ratios: B must retrace 61.8% of XA (xbRatio = 0.618), C must retrace up to 88.6% of AB (acRatio = 0.886), D extends to 127.2% of BC (bdRatio = 1.272), and D simultaneously sits at 78.6% of XA. All four ratios must align for the pattern to be valid — if any single ratio is significantly off (more than 2-3% tolerance), the structure is not a Gartley. This strict multi-ratio requirement is what gives the pattern its statistical edge over single-level Fibonacci trading.
Q2Where do you place the stop-loss on a Gartley trade?
The stop goes just beyond point X — below X on bullish setups, above X on bearish setups. This is the mathematical invalidation level: if price moves past X, the entire XABCD structure has failed. Because D sits at 78.6% of XA, the distance from D to X is 21.4% of the XA range. On an H4 EUR/USD setup where XA spans 150 pips, the stop sits roughly 32 pips beyond D. Target levels at C (first target) and A (second target) typically produce risk-reward ratios of 1:2 to 1:4.
Q3Should you enter exactly at the D point or wait for confirmation?
Wait for confirmation. Entering blindly at D without a confirming reversal signal increases the false-signal rate significantly. Wait for at least one confirming candle: a bullish engulfing on a bullish setup, a bearish pin bar on a bearish setup. On H4 EUR/USD, this waiting period typically costs 5-8 pips of entry precision but eliminates a meaningful percentage of false completions. RSI or MACD divergence at D provides additional confirmation — when momentum diverges from price at the PRZ, the reversal probability increases materially.
Q4How do you distinguish a Gartley from a Bat pattern?
The critical difference is the XB retracement: the Gartley requires B at 61.8% of XA, while the Bat requires B at 50.0% of XA. This single ratio determines which pattern is forming and where D will complete. A Gartley D point lands at 78.6% of XA; a Bat D point lands at 88.6% of XA. If you identify B at 50% and label it a Gartley, your D projection will be wrong by roughly 10% of the XA range — enough to invalidate your entry, stop, and targets entirely. Always verify B first before labeling the pattern.
Q5What is the win rate of the Gartley pattern?
Backtesting data across major forex pairs on H4 charts suggests properly formed Gartley patterns with confirmation produce winning trades roughly 55-65% of the time when using C as the first target and stops beyond X. The win rate varies significantly based on: strictness of ratio validation (loose identification drops to ~45%), presence of momentum divergence at D (adds ~10% to win rate), and alignment with the higher-timeframe trend (counter-trend Gartleys have lower completion rates). The pattern's edge comes not from a sky-high win rate but from favorable risk-reward ratios of 1:2 to 1:4 on valid setups.
Top Brokers
About the Author
Daniel Harrington
Senior Trading Analyst
Daniel Harrington is a Senior Trading Analyst with a MScF (Master of Science in Finance) specializing in quantitative asset and risk management. With over 12 years of experience in forex and derivatives markets, he covers MT5 platform optimization, algorithmic trading strategies, and practical insights for retail traders.
Use This Indicator
Risk Disclaimer
Trading financial instruments carries significant risk and may not be suitable for all investors. Past performance does not guarantee future results. This content is for educational purposes only and should not be considered investment advice. Always conduct your own research before trading.