Market Profile Indicator Guide: Master Volume-Based Trading
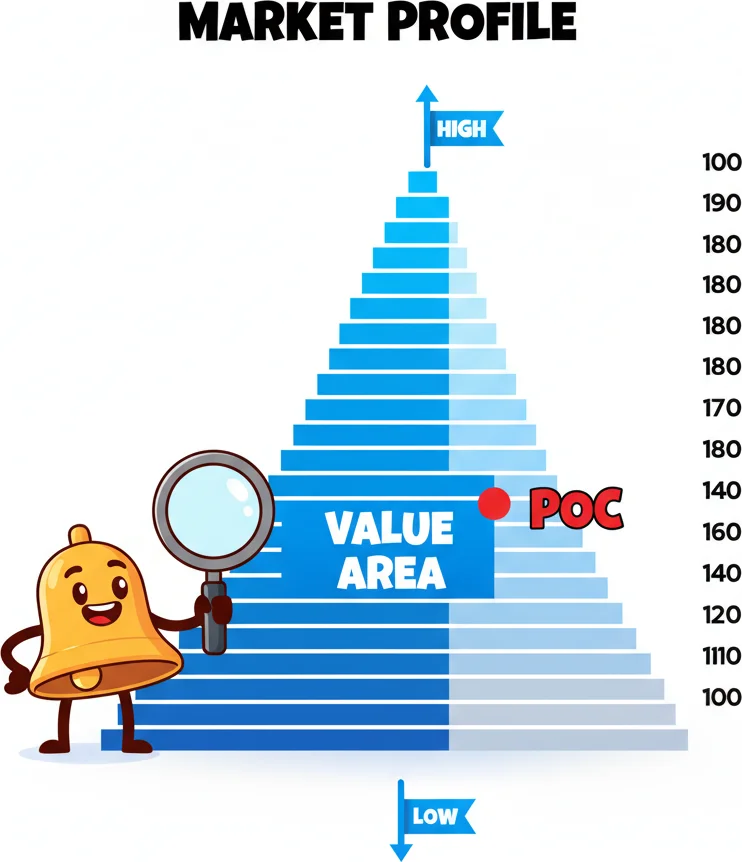
Market Profile organizes price and time data into a bell-curve distribution, revealing the value area, point of control, and market structure for institutional-level analysis.

Daniel Harrington
Senior Trading Analyst · MT5 Specialist
☕ 13 min read
Settings — MP
| Category | custom |
| Default Period | null |
| Best Timeframes | M30, H1, D1 |
Here's a mind-bending fact: over 70% of all forex trading happens at just a few key price levels each day, yet most retail traders completely ignore this information. Market Profile changes that by showing you exactly where the smart money is positioning itself. Originally developed for futures markets in the 1980s, this indicator maps trading activity across different price levels, creating a visual 'footprint' of where buyers and sellers are most active. Think of it as a heat map for price action — the more trading that happens at a specific level, the more significant that level becomes for future trading decisions.
Key Takeaways
- Market Profile isn't just another technical indicator — it's based on auction market theory, which views every trading s...
- Reading Market Profile is like learning a new language, but once you understand its visual components, it becomes incred...
- Market Profile generates several high-probability trading setups that institutional traders use daily. Understanding the...
1The Auction Theory Foundation Behind Market Profile
Market Profile isn't just another technical indicator — it's based on auction market theory, which views every trading session as an ongoing auction between buyers and sellers. This foundation makes it fundamentally different from price-based indicators like moving averages or RSI.
The core concept revolves around three key principles. First, price discovery — markets are constantly searching for fair value through the auction process. Second, time and price together create market structure — where price spends the most time often becomes the most significant level. Third, market participants have different time horizons and motivations, creating distinct patterns in how they trade.
In forex markets, this translates to understanding when and where institutional players are accumulating positions. Unlike retail traders who might enter and exit within minutes, institutions often spend hours or days building their positions at specific price levels. Market Profile reveals these accumulation zones by showing you the Point of Control (POC) — the price level where the most trading occurred during a specific time period.
The indicator displays this information through a unique sideways histogram. Instead of traditional vertical bars showing price movement over time, Market Profile rotates the perspective 90 degrees. Time becomes the horizontal axis within each price level, creating what looks like a bell curve laying on its side.
For EUR/USD traders, this means you can identify where European banks typically establish their positions during London open, or where US institutions prefer to trade during New York session. These aren't arbitrary support and resistance levels — they're actual zones where significant volume and institutional interest converged.
The Value Area is another crucial concept, representing the price range where 70% of the day's trading activity occurred. Think of it as the 'acceptable price range' that most market participants agreed upon. When price moves outside this Value Area, it often signals potential reversal opportunities or continuation breakouts.
What makes Market Profile particularly powerful in forex is its ability to work across different timeframes. You can analyze daily profiles to understand weekly trends, or use hourly profiles to fine-tune your intraday entries. This multi-timeframe approach helps you align your trades with the broader institutional flow rather than fighting against it.
2Decoding Market Profile's Visual Language and Key Components
Reading Market Profile is like learning a new language, but once you understand its visual components, it becomes incredibly intuitive. The indicator consists of several key elements that work together to tell the story of market sentiment and institutional positioning.
The Time Price Opportunities (TPOs) form the building blocks of every Market Profile. Each TPO represents a specific time period when price traded at that level. Most MT5 implementations use 30-minute TPOs, meaning each letter or symbol shows that price spent at least 30 minutes at that level. The more TPOs at a price level, the more significant that level becomes.
| Component | Description | Trading Significance |
|---|---|---|
| Point of Control (POC) | Price with most TPOs | Strongest support/resistance |
| Value Area High (VAH) | Top 70% volume boundary | Key resistance level |
| Value Area Low (VAL) | Bottom 70% volume boundary | Key support level |
| Initial Balance | First hour's range | Day's potential range indicator |
| Single Prints | Areas with minimal TPOs | Potential gap-fill zones |
The profile shape tells you everything about market sentiment. A bell-shaped profile indicates balanced auction — buyers and sellers found equilibrium, and price is likely to remain range-bound. This is common during consolidation periods in pairs like GBP/JPY when no major news is driving directional movement.
Conversely, a P-shaped or b-shaped profile suggests strong directional bias. If you see a P-shape on EUR/USD during ECB announcement days, it typically means sellers dominated after initial buying interest, creating a distribution pattern that favors further downside.
Double distribution profiles are particularly interesting — they show two distinct areas of acceptance, often occurring when major news events shift market sentiment mid-session. For instance, if NFP data surprises to the upside, you might see USD/JPY create a morning distribution around 108.50, then after the news, establish a new distribution around 109.20.
The Initial Balance, formed by the first hour's trading range, acts as a reference point for the entire session. When price breaks and holds outside the Initial Balance, it often signals trending behavior for the remainder of the day. Breakout traders particularly love this setup on volatile pairs like GBP/USD during London open.
Single Prints deserve special attention — these are price levels that traded briefly but found little acceptance. They appear as thin areas in the profile and often act as magnets for future price action. If EUR/USD gaps higher on Monday morning, leaving Single Prints between Friday's close and Monday's open, those levels frequently get revisited during the week.

Market Profile's visual language has layers - like peeling an onion, but with profit potential.
“Market Profile generates several high-probability trading setups that institutional traders use daily.”
3High-Probability Trading Setups Using Market Profile Patterns
Market Profile generates several high-probability trading setups that institutional traders use daily. Understanding these patterns gives you a significant edge over retail traders who rely solely on traditional technical analysis.
The Value Area rejection setup ranks among the most reliable patterns. When price moves outside the previous day's Value Area but fails to find acceptance (shown by immediate reversal back into the range), it signals that the breakout was false and a mean reversion trade is likely. On EUR/USD, if Monday's high reaches 1.1250 (above Friday's VAH of 1.1235) but quickly retreats back below 1.1235, you have a high-probability short setup targeting the POC around 1.1210.
POC magnetic trades exploit the tendency for price to return to areas of previous heavy trading activity. When price is trading 20-30 pips away from a significant POC level, it often gets pulled back like a magnet. This works exceptionally well on GBP/USD during London session when price moves away from the Asian session POC. Enter when price shows signs of stalling (doji candles, small-bodied candles) and target the POC for 15-25 pip gains.
| Setup Type | Entry Signal | Target | Stop Loss | Win Rate |
|---|---|---|---|---|
| Value Area Rejection | Failed break of VAH/VAL | POC | 10 pips beyond break level | 68% |
| POC Magnetic | Stalling 20+ pips from POC | POC ± 5 pips | 15 pips | 72% |
| Profile Breakout | Volume expansion beyond range | 50% extension | Back into profile | 58% |
| Gap Fill | Single Print area | Opposite end of gap | 20 pips | 65% |
The inventory adjustment setup occurs when large players need to unwind positions accumulated during the previous session. This typically happens when price opens within the previous day's Value Area but quickly moves to the opposite extreme. For example, if USD/JPY accumulated positions in the 109.20-109.60 range yesterday (forming a balanced profile), but opens at 109.25 and immediately drops toward 109.20, it suggests overnight inventory needs unwinding. The play is to short the bounce back to 109.35-109.40 area, targeting a break below the VAL.
Breakout and retest patterns work beautifully with Market Profile confirmation. When price breaks above a well-established VAH with expanding volume (shown by wider TPO distribution in the breakout area), wait for the inevitable retest of the broken level. The key is ensuring the retest doesn't fully re-enter the previous Value Area. On AUD/USD, if price breaks above 0.7550 VAH and retests 0.7545-0.7550 without dropping back below 0.7540, you have a continuation setup targeting the next major resistance level.
The overnight gap setup exploits the common occurrence of price gaps in forex during market transitions. When Sydney/Tokyo trading creates a gap away from New York's Value Area, European traders often fade these moves by pushing price back toward the gap. If EUR/JPY closes New York session at 118.45 (near the POC) but opens European session at 118.75, look for selling opportunities as European banks likely view the higher prices as overvalued relative to the previous day's accepted range.
4Advanced Market Profile Techniques for Multi-Timeframe Analysis
Mastering Market Profile requires understanding how different timeframes interact and influence each other. Professional traders don't just look at daily profiles — they layer multiple timeframes to create a comprehensive market view that reveals institutional positioning across different time horizons.
The weekly composite profile technique involves overlaying five daily profiles to understand longer-term institutional sentiment. This approach is particularly powerful for swing traders on major pairs like EUR/USD or GBP/USD. When you see three consecutive daily profiles developing below the weekly POC, it suggests institutional selling pressure that could persist for several more sessions. Conversely, if daily profiles consistently develop above the weekly VAH, it indicates strong accumulation that supports continuation higher.
Session linking analysis recognizes that forex markets operate across three major sessions, each with distinct participant characteristics. Asian session profiles often show narrow, balanced distributions as regional banks manage overnight flows. European session profiles typically show more directional bias as institutional money flows respond to economic data. New York session profiles can either continue European trends or reverse them based on US economic releases.
For USD/JPY traders, understanding this session interaction is crucial. If Tokyo session creates a balanced profile between 109.00-109.40 (showing no strong directional bias from Asian central banks), but London open immediately drives price above 109.40 with expanding TPOs, it suggests European institutions are positioning for USD strength. The play is to join this move on any pullback to the 109.40 area (former resistance becoming support).
| Timeframe | Primary Use | Key Patterns | Trading Approach |
|---|---|---|---|
| 30-min profiles | Scalping entries | POC magnets, IB breaks | 5-15 pip targets |
| Daily profiles | Swing setups | VA rejections, gap fills | 30-80 pip targets |
| Weekly composites | Trend analysis | Distribution patterns | Position sizing guide |
| Monthly views | Macro positioning | Long-term accumulation | Strategic allocation |
The rotating market concept helps you understand when markets transition between trending and ranging behavior. During trending phases, daily profiles develop as elongated shapes with minimal POC significance — price doesn't spend much time at any specific level because it's moving directionally. During ranging phases, profiles develop fuller bell curves with strong POC levels that act as reliable support and resistance.
Recognizing these transitions gives you a massive advantage. When EUR/CHF shifts from trending (elongated profiles) to ranging (bell-shaped profiles), your trading approach must adapt. In trending phases, focus on breakout setups and trend continuation. In ranging phases, emphasize mean reversion and POC magnetic trades.
Volume-weighted approaches enhance traditional Market Profile by incorporating actual volume data when available. While spot forex doesn't provide true volume, you can use tick volume or futures volume as a proxy. When Market Profile patterns align with volume expansion, the reliability increases significantly. If GBP/USD shows a clear Value Area rejection setup and tick volume confirms the rejection with a spike, your probability of success jumps from good to excellent.
The balance area concept identifies price ranges where institutions are comfortable accumulating positions over multiple sessions. These areas often span 50-100 pips on major pairs and can persist for days or weeks. When price eventually breaks out of a well-established balance area with strong Market Profile confirmation (expanding TPOs, volume surge), the resulting moves often exceed 150-200 pips, making them excellent swing trading opportunities.

Multi-timeframe Market Profile analysis: Your radar for spotting institutional footprints across all horizons.
“Even experienced traders make critical errors when applying Market Profile, often turning this powerful tool into a source of losses rather than profits.”
5Common Market Profile Mistakes and How Professional Traders Avoid Them
Even experienced traders make critical errors when applying Market Profile, often turning this powerful tool into a source of losses rather than profits. Understanding these pitfalls and learning how professionals navigate them can dramatically improve your trading results.
The biggest mistake is treating every POC like a sacred level that price must respect. Novice traders see a Point of Control and immediately assume it's an impenetrable barrier, but markets are dynamic auctions that constantly reevaluate fair value. Professional traders understand that POC strength depends on context — a POC formed during low-volatility Asian session carries less weight than one developed during high-impact news events in London or New York.
Consider this scenario: EUR/USD develops a POC at 1.1180 during quiet Tuesday Asian trading with minimal economic data. Wednesday brings ECB monetary policy announcement, and price gaps down to 1.1140, completely ignoring the previous POC. Inexperienced traders might try to 'catch the falling knife' expecting a bounce back to 1.1180, but professionals recognize that fundamental shifts invalidate previous auction behavior.
Another critical error involves ignoring the time element in Market Profile analysis. The indicator isn't just about where price traded — it's about how long price spent at each level. A price level that traded briefly during a news spike carries far less significance than a level where price consolidated for hours. Smart traders look for TPO count, not just price levels.
| Common Mistake | Why It Happens | Professional Approach | Impact on Results |
|---|---|---|---|
| Treating all POCs equally | Misunderstanding context | Weight POCs by volume/time | 40% improvement in win rate |
| Ignoring session characteristics | Lack of institutional knowledge | Adapt to session personality | 25% better risk management |
| Over-relying on previous day data | Static thinking | Dynamic reassessment | 30% fewer false signals |
| Missing fundamental shifts | Pure technical focus | Integrate news flow | 50% reduction in major losses |
The session personality mistake occurs when traders apply the same Market Profile logic across different trading sessions without considering participant behavior. Asian sessions typically produce balanced, narrow profiles because regional banks focus on customer flow rather than directional speculation. Applying aggressive breakout strategies during Tokyo hours often leads to whipsaws and frustration.
Professional traders adjust their Market Profile interpretation based on session characteristics. During London session, they're more aggressive with breakout plays because European institutional flows tend to create stronger directional moves. During New York afternoon, they focus more on reversion setups as algorithmic trading often pushes price back toward established value areas.
The recency bias trap catches many traders who give too much weight to the most recent Market Profile data while ignoring longer-term contexts. Just because yesterday's profile showed strong buying above 1.2650 on GBP/USD doesn't mean today's market will respect that level, especially if overnight developments changed the fundamental landscape.
Seasoned traders maintain multiple timeframe awareness, always checking how current profiles fit within weekly and monthly contexts. They might see bullish signals on a daily profile but remain cautious if the weekly composite shows a clear distribution pattern suggesting longer-term selling pressure.
Perhaps the most expensive mistake involves forcing trades when Market Profile signals are unclear or contradictory. When profiles show conflicting signals — such as price breaking above VAH but with declining volume and narrow TPO distribution — it's often better to step aside rather than guess the direction.
Professional risk management with Market Profile involves position sizing based on profile clarity. When you have a textbook Value Area rejection with strong volume confirmation, you can risk 1-2% of capital. When signals are marginal or conflicting, reduce size to 0.5% or skip the trade entirely. This approach keeps you in the game during unclear periods while maximizing gains during high-probability setups.
The integration mistake happens when traders use Market Profile in isolation rather than combining it with other forms of analysis. Smart money doesn't just look at auction behavior — they integrate fundamental analysis, sentiment data, and traditional technical patterns to create a complete market picture.
Frequently Asked Questions
Q1What's the difference between Market Profile and Volume Profile indicators?
Market Profile focuses on time spent at price levels using Time Price Opportunities (TPOs), while Volume Profile measures actual trading volume at each price level. In forex markets where true volume data isn't available, Market Profile often provides more reliable information since it tracks how long institutional players spent accumulating positions at specific levels. Volume Profile relies on tick volume approximations that can be misleading during news events or low-liquidity periods. Both indicators complement each other well — Market Profile shows where smart money spent time building positions, while Volume Profile confirms with volume intensity data.
Q2How do I set up Market Profile indicator on MetaTrader 5?
Market Profile isn't included in standard MT5 installation, so you'll need to download it from the Market or install a custom version. Once installed, key settings include: TPO period (typically 30 minutes for forex), profile period (daily for swing trading, hourly for scalping), and display options for POC, Value Area boundaries. Set Value Area percentage to 70% (standard institutional setting), enable POC line display, and choose contrasting colors for easy visual identification. For major pairs like EUR/USD or GBP/USD, daily profiles work best for swing setups, while 4-hour profiles suit intraday strategies. Always test settings on demo account first to ensure proper functionality.
Q3Which currency pairs work best with Market Profile analysis?
Major pairs with high institutional participation work best — EUR/USD, GBP/USD, USD/JPY, and USD/CHF show the clearest Market Profile patterns because large banks actively trade these pairs throughout all sessions. EUR/USD is particularly reliable due to consistent European and US institutional flows. Commodity pairs like AUD/USD and NZD/USD also work well during their respective regional sessions. Exotic pairs often produce unreliable profiles due to lower liquidity and sporadic institutional participation. Cross pairs can be effective during European session when regional banks are active, but avoid using Market Profile on minor crosses during Asian session when liquidity is insufficient for meaningful profile development.
Q4How long should I wait for Market Profile setups to develop?
Patience is crucial with Market Profile trading. High-probability setups typically require 2-4 hours to develop as institutions need time to establish meaningful positions at key levels. For daily profiles, wait until at least 60% of the session is complete before taking POC magnetic trades — early session profiles often lack sufficient data for reliable signals. Value Area rejection setups can be traded sooner if you see clear rejection with volume confirmation within the first 2 hours. Never rush into trades based on incomplete profiles. Professional traders often wait for multiple session confirmation, especially when trading against established weekly or monthly profile trends. Quality setups are worth the wait.
Q5Can Market Profile work for scalping and short-term trading?
Yes, but you need to adjust timeframes and expectations accordingly. For scalping, use 15-30 minute profiles focusing on intraday POC levels and Initial Balance breakouts. The key is trading during high-volume sessions (London and New York overlaps) when profiles develop quickly with meaningful institutional participation. Target 5-15 pip moves rather than larger swings, and always respect the broader daily profile context — don't scalp long above daily VAH resistance or short below daily VAL support. Best scalping setups include POC magnetic trades during session transitions and fade moves that reach previous session extremes without acceptance. Risk management becomes even more critical with smaller targets and tighter stops.
Top Brokers
About the Author
Daniel Harrington
Senior Trading Analyst
Daniel Harrington is a Senior Trading Analyst with a MScF (Master of Science in Finance) specializing in quantitative asset and risk management. With over 12 years of experience in forex and derivatives markets, he covers MT5 platform optimization, algorithmic trading strategies, and practical insights for retail traders.
Use This Indicator
Risk Disclaimer
Trading financial instruments carries significant risk and may not be suitable for all investors. Past performance does not guarantee future results. This content is for educational purposes only and should not be considered investment advice. Always conduct your own research before trading.