Order Flow Indicator Guide: See Market Intentions Before They Move
Order Flow analysis examines real-time bid/ask transactions and pending orders to understand institutional positioning and predict short-term price direction.

Daniel Harrington
Senior Trading Analyst · MT5 Specialist
☕ 12 min read
Settings — OF
| Category | custom |
| Default Period | null |
| Best Timeframes | M1, M5, M15 |
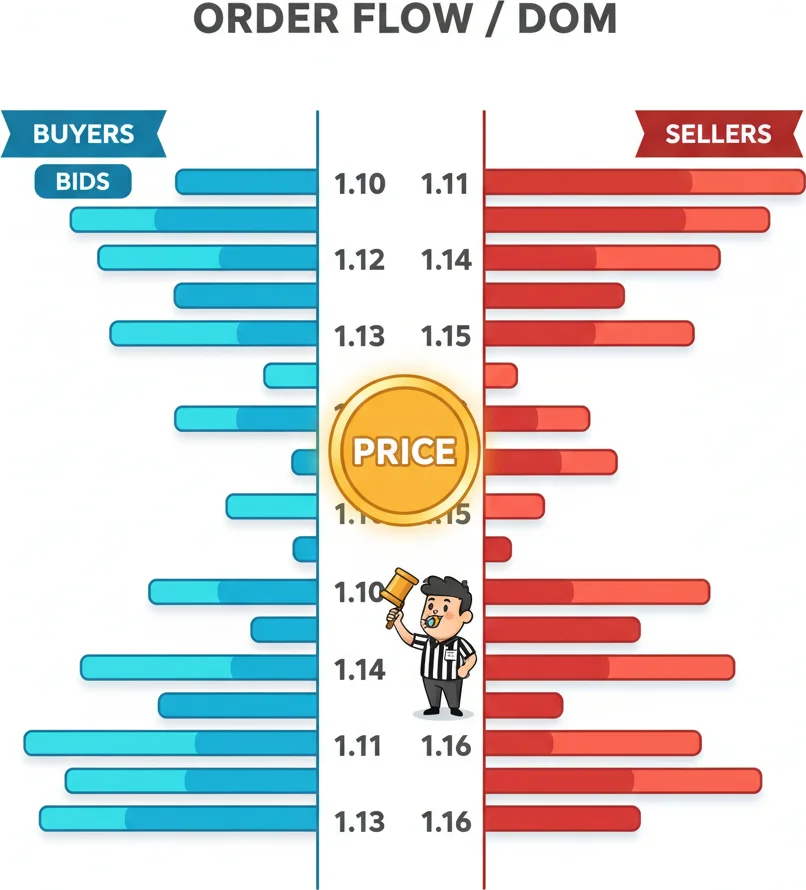
While 90% of retail traders stare at price charts wondering which way the market will move next, institutional traders have been reading order flow data for decades to see buying and selling pressure in real-time. The Order Flow indicator brings this institutional-level insight to your MetaTrader 5 platform, showing you not just where price has been, but revealing the actual battle between buyers and sellers as it happens. Think of it as having X-ray vision into the market's intentions—you'll see the accumulation and distribution happening behind every candlestick before the big moves occur.
Key Takeaways
- Order flow analysis originated in the futures pits of Chicago, where floor traders could literally see and hear the buyi...
- The most powerful aspect of order flow analysis lies in identifying volume imbalances—situations where buying and sellin...
- Delta represents the difference between buying and selling volume for each bar or time period, while Cumulative Volume D...
1The Institutional Secret Behind Order Flow Analysis
Order flow analysis originated in the futures pits of Chicago, where floor traders could literally see and hear the buying and selling pressure around them. When electronic trading took over, this crucial information moved to digital displays showing bid/ask volumes, trade sizes, and price level activity. The Order Flow indicator for MT5 recreates this environment by analyzing tick-by-tick data to show you volume at each price level.
Unlike traditional volume indicators that just show total volume for a time period, order flow breaks down exactly where that volume occurred and whether it was aggressive buying (hitting the ask) or aggressive selling (hitting the bid). This distinction is crucial because it reveals market sentiment at specific price levels.
The indicator typically displays as a histogram or heatmap overlay on your price chart, with different colors representing buying versus selling volume. Green usually indicates net buying pressure (volume hitting the ask), while red shows net selling pressure (volume hitting the bid). The intensity of the color or height of the bars shows the relative strength of that pressure.
For example, if EUR/USD is trading at 1.0850 and you see heavy green volume at 1.0845, it suggests strong buying interest at that level—a potential support zone. Conversely, heavy red volume at 1.0860 might indicate selling pressure and potential resistance.
The beauty of order flow is its real-time nature. While traditional indicators lag because they're based on closed candles, order flow updates with every tick, giving you immediate feedback on market sentiment shifts. This makes it invaluable for scalping and day trading strategies where timing is everything.
Understanding order flow also helps explain why certain support and resistance levels hold or break. When you see imbalanced order flow at key levels, you can anticipate whether price will bounce or break through with more confidence than using price action alone.
2Reading Volume Imbalances Like a Market Maker
The most powerful aspect of order flow analysis lies in identifying volume imbalances—situations where buying and selling pressure is significantly skewed at certain price levels. These imbalances often precede major price movements and give you early warning signals that most traders miss.
A volume imbalance occurs when there's a significant difference between buying and selling volume at a price level. For instance, if 1,000 lots hit the bid at EUR/USD 1.0850 while only 200 lots hit the ask, you have a strong selling imbalance that suggests downward pressure.
Let's look at practical imbalance patterns:
| Imbalance Type | Signal | Trading Opportunity | Risk Management |
|---|---|---|---|
| Absorption | Heavy volume, price doesn't move | Reversal setup | Stop beyond imbalance level |
| Exhaustion | Volume decreases as price extends | Fade the move | Tight stops on weakness |
| Breakout | Volume increases with price move | Follow momentum | Trail stops aggressively |
Absorption is particularly powerful. Imagine GBP/USD hitting a resistance level at 1.2500. You see massive red volume (selling pressure) but price barely moves down. This suggests buyers are absorbing all the selling—a sign that a breakout above 1.2500 is likely.
Exhaustion patterns work oppositely. If USD/JPY is rallying but you notice green volume decreasing at each higher level, it suggests buying interest is waning. This often precedes pullbacks or reversals.
Breakout confirmations become much more reliable with order flow. When EUR/USD breaks above 1.0900 resistance, traditional analysis might leave you wondering if it's a false breakout. But if you see heavy green volume driving through that level, you have confirmation that the move is likely genuine.
Timing your entries using these imbalances requires patience. Wait for the imbalance to develop fully—don't jump in on the first sign of unusual volume. The best setups often take several minutes to develop as the imbalance builds pressure.
Remember that imbalances are relative. What constitutes 'heavy' volume depends on the time of day, currency pair, and current market conditions. During London open, normal EUR/USD volume might be 10x higher than during Asian session, so adjust your expectations accordingly.

When you spot volume imbalances before the crowd notices the party started.
“Delta represents the difference between buying and selling volume for each bar or time period, while Cumulative Volume Delta (CVD) tracks the running total of these differences.”
3Delta and Cumulative Volume Delta Trading Strategies
Delta represents the difference between buying and selling volume for each bar or time period, while Cumulative Volume Delta (CVD) tracks the running total of these differences. These metrics form the backbone of advanced order flow strategies and can dramatically improve your trade timing and directional bias.
Delta is calculated as: Delta = Buy Volume - Sell Volume. A positive delta means more aggressive buying than selling, while negative delta indicates selling dominance. The key insight comes from comparing delta to price action—when they diverge, it often signals upcoming reversals or continuation patterns.
For example, on a 5-minute EUR/USD chart, you might see price making higher highs while delta is declining. This bearish divergence suggests that despite price strength, underlying buying pressure is weakening—a warning that a reversal may be coming.
Cumulative Volume Delta takes this further by adding up all delta values from a chosen starting point. CVD trending upward indicates persistent buying pressure over time, even if individual candles show mixed signals. When CVD and price trend in the same direction, it confirms the move's strength.
Here's a practical CVD strategy for GBP/USD:
- Start CVD calculation at the London session open (8 AM GMT)
- If CVD is rising while price consolidates, prepare for upside breakout
- Enter long when price breaks consolidation resistance with positive delta confirmation
- Exit when CVD starts declining or hits your profit target
Divergence strategies work exceptionally well with delta:
| Divergence Type | Price Action | Delta Signal | Expected Outcome |
|---|---|---|---|
| Bullish | Lower lows | Higher delta lows | Upward reversal |
| Bearish | Higher highs | Lower delta highs | Downward reversal |
| Hidden Bullish | Higher lows | Lower delta lows | Trend continuation up |
| Hidden Bearish | Lower highs | Higher delta highs | Trend continuation down |
One powerful technique is the 'delta flip'. During USD/CAD downtrends, watch for candles that close red but have positive delta. This suggests buying interest is emerging despite the down close. If you see 2-3 consecutive candles with this pattern, it often precedes bounce or reversal.
For scalping, focus on delta exhaustion. When AUD/USD is falling and you see increasingly negative delta values, watch for the delta to suddenly turn positive—this often marks short-term bottoms perfect for quick scalps.
Remember that delta works best on timeframes where you have sufficient tick data. On 1-minute charts during active sessions, delta signals are most reliable. On higher timeframes or during slow periods, the signals may be less meaningful.
4Footprint Charts and Market Profile Integration
Footprint charts represent the ultimate evolution of order flow visualization, showing you exactly how much volume traded at each price level within every candle. When combined with Market Profile concepts, this creates a comprehensive view of market structure that most retail traders never see.
A footprint chart replaces traditional candlesticks with detailed volume information. Each price level within a candle shows bid volume on the left, ask volume on the right, and often delta in between. This granular view reveals the micro-battles between buyers and sellers that create each candle.
Let's say EUR/USD forms a bullish engulfing candle on your 15-minute chart. Traditional analysis might see this as straightforward bullish signal. But the footprint might reveal that most volume occurred at the candle's midpoint with heavy selling, while the high was reached on minimal volume—suggesting the move lacks conviction.
Key footprint patterns to watch:
| Pattern | Description | Trading Signal | Timeframe |
|---|---|---|---|
| Volume Nodes | High volume clusters at specific prices | Support/Resistance levels | Any |
| Selling Tails | Heavy ask volume at candle tops | Resistance and reversal | 5-15 min |
| Buying Tails | Heavy bid volume at candle bottoms | Support and bounce | 5-15 min |
| Balanced Nodes | Equal bid/ask volume | Neutral zone, breakout pending | 15-60 min |
Market Profile integration adds another dimension by showing where price spent the most time and where the highest volume occurred. The Value Area (where 70% of volume traded) becomes your primary reference for support and resistance.
For GBP/USD day trading, start by identifying the previous day's Value Area High (VAH) and Value Area Low (VAL). These levels often act as magnetic points for price. If price opens below VAL and footprint charts show buying volume increasing as price approaches VAL, it suggests a likely test of that level.
The Point of Control (POC)—the price level with the highest volume—acts as the strongest support or resistance. When USD/JPY approaches the previous session's POC from below, look at your footprint chart for absorption patterns. Heavy selling that doesn't drive price lower often indicates the POC will hold as support.
Inventory concepts become crucial here. Market makers accumulate inventory when they believe price will move in their favor. Footprint charts reveal this accumulation through persistent bid or ask volume at specific levels. When you see consistent buying at 1.0800 in EUR/USD over multiple sessions, it suggests institutional accumulation—a bullish sign for higher timeframes.
Combining footprint analysis with traditional technical levels creates powerful confluence. If USD/CAD approaches a monthly resistance level and footprint charts show selling volume spiking exactly at that level, you have both technical and order flow confirmation for a potential short setup.
The key is patience—wait for clear footprint patterns to develop rather than reacting to every volume spike. Quality setups often take time to materialize.

That moment when footprint charts reveal the epic comeback story hidden in plain sight.
“Each major trading session has distinct order flow characteristics that smart traders exploit.”
5Advanced Order Flow Setups for Different Market Sessions
Each major trading session has distinct order flow characteristics that smart traders exploit. Understanding these patterns allows you to adjust your order flow analysis for maximum effectiveness across Asian, European, and North American sessions.
Asian Session (Tokyo): Characterized by lower volume and range-bound trading, Asian session order flow tends to be more balanced. The key is identifying accumulation and distribution patterns that set up moves for the European open.
During Tokyo hours, focus on USD/JPY and AUD/USD order flow. Look for quiet accumulation—periods where price consolidates but CVD shows gradual buying or selling pressure building. These often resolve dramatically when London opens.
A classic Asian setup: AUD/USD consolidates between 0.6750-0.6780 during Tokyo session. Your order flow shows persistent positive delta despite sideways price action. This accumulation often leads to upside breakouts when European traders arrive and volume increases.
European Session (London): The highest volume session with aggressive institutional trading. Order flow moves become more pronounced and reliable. Focus on EUR pairs, GBP pairs, and any USD majors.
The London open (8 AM GMT) frequently sees order flow imbalances as overnight positions get adjusted. Watch for absorption patterns in the first hour—these often signal the session's directional bias.
Example European strategy for EUR/USD:
- Monitor pre-London order flow for accumulation signs
- At 8 AM GMT, watch for large delta spikes indicating institutional activity
- Trade breakouts from overnight ranges when supported by strong order flow
- Target previous day's high/low or key technical levels
North American Session (New York): Overlaps with European session create maximum volatility and clearest order flow signals. USD pairs show strongest patterns, with particular focus on major news releases.
| Session | Best Pairs | Key Patterns | Strategy Focus |
|---|---|---|---|
| Asian | USD/JPY, AUD/USD | Accumulation/Distribution | Range breakout setups |
| European | EUR/USD, GBP/USD | Strong directional flow | Trend following |
| American | All USD majors | News-driven imbalances | Event trading |
News events create unique order flow opportunities. Before major announcements like NFP or Fed decisions, you'll often see order flow going quiet—delta values decrease and volume drops. This represents the calm before the storm.
Post-news order flow analysis is crucial. Initial price spikes often lack sustainable order flow, leading to reversals. Wait for the dust to settle, then look for genuine order flow supporting the new direction.
For example, if EUR/USD spikes 50 pips on ECB news but order flow shows minimal follow-through buying, prepare for a reversal trade. Conversely, if you see sustained positive delta supporting the move, the trend likely continues.
Session transition periods offer excellent opportunities. As European session winds down and American session ramps up, watch for order flow shifts. European profit-taking often creates temporary reversals that American traders exploit.
Remember that order flow effectiveness varies by volatility. During high-impact news or market stress, order flow signals become more pronounced and reliable. During holiday periods or low volatility, the signals may be less meaningful and require larger filters to avoid false signals.
Always adjust your position sizing based on session characteristics—European session's higher volatility might warrant smaller positions than Asian session's calmer conditions.
Frequently Asked Questions
Q1What's the difference between Order Flow and regular volume indicators?
Regular volume indicators only show total trading volume for a time period, while Order Flow breaks down that volume into buying pressure (aggressive orders hitting the ask) versus selling pressure (aggressive orders hitting the bid). This distinction reveals market sentiment at specific price levels. For example, if EUR/USD shows high volume but regular indicators can't tell you if it was buyers or sellers driving that volume. Order Flow shows you exactly who was in control—crucial information for predicting price direction. Additionally, Order Flow updates tick-by-tick in real-time, while most volume indicators only update when candles close, making Order Flow much more responsive for active trading strategies.
Q2Can I use Order Flow indicators on MT5 demo accounts or do I need live data?
Most Order Flow indicators work on MT5 demo accounts, but their accuracy is limited because demo accounts often use simulated tick data rather than real market data. For basic learning and strategy development, demo is fine, but serious Order Flow analysis requires live data feeds. The tick-by-tick information that Order Flow indicators rely on needs to reflect actual market transactions, not artificial price movements. Some brokers provide better demo data than others, so test your Order Flow indicator during active market sessions. If you see realistic volume patterns and delta calculations that make sense with price action, your demo feed is adequate for learning. However, transition to live accounts when you're ready to trade real money.
Q3Which timeframes work best for Order Flow analysis in forex?
Order Flow analysis works best on timeframes between 1-minute and 15-minutes for forex, with 5-minute charts being the sweet spot for most strategies. Lower timeframes like tick charts or 30-second charts provide too much noise, while higher timeframes like hourly or daily don't capture the granular volume data that makes Order Flow powerful. The key is having enough tick data to create meaningful volume statistics. During active sessions like London and New York overlap, even 1-minute charts work well. During slower Asian sessions, stick to 5 or 15-minute timeframes. Your chosen timeframe should match your trading style—scalpers use 1-5 minute charts, while swing traders might use 15-minute to 1-hour for Order Flow confirmation of longer-term setups.
Q4How do I set up Order Flow indicators properly on MT5?
First, ensure your MT5 platform has real tick data by checking that 'Request real ticks' is enabled in settings. Download a reputable Order Flow indicator from the MQL5 marketplace or your broker's custom indicators. Key settings to configure include: Volume calculation method (tick volume vs real volume if available), Delta calculation period (typically 14-20 periods), and display colors for buying vs selling pressure (green/red is standard). Set your chart timeframe to 5-minutes initially, and enable the maximum number of bars in history for better context. Some indicators require specific broker data feeds, so verify compatibility with your broker. Start with default settings, then adjust sensitivity based on your pair's typical volume patterns—major pairs like EUR/USD need higher thresholds than exotic pairs.
Q5What are the most common mistakes traders make with Order Flow analysis?
The biggest mistake is overtrading every volume spike or delta change—Order Flow should confirm your analysis, not generate trades alone. Many traders also ignore session characteristics, trying to apply European session strategies during quiet Asian hours when volume is insufficient for reliable signals. Another common error is misunderstanding delta divergences, seeing bearish signals in normal profit-taking activity during uptrends. Traders also frequently use inadequate position sizing, not accounting for the increased accuracy but also increased noise that Order Flow provides. Finally, many ignore the time factor—Order Flow patterns need time to develop, but traders often jump in too early. Wait for clear imbalances to build and confirm with price action before entering trades. Remember, Order Flow is about probability enhancement, not crystal ball predictions.
Top Brokers
About the Author
Daniel Harrington
Senior Trading Analyst
Daniel Harrington is a Senior Trading Analyst with a MScF (Master of Science in Finance) specializing in quantitative asset and risk management. With over 12 years of experience in forex and derivatives markets, he covers MT5 platform optimization, algorithmic trading strategies, and practical insights for retail traders.
Use This Indicator
Risk Disclaimer
Trading financial instruments carries significant risk and may not be suitable for all investors. Past performance does not guarantee future results. This content is for educational purposes only and should not be considered investment advice. Always conduct your own research before trading.