Rectangle Pattern Indicator: Complete Trading Guide
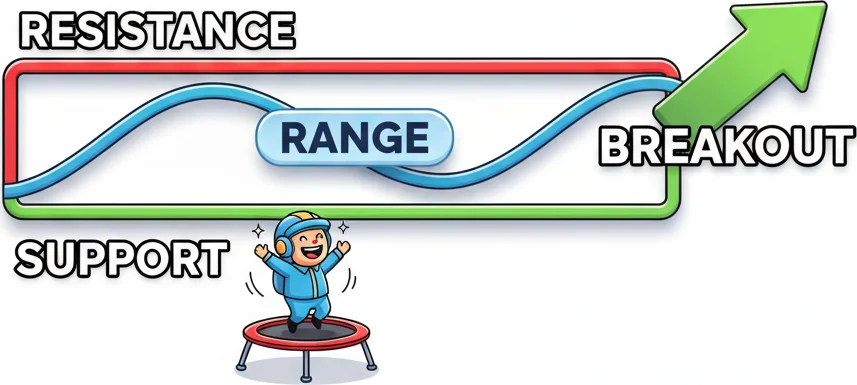
Rectangle pattern forms when price consolidates between horizontal support and resistance levels, representing a pause before the trend continues or reverses.

Daniel Harrington
Senior Trading Analyst · MT5 Specialist
☕ 8 min read
Settings — Rect
| Category | chart-pattern |
| Default Period | null |
| Best Timeframes | H1, H4, D1 |
The Rectangle pattern is one of the few technical setups where doing nothing — waiting inside the box — is actually the correct trade. Price consolidates between a flat support and resistance ceiling, coiling energy before a directional move. Get the breakout right, and you're entering exactly when institutional money is committing to a new trend leg.
Key Takeaways
- The indicator scans the last 40 candles (the default lookback period) and identifies two or more swing highs at roughly ...
- A bullish signal triggers when price closes above the rectangle's resistance ceiling with above-average volume. A bearis...
- Counterintuitively, the default lookback of 40 doesn't need much adjustment across timeframes — what changes is how you ...
1How the Rectangle Indicator Works: Detecting Consolidation Zones
The indicator scans the last 40 candles (the default lookback period) and identifies two or more swing highs at roughly the same price level and two or more swing lows at roughly the same level. When those horizontal bands are close enough — typically within 0.5% to 1% of each other — the algorithm draws the rectangle boundaries. No complex math required. The engine is essentially finding flat-topped and flat-bottomed price structures automatically.
What makes this mechanical rather than subjective is the lookback parameter. With lookback set to 40, the indicator ignores older price history and focuses on recent structure. A 40-bar lookback on H4 covers roughly 6.5 trading days — enough to capture meaningful consolidation without getting distorted by older swings.
The rectangle is confirmed only when price has touched each boundary at least twice. A single touch is noise. Two touches define the zone. Three or more touches strengthen it significantly, because each touch represents a tested and defended price level.
2Rectangle Breakout Signals: How to Read Buy, Sell, and False Breaks
A bullish signal triggers when price closes above the rectangle's resistance ceiling with above-average volume. A bearish signal triggers on a close below the support floor. The close matters — wicks that poke through and snap back are the market hunting stops, not genuine breakouts.
In 2023, EUR/USD spent 11 sessions in a tight rectangle on the H4 chart between 1.0820 and 1.0890. When price broke above 1.0890 on a candle that closed 30 pips clear of the top, the subsequent move ran 180 pips in four days. The rectangle's height — 70 pips — served as the minimum measured move target, and price exceeded it by 2.5x.
False breakouts are the real danger. What I look for before trusting a break: a retest of the broken boundary that holds as new support or resistance. A breakout that immediately comes back inside the rectangle within two candles is a trap. Mark that failed break as a signal in the opposite direction — trapped breakout traders will fuel the reversal.
Divergence context also matters. If RSI is making lower highs while price makes equal highs inside the rectangle, that's a bearish bias setup. The rectangle isn't telling you direction — divergence is. Use both.

When you think you spotted a breakout but the rectangle says 'nope, still consolidating!'
“Counterintuitively, the default lookback of 40 doesn't need much adjustment across timeframes — what changes is how you interpret the signals, not the detection window.”
3Optimal Rectangle Settings by Timeframe: H1, H4, and D1
Counterintuitively, the default lookback of 40 doesn't need much adjustment across timeframes — what changes is how you interpret the signals, not the detection window.
On H1, a 40-bar lookback covers roughly 40 hours of price action — about 5 trading sessions. Rectangles form quickly here, often lasting 8 to 15 candles. These are scalp and intraday setups. Breakout targets are smaller (20 to 50 pips on major pairs), and false breaks are more frequent. Reduce position size accordingly.
On H4, the 40-bar window spans about 6.5 days. This is the sweet spot for the Rectangle indicator. Consolidations are meaningful, breakouts carry momentum from genuine supply/demand imbalances, and measured moves of 80 to 200 pips are realistic. Most professional swing traders anchor their rectangle analysis here.
On D1, 40 bars equals 8 weeks of data. Rectangles on this timeframe represent major accumulation or distribution phases. A D1 rectangle breakout can precede multi-week trends. The tradeoff is frequency — you might see only 3 to 5 valid setups per year on a single instrument. Patience is the strategy.
For aggressive breakout traders, consider dropping the lookback to 25 on H1 to catch shorter consolidations. For D1 position trading, increasing it to 60 filters out minor ranges and focuses on structurally significant zones.
4Practical Application: Building a Complete Rectangle Trade Setup
The rectangle gives you three things most traders underuse: a defined entry zone, a natural stop-loss level, and a measured move target. Build your trade around all three.
Entry: Wait for the breakout candle to close outside the rectangle boundary. Enter at market on candle close or on a limit order at the retest of the broken level — whichever fits your risk tolerance.
Stop-loss: Place it 10 to 15 pips inside the rectangle from the broken boundary. If the rectangle top was at 1.0890 on a bullish breakout, the stop sits around 1.0875 to 1.0880. This accounts for minor whipsaws without giving up too much.
Target: The measured move equals the height of the rectangle projected from the breakout point. A 60-pip rectangle broken to the upside targets 60 pips above the resistance ceiling. Scale out 50% at the measured move and trail the rest.
Pulsar Terminal makes this execution clean — once the rectangle boundary is identified, you can set multi-level SL/TP directly on the chart using Pulsar's one-click trading panel, with the stop pinned inside the box and two target levels pre-loaded before the breakout even triggers.
One filter that improves win rate significantly: only trade rectangles in the direction of the higher timeframe trend. A rectangle on H1 breaking upward means nothing if the D1 chart is in a strong downtrend. Trend alignment on the next timeframe up is the single most reliable way to separate high-probability setups from noise.

When volume finally confirms your rectangle breakout and everyone wants in on the action.
“The Rectangle pattern is one of several consolidation structures — triangles, flags, pennants, and wedges all compete for the same airtime.”
5Rectangle vs Other Consolidation Patterns: When Boxes Beat Triangles
The Rectangle pattern is one of several consolidation structures — triangles, flags, pennants, and wedges all compete for the same airtime. Knowing when the Rectangle has an edge over these alternatives saves you from forcing the wrong framework onto price action.
The Rectangle's defining advantage is clarity. Support and resistance are horizontal and obvious. You don't need to debate trendline angles or wonder whether the pattern is ascending, descending, or symmetrical. Price bounces between two flat levels, and when it stops bouncing, the breakout direction gives the trade. This simplicity makes Rectangles particularly useful for newer traders who struggle with the subjectivity of diagonal trendline patterns.
Compared to triangles, Rectangles tend to produce more reliable measured-move targets. Triangle breakouts frequently overshoot or undershoot their projections because the converging trendlines create ambiguity about where to measure the pattern's height. A Rectangle's height is constant — it's the same width at every point — so the measured move calculation is straightforward and consistent.
The main disadvantage is that Rectangles take longer to form. A triangle compresses price naturally toward an apex and forces a breakout. A Rectangle can theoretically persist indefinitely because the boundaries are parallel. EUR/USD spent over three months in a daily Rectangle between 1.0550 and 1.0750 in early 2024, testing patient traders who were waiting for the resolution. Position management during these extended consolidations requires discipline — the temptation to trade inside the box for small bounces can eat into capital through spread costs and false signals.
One practical edge that Rectangles offer over other consolidation patterns: the failed breakout counter-trade. Because the boundaries are so clearly defined, a breakout that fails and re-enters the Rectangle creates an extremely clean entry in the opposite direction. Trapped breakout traders become forced sellers (or buyers), fueling the reversal. This failed-breakout setup has a notably higher win rate than failed-breakout trades on diagonal patterns, precisely because the horizontal boundaries leave no room for interpretation about what constitutes a genuine failure.
For best results, use Rectangles on H4 and D1 charts where the consolidation represents genuine institutional accumulation or distribution, and always confirm breakouts with volume expansion and alignment with the higher-timeframe trend.
Frequently Asked Questions
Q1How many times should price touch each boundary before the Rectangle is valid?
A minimum of two touches on each boundary — four total — is required to confirm the Rectangle. A single touch defines a potential level; two touches confirm it's being respected. Three or more touches on each side produce the strongest patterns because each additional test demonstrates that the market is genuinely defending those price levels. A Rectangle identified after just one touch on the upper boundary and two on the lower is premature — you have support but not confirmed resistance.
Q2How do you tell if a Rectangle will break up or down?
The Rectangle itself is direction-neutral — it doesn't predict which way the breakout will go. However, three contextual clues help: the prior trend (Rectangles within uptrends break upward roughly 65% of the time), volume patterns (declining volume on tests of resistance and increasing volume on tests of support suggests bullish bias), and momentum divergence (RSI making higher lows while price makes equal lows within the Rectangle points to upside resolution). The safest approach is to wait for the breakout rather than predict it.
Q3What is the measured move target for a Rectangle breakout?
The measured move equals the height of the Rectangle — the vertical distance between support and resistance — projected from the breakout point in the breakout direction. If the Rectangle spans from 1.0820 to 1.0890 (70 pips), a bullish breakout projects a target of 1.0960 (70 pips above resistance). A bearish breakdown projects 1.0750 (70 pips below support). In practice, strong Rectangle breakouts frequently exceed this measured move by 1.5x to 2.5x, especially when the consolidation was prolonged, but the measured move is the minimum expectation.
Q4How do you handle false breakouts from a Rectangle?
False breakouts — price piercing a boundary then snapping back inside within 1-2 candles — are the Rectangle's main risk. The primary defense is requiring a full candle close outside the boundary, not just an intrabar wick. A secondary filter is waiting for a retest of the broken boundary that holds as new support or resistance. If price breaks above resistance and then retests it without falling back inside, the breakout is confirmed. If it immediately falls back inside, treat it as a failed breakout and consider trading the opposite direction — trapped breakout traders will fuel the reversal move.
Q5Can you trade bounces inside the Rectangle instead of waiting for a breakout?
Yes, but with important caveats. Buying at support and selling at resistance within a well-defined Rectangle is a viable mean-reversion strategy — it offers more frequent trades than waiting for the breakout. However, the risk-reward is inherently limited because you're targeting the opposite boundary (the Rectangle's height) minus your stop distance. On narrow Rectangles (under 40 pips on EUR/USD H4), the profit potential after spread costs is minimal. Range-trading works best on wide Rectangles (80+ pips) where you can use tight stops near the boundaries and target meaningful moves to the opposite side.
Top Brokers
About the Author
Daniel Harrington
Senior Trading Analyst
Daniel Harrington is a Senior Trading Analyst with a MScF (Master of Science in Finance) specializing in quantitative asset and risk management. With over 12 years of experience in forex and derivatives markets, he covers MT5 platform optimization, algorithmic trading strategies, and practical insights for retail traders.
Use This Indicator
Risk Disclaimer
Trading financial instruments carries significant risk and may not be suitable for all investors. Past performance does not guarantee future results. This content is for educational purposes only and should not be considered investment advice. Always conduct your own research before trading.