Rounding Bottom Pattern: Complete Trading Guide
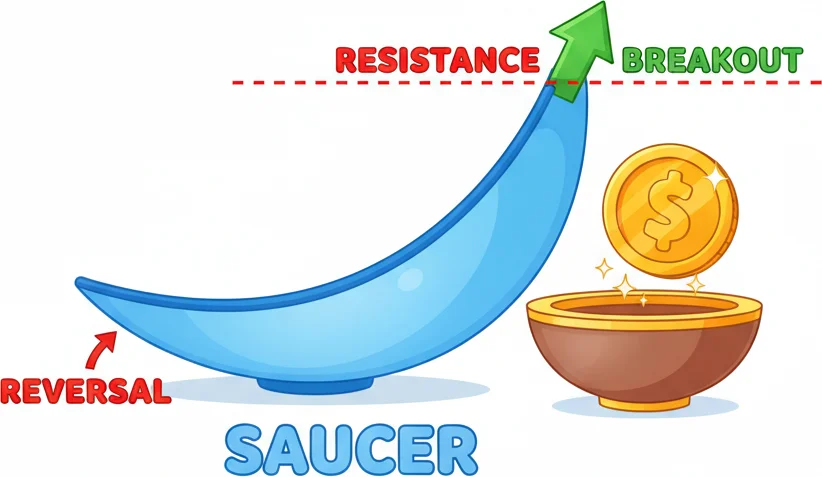
Rounding Bottom (saucer pattern) forms a gradual U-shaped curve indicating a slow transition from bearish to bullish sentiment over an extended period.

Daniel Harrington
Senior Trading Analyst · MT5 Specialist
☕ 8 min read
Settings — Rounding
| Category | chart-pattern |
| Default Period | null |
| Best Timeframes | D1, W1 |
The Rounding Bottom is one of the slowest-forming reversal patterns in technical analysis — and that's precisely what makes it reliable. Unlike head-and-shoulders or double bottoms that resolve in days, this gradual U-shaped curve can take weeks or months to complete, filtering out the noise that traps impatient traders. What you get at the end is a high-conviction shift from bearish to bullish sentiment with clear, measurable entry and target levels.
Key Takeaways
- The Rounding Bottom — sometimes called a saucer pattern — doesn't rely on a formula in the traditional indicator sense. ...
- Surprising fact: the most common mistake with Rounding Bottoms is entering too early — specifically, at the very base of...
- The default lookback of 100 bars is calibrated specifically for daily and weekly charts. On D1, 100 bars covers roughly ...
1How the Rounding Bottom Pattern Forms (The Math, Simplified)
The Rounding Bottom — sometimes called a saucer pattern — doesn't rely on a formula in the traditional indicator sense. Instead, it uses a lookback period (default: 100 bars) to identify a price curve that resembles a parabolic arc turning upward. The algorithm fits price lows across that window and checks whether the curvature transitions from negative (downward slope) to positive (upward slope) in a smooth, gradual manner.
Compared to V-shaped reversals, which spike and recover sharply, the Rounding Bottom requires sustained, gentle deceleration of selling pressure followed by an equally gradual acceleration of buying. Volume is the hidden confirmation: it typically mirrors the price shape, declining as price bottoms and expanding as price climbs the right side of the arc.
The math underneath is essentially a curve-fitting exercise over the 100-bar window. If the regression of price lows produces an R² value consistent with a parabolic arc rather than a flat line or sharp V, the pattern is flagged. Practically speaking, you're looking for price to make progressively higher lows across the right half of the formation — not a single bounce, but a sequence of them.
2Signal Interpretation: When to Buy, When to Wait, and What Divergence Looks Like
Surprising fact: the most common mistake with Rounding Bottoms is entering too early — specifically, at the very base of the U rather than at the breakout above the neckline.
The neckline is drawn horizontally across the two swing highs that bracket the arc. On a D1 chart, a confirmed buy signal triggers when price closes above this neckline with volume at least 20-30% above its 20-bar average. That close is your entry trigger, not the moment price first touches the line.
Divergence signals work as a secondary confirmation tool. If RSI or MACD shows bullish divergence while price is still forming the base of the arc — making lower lows while momentum makes higher lows — that's an early warning that the pattern is developing authentically. Compared to patterns without this divergence, Rounding Bottoms with RSI divergence at the base have historically shown stronger follow-through on the breakout.
Sell signals from this pattern are straightforward: if price breaks back below the neckline after a confirmed breakout, the pattern has failed. In my experience, a failed Rounding Bottom that closes back below the neckline by more than 1.5% often accelerates downward quickly, making that level a logical hard stop.
For measured targets, project the depth of the arc (distance from neckline to the lowest point of the base) upward from the breakout point. On a stock or forex pair where the arc depth was 8%, your minimum target sits 8% above the neckline.

Rounding bottoms form slowly - patience beats rushing into every dip you see.
“The default lookback of 100 bars is calibrated specifically for daily and weekly charts.”
3Optimal Settings by Timeframe: D1 and W1 Give the Cleanest Reads
The default lookback of 100 bars is calibrated specifically for daily and weekly charts. On D1, 100 bars covers roughly 5 months of trading — enough to capture a full sentiment cycle without including irrelevant historical noise. On W1, 100 bars extends back nearly 2 years, which is where major institutional accumulation patterns become visible.
Unlike shorter timeframes where the pattern degrades into random noise, D1 and W1 produce arc formations that reflect genuine shifts in supply and demand. On an H4 chart, a 100-bar lookback covers only 17 days — far too short for a meaningful saucer to develop. The pattern loses statistical significance below D1.
For W1 specifically, I adjust my expectation: breakouts on weekly charts often need 2-3 consecutive weekly closes above the neckline before committing full position size. A single weekly close can still be a false breakout. Compared to D1 where one confirmed close is typically sufficient, W1 demands more patience at the entry.
If you're trading forex majors like EUR/USD, the D1 Rounding Bottom has been particularly effective in trend-reversal environments — the 2020-2021 USD weakness cycle produced several textbook saucer completions on major pairs. In commodity markets, W1 Rounding Bottoms on gold and crude oil have preceded some of the largest multi-month trends of the past decade.
Pulsar Terminal's multi-level SL/TP tools make it straightforward to set your stop at the arc low and your target at the measured projection directly on the chart, without switching between windows.
4Practical Trade Setup: Entry, Stop, and Target Mechanics
The Rounding Bottom offers one of the cleanest trade setups in pattern analysis because the structure provides natural levels for every component of the trade plan.
Entry: The confirmed entry triggers on a candle close above the neckline — the horizontal level connecting the two swing highs that bracket the arc. Volume should expand at least 20-30% above its 20-bar average on the breakout candle. A lower-risk alternative: wait for a pullback to the broken neckline and enter on a bounce that confirms the neckline as new support. This retest occurs in roughly 40-50% of cases.
Stop-loss: Place it below the most recent significant swing low on the right side of the arc — not at the very bottom of the saucer. Placing the stop at the arc's lowest point creates an unnecessarily wide stop that compresses your risk-reward ratio. The right-side swing low provides a tighter, structurally valid invalidation level.
Target: The measured move equals the depth of the arc (vertical distance from the neckline to the arc's lowest point) projected upward from the neckline breakout. On a D1 stock chart where the neckline sits at $50 and the arc bottom at $42, the minimum target is $58.
Position management: Consider scaling in rather than entering full size at the breakout. Start with 50% on the neckline break, add 25% on a successful retest, and add the final 25% when price clears the measured move's 50% mark. This approach reduces risk on false breakouts while still capturing most of the measured move.
One underrated edge: the volume curve during the pattern mirrors the price curve. Volume declines during the left side (selling exhaustion), reaches a minimum at the base (nobody trading = nobody selling), then gradually expands on the right side (accumulation). If volume doesn't follow this U-shaped pattern alongside price, the formation is structurally weaker and the breakout reliability drops.

When your entry timing hits right at the rounded bottom breakout.
“The Rounding Bottom is one of the least frequent chart patterns, and this rarity is a feature rather than a bug.”
5Why Rounding Bottoms Are Rare — and Why That's an Advantage
The Rounding Bottom is one of the least frequent chart patterns, and this rarity is a feature rather than a bug. Here's why.
Most reversal patterns — Double Bottoms, Head and Shoulders, V-reversals — form when sentiment shifts abruptly. Panic selling followed by panic buying. Sharp reversals driven by news, earnings, or policy changes. The Rounding Bottom represents something fundamentally different: a gradual, sustained shift from bearish to bullish sentiment over weeks or months. This slow transition requires patient accumulation by institutional buyers who are building positions without moving the market — the antithesis of panic-driven reversals.
Because this type of accumulation is rare, the resulting breakout tends to be more sustainable than sharp reversal patterns. Institutions that spent weeks building positions during the arc aren't going to sell immediately after the breakout — they're holding for the longer-term move they positioned for. This is why Rounding Bottom breakouts frequently exceed their measured move targets, especially on D1 and W1 charts.
The pattern degrades on shorter timeframes for a structural reason: genuine institutional accumulation doesn't happen in hours. An H1 'rounding bottom' is usually just noise — random price fluctuation that coincidentally looks arc-shaped. The minimum viable timeframe is D1, where the pattern represents at least 3-5 months of price history with the 100-bar default lookback.
Sector and asset class context matters. Rounding Bottoms appear most frequently in individual stocks recovering from multi-month downtrends, gold during accumulation phases before major breakouts, and forex pairs during slow macro trend reversals (like USD weakness cycles). They're rare on indices because index composition changes dilute the individual stock dynamics that create the arc shape.
One limitation traders should be aware of: the pattern's slow formation makes it difficult to identify in real time. You can't know it's a Rounding Bottom until the right side of the arc has materially developed — and by then, some of the move has already happened. The neckline breakout is the practical trigger, but by that point you've missed the entire arc's appreciation. Accepting this late entry is the price of confirmation — entering earlier (during the arc) means you're guessing, not trading a confirmed pattern.
Frequently Asked Questions
Q1How long does a Rounding Bottom take to form?
On D1 charts with the 100-bar default lookback, the pattern typically takes 3-6 months to form — sometimes longer. On W1 charts, formation can span 1-2 years. This is one of the slowest-forming patterns in technical analysis, which is precisely what makes it reliable. The gradual U-shape reflects sustained institutional accumulation rather than a sharp, potentially false reversal. Patterns that try to 'round' in less than 6-8 weeks on D1 are usually too shallow to carry structural significance.
Q2What is the measured move target for a Rounding Bottom?
The measured move equals the depth of the arc — the vertical distance from the neckline to the lowest point of the saucer — projected upward from the neckline breakout. If the neckline is at $50 and the arc bottom at $42, the target is $58 ($50 + $8). In practice, Rounding Bottom breakouts frequently exceed this target, especially on D1 and W1 charts, because the pattern represents genuine institutional accumulation that drives sustained moves. Consider trailing a portion of your position beyond the measured move rather than closing everything at the target.
Q3Does the Rounding Bottom work on forex pairs?
Yes, but it's less common on forex than on individual stocks. The pattern works best on D1 forex charts during slow macro trend reversals — like the USD weakness cycles in 2020-2021, which produced textbook saucer completions on several major pairs. The most reliable forex Rounding Bottoms appear on pairs with strong fundamental shifts (changing central bank policy, economic recovery cycles) rather than purely technical conditions. Range-bound pairs like EUR/CHF rarely produce valid Rounding Bottoms.
Q4What role does volume play in the Rounding Bottom pattern?
Volume should mirror the U-shape of the price pattern. During the left side of the arc, volume declines as selling pressure exhausts itself. At the base, volume reaches a minimum — the market is quiet because sellers have run out and buyers haven't committed yet. On the right side, volume gradually increases as accumulation intensifies. Finally, volume should spike on the neckline breakout. If volume doesn't follow this U-shaped pattern, the formation is structurally weaker and the breakout is less likely to follow through.
Q5Why doesn't the Rounding Bottom work on short timeframes?
The pattern requires genuine institutional accumulation — large buyers gradually building positions over weeks or months without moving the market sharply. This process simply doesn't happen on H1 or H4 timeframes. An arc-shaped formation on a 4-hour chart spanning 17 days isn't institutional accumulation — it's random price action that coincidentally looks U-shaped. The minimum viable timeframe is D1, where the 100-bar lookback captures approximately 5 months of price history. Below D1, the pattern loses its structural foundation and the breakout reliability drops to near-random levels.
Top Brokers
About the Author
Daniel Harrington
Senior Trading Analyst
Daniel Harrington is a Senior Trading Analyst with a MScF (Master of Science in Finance) specializing in quantitative asset and risk management. With over 12 years of experience in forex and derivatives markets, he covers MT5 platform optimization, algorithmic trading strategies, and practical insights for retail traders.
Use This Indicator
Risk Disclaimer
Trading financial instruments carries significant risk and may not be suitable for all investors. Past performance does not guarantee future results. This content is for educational purposes only and should not be considered investment advice. Always conduct your own research before trading.