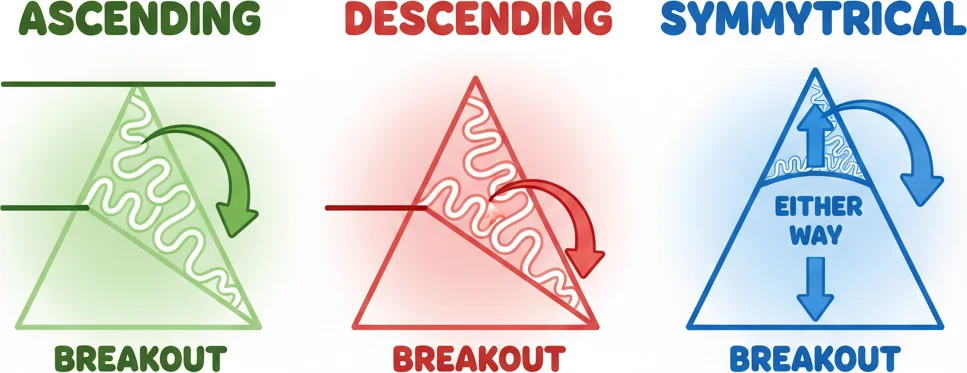
Triangle Patterns: Ascending, Descending & Symmetrical
Triangle patterns form as price consolidates between converging trendlines, with ascending triangles typically bullish, descending bearish, and symmetrical neutral until breakout.

Daniel Harrington
Senior Trading Analyst · MT5 Specialist
☕ 9 min read
Settings — Triangle
| Category | chart-pattern |
| Default Period | null |
| Best Timeframes | H1, H4, D1 |
Triangle chart patterns have been documented in technical analysis literature since the early 20th century, yet they remain among the most reliable consolidation signals available to modern traders. Price compresses between two converging trendlines — a geometry that reflects a genuine battle between buyers and sellers — before eventually breaking out with directional force. Understanding which triangle type is forming, and on which timeframe, determines whether that breakout is actionable or a false alarm.
Key Takeaways
- A triangle pattern requires at least two swing highs and two swing lows to define its converging trendlines. The indicat...
- Counterintuitively, ascending triangles break downward roughly 25–30% of the time, according to Thomas Bulkowski's patte...
- The default lookback of 50 bars behaves differently across the recommended timeframes, and adjusting it materially chang...
1How Triangle Patterns Form: The Math, Simplified
A triangle pattern requires at least two swing highs and two swing lows to define its converging trendlines. The indicator scans a lookback window of 50 bars by default, identifying local peaks and troughs and fitting linear regression lines through them. When the upper trendline slope and lower trendline slope converge toward a future apex point, the algorithm classifies the structure as a triangle.
The three variants differ by slope. An ascending triangle has a flat upper trendline — resistance at a consistent price level — and a rising lower trendline, indicating buyers are willing to pay progressively higher prices. A descending triangle reverses this: flat support below, declining resistance above, signaling sellers are accepting lower prices with each attempt. A symmetrical triangle shows both trendlines sloping toward each other at roughly equal angles, reflecting genuine indecision.
Volume behavior adds a second dimension. Research published in the Journal of Financial Markets (2018) found that triangle patterns accompanied by declining volume during consolidation and a volume spike at breakout produced statistically higher follow-through rates than those without volume confirmation. The pattern itself is geometric; the volume is the verification layer.
2Signal Interpretation: What Buy, Sell, and Neutral Readings Actually Mean
Counterintuitively, ascending triangles break downward roughly 25–30% of the time, according to Thomas Bulkowski's pattern statistics compiled across thousands of historical formations. The directional bias is probabilistic, not guaranteed.
For ascending triangles, a buy signal triggers when price closes above the flat resistance line with a candle body — not just a wick — breaching the level. The measured move target is calculated by taking the triangle's maximum height at its widest point and projecting it upward from the breakout level. If the triangle spans 150 pips at its base, the initial target is 150 pips above the breakout candle's close.
Descending triangles generate sell signals on a confirmed close below flat support, with the same measured-move calculation applied downward. Symmetrical triangles remain directionally neutral until breakout occurs in either direction. A close beyond either trendline, ideally on above-average volume, defines the signal. Breakouts occurring within the final 25% of the triangle's length — near the apex — are statistically weaker and produce more false signals, as the price compression has already dissipated much of its energy.
False breakouts are a persistent risk. A common filter is the '2% rule': the breakout candle must close at least 2% beyond the trendline before the signal is treated as confirmed. On tighter instruments like major forex pairs, traders often substitute a fixed pip threshold — typically 15–20 pips on EUR/USD — rather than a percentage.

When triangles squeeze price action tighter than your stop loss anxiety.
“The default lookback of 50 bars behaves differently across the recommended timeframes, and adjusting it materially changes which patterns the indicator detects.”
3Optimal Settings by Timeframe: H1, H4, and D1 Compared
The default lookback of 50 bars behaves differently across the recommended timeframes, and adjusting it materially changes which patterns the indicator detects.
On the H1 chart, 50 bars covers roughly two trading days. This captures short-term consolidation patterns — often intraday triangles that form during low-volatility sessions like the Asian overlap. These patterns tend to be smaller in scope, with measured moves of 20–60 pips on major pairs. Noise levels are higher, and false breakouts are more frequent, making additional confirmation filters (volume, RSI divergence, or a 15-minute retest of the broken trendline) particularly valuable.
The H4 timeframe is widely considered the most reliable setting for triangle detection. Fifty bars at H4 spans approximately eight trading days — enough to capture meaningful consolidation without the noise of shorter intervals. Breakouts from H4 triangles typically produce measured moves of 80–200 pips on EUR/USD or equivalent percentage moves on equity indices. Most documented triangle pattern research uses daily or 4-hour data as its base.
On D1 charts, 50 bars equals 10 weeks of trading. Triangles identified at this scale reflect macro-level consolidation — the kind that precedes multi-week or multi-month trending moves. A symmetrical triangle that forms over six to eight weeks on a daily chart and breaks with conviction frequently initiates trends that run for several months. The trade-off is patience: fewer signals, but historically larger follow-through.
Reducing the lookback to 30 bars on any timeframe captures shorter, tighter triangles. Extending it to 75–100 bars on D1 identifies only the largest, most structurally significant formations.
4Trading Triangle Breakouts: Entry, Stop, and Target Mechanics
Pattern detection is the easy part. Converting a triangle into a profitable trade requires a step-by-step framework that handles the messy reality of live execution.
Entry timing follows two schools. The aggressive approach enters on the close of the breakout candle — the first candle that closes beyond the trendline. This captures the full measured move but accepts a higher false-breakout rate, especially on H1. The conservative approach waits for a retest of the broken trendline. After an ascending triangle breaks above resistance, price often pulls back to test that resistance as new support. If it holds, enter long with a stop just below the retest low. Retests occur on roughly 50-60% of triangle breakouts, giving you a second entry opportunity with tighter risk.
Stop placement has a mechanical reference: the most recent swing low inside the triangle (for long entries) or the most recent swing high (for shorts). This level represents the point at which the triangle's internal structure is invalidated. On H4 ascending triangle breakouts, this typically places the stop 30-80 pips below entry depending on the triangle's size. Avoid placing stops at the opposite trendline — it's too wide and produces terrible risk-reward ratios.
Target calculation uses the measured move: the triangle's maximum height (at its widest point) projected from the breakout level. An ascending triangle with flat resistance at 1.1000 and a rising support from 1.0850 to 1.0950 has a maximum height of 150 pips (1.1000 - 1.0850). On a breakout above 1.1000, the measured target is 1.1150. Take 50% profit at the measured move and trail the rest — strong triangle breakouts frequently extend 1.5-2x the measured move.
Timing within the triangle matters. Breakouts occurring in the first 50% of the distance to the apex carry the most energy and produce the strongest follow-through. Breakouts in the 50-75% zone are still tradeable but tend to produce shorter moves. Breakouts in the final 25% near the apex are statistically the weakest — price has already dissipated much of its coiled energy through the extended compression, and these late breakouts have the highest failure rate.
One underutilized technique: if the triangle is clearly ascending (bullish bias) and price touches the rising lower trendline, you can take an early long entry at the support touch with a tight stop below the trendline. The measured move target on an internal bounce trade is the flat resistance level. If the trade works, you're already positioned before the breakout. If it fails and price breaks below the rising trendline, the triangle has been invalidated early and you exit with a small loss rather than waiting for a breakout that never comes.

Triangle breakouts: from sideways snooze-fest to warp speed in 3...2...1!
“Triangles fail more often than most traders expect, and understanding the failure modes is arguably more valuable than knowing the success patterns.”
5Triangle Failures: When the Pattern Lies and How to Adapt
Triangles fail more often than most traders expect, and understanding the failure modes is arguably more valuable than knowing the success patterns.
The most common failure is the false breakout — price closes beyond a trendline, triggers entries, then reverses back into the triangle. Ascending triangles break downward roughly 25-30% of the time, meaning one in four 'obvious' bullish setups goes the wrong way. Symmetrical triangles, being directionally neutral, produce false breakouts in both directions. The practical defense: never enter on the piercing candle itself. Wait for a close beyond the trendline, then watch the next 1-2 candles for confirmation. If the second candle re-enters the triangle, the breakout was a trap.
False breakouts create one of the strongest counter-signals in technical analysis. When an ascending triangle breaks below its rising support — the 'wrong' direction — the trapped longs create a cascade of selling that frequently exceeds the measured move in the opposite direction. Some professional traders specifically wait for triangle failures to trade the reversal, using the failed breakout as their entry signal and the triangle's opposite trendline as their target.
The apex fizzle is a subtler failure mode. Price reaches the apex of the triangle without breaking either trendline, then drifts sideways with declining volume. This indicates that the compressed energy has dissipated without resolution. The triangle effectively expires, and price enters a low-volatility range that offers no edge. When you see price spending more than 3-5 bars near the apex without breaking out, the pattern has likely expired. Close any pending orders and look for a fresh setup.
News-driven invalidation is the third failure mode. A triangle can form perfectly over two weeks, setting up a textbook breakout, and then a single high-impact news release (NFP, rate decision, geopolitical event) blows through the pattern so violently that the measured move is reached and exceeded in minutes. These events make the pattern's careful structure irrelevant. The practical solution: check the economic calendar before entering triangle breakout trades. If a major release is scheduled within 24 hours, either enter after the release or reduce position size to account for the unpredictability.
Finally, triangle patterns in low-volatility environments — when ATR is below its 20-period average — produce smaller measured moves with lower hit rates. The pattern needs genuine tension between buyers and sellers to create the coiled-spring effect. In flat markets where neither side is pushing, the triangle's convergence is mathematical rather than structural, and the breakout lacks the energy to follow through.
Frequently Asked Questions
Q1Which direction does a symmetrical triangle break?
A symmetrical triangle is directionally neutral — it can break either way. Unlike ascending triangles (bullish bias) or descending triangles (bearish bias), the symmetrical version has converging trendlines with no flat boundary. The breakout direction is determined by the prevailing trend: symmetrical triangles in uptrends break upward roughly 60% of the time, and those in downtrends break downward at a similar rate. If there's no clear trend, it's genuinely a coin flip, which is why waiting for the actual breakout rather than predicting the direction is the safest approach.
Q2How do you calculate the measured move target for a triangle breakout?
Measure the triangle's maximum height — the vertical distance between the upper and lower trendlines at the widest point (the pattern's origin). Project that distance from the breakout point in the breakout direction. For example: an ascending triangle with flat resistance at 1.1000 and the widest support point at 1.0850 has a height of 150 pips. An upside breakout targets 1.1150. This measured move is reached roughly 65-70% of the time on H4 and D1 charts when volume confirms the breakout.
Q3Why do triangle breakouts near the apex tend to fail?
Breakouts in the final 25% of the triangle (near the apex) fail more frequently because the compression has been ongoing too long — the coiled energy has gradually dissipated through the extended price squeeze. Early breakouts (in the first 50-75% of the distance to the apex) still carry significant pent-up energy from the initial divergence between buyers and sellers. By the time price reaches the apex, much of that tension has been absorbed through the many small oscillations, leaving less fuel for a powerful directional move.
Q4What is the difference between a triangle and a wedge?
Both have converging trendlines, but in a triangle, the trendlines converge toward each other from opposite directions — one slopes up, the other slopes down (in a symmetrical triangle), or one is flat while the other slopes (ascending/descending). In a wedge, both trendlines slope in the same direction — both up (rising wedge) or both down (falling wedge) — but at different angles. The key difference: triangles are typically continuation patterns, while wedges signal reversals. A rising wedge is bearish despite sloping upward; an ascending triangle is bullish despite having a similar upward-sloping lower trendline.
Q5Does volume matter for triangle pattern signals?
Volume is critical for confirming triangle breakouts. During the formation phase, volume should decline progressively as price compresses — fewer participants are willing to trade within the narrowing range. On the breakout candle, volume should spike at least 20% above the consolidation average, signaling that a meaningful number of participants are committing to the new direction. Breakouts without volume expansion have a false breakout rate roughly 25 percentage points higher than volume-confirmed ones. On forex pairs where only tick volume is available, the same pattern applies — look for a noticeable tick volume spike on the breakout bar.
Top Brokers
About the Author
Daniel Harrington
Senior Trading Analyst
Daniel Harrington is a Senior Trading Analyst with a MScF (Master of Science in Finance) specializing in quantitative asset and risk management. With over 12 years of experience in forex and derivatives markets, he covers MT5 platform optimization, algorithmic trading strategies, and practical insights for retail traders.
Use This Indicator
Risk Disclaimer
Trading financial instruments carries significant risk and may not be suitable for all investors. Past performance does not guarantee future results. This content is for educational purposes only and should not be considered investment advice. Always conduct your own research before trading.