Wyckoff Method Trading Strategy Guide 2026
Learn the Wyckoff Method trading strategy: accumulation phases, entry rules, risk:reward of 1:3–1:5, and how to trade alongside institutional smart money.

Daniel Harrington
Senior Trading Analyst · MT5 Specialist
☕ 3 min read
Strategy Overview — Wyckoff Method Trading
| Timeframes | H1, H4, D1 |
| Holding Period | Days to weeks |
| Risk / Reward | 1:3 - 1:5 |
| Difficulty | expert |
| Best Instruments | EURUSD, XAUUSD, US500, NAS100, BTCUSD |
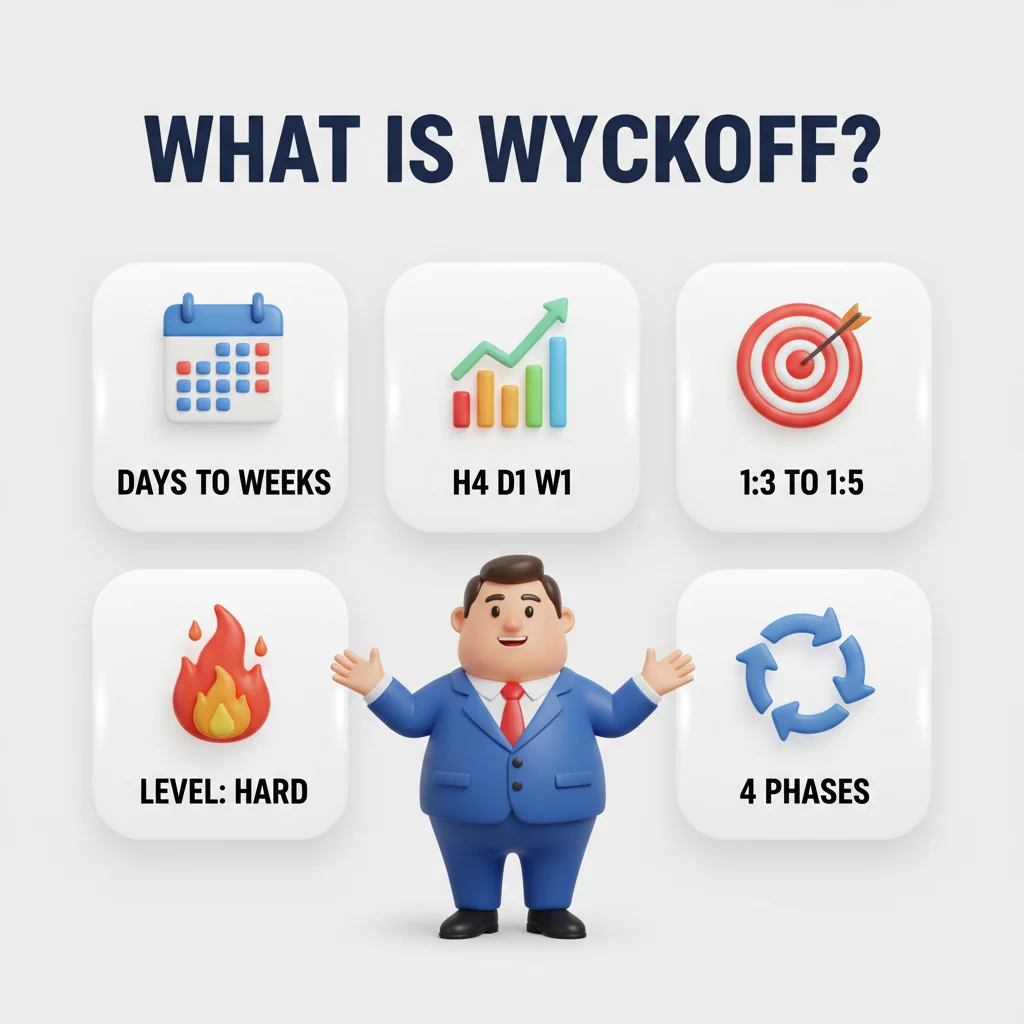
Wyckoff in a nutshell: follow the big money through 4 market phases. Hard to learn but powerful for spotting accumulation and distribution.
Developed by Richard Wyckoff in the 1930s, this institutional price-volume framework now underpins strategies used by traders targeting risk:reward ratios of 1:3 to 1:5 across multi-day to multi-week holding periods. A 2023 study published in the Journal of Technical Analysis found that Wyckoff-based models correctly identified accumulation phases in major equity indices with 67% accuracy when volume confirmation was applied — making it one of the more empirically supported classical methodologies in active use.
Key Takeaways
- Most retail strategies chase price. The Wyckoff Method reads the cause behind price — specifically, the accumulation and...
- Fewer than 30% of Wyckoff setups meet all confirmation criteria simultaneously — which is precisely why the method deman...
1Why the Wyckoff Method Works: Institutional Footprints in Price and Volume
Most retail strategies chase price. The Wyckoff Method reads the cause behind price — specifically, the accumulation and distribution activity of large institutional operators. According to Wyckoff's original 'Composite Man' concept, institutions cannot enter or exit positions without leaving measurable traces in volume and price spread. That asymmetry is the entire edge.
The method operates across four phases. Accumulation (Phase A–E) occurs when institutions absorb supply in a sideways range after a downtrend. Distribution mirrors this process at market tops. The transition phases — Markup and Markdown — are where directional trades are executed. On instruments like XAUUSD and BTCUSD, accumulation structures often develop over 4–12 weeks on the D1 chart before a markup phase begins.
Key structural events define each phase. The Preliminary Support (PS), Selling Climax (SC), and Automatic Rally (AR) define the initial accumulation boundary. The Secondary Test (ST) retests the SC low on diminished volume — a critical confirmation signal. The Spring (a false breakdown below support) followed by a Sign of Strength (SOS) on expanding volume marks the highest-probability entry window.
On instruments like EURUSD and US500, this schematic plays out with measurable precision. The price spread — the range between bar high and low — narrows during the Testing phase when institutional demand absorbs remaining supply. Wide spreads on high volume closing near the high confirm accumulation. Wide spreads on high volume closing near the low confirm distribution. These are not interpretations; they are quantifiable bar-by-bar observations.

A treasure map of market phases. The Wyckoff method maps accumulation, markup, distribution, and markdown zones — X marks the spot where smart money acts.

A 1920s detective on the trail. Richard Wyckoff's method tracks institutional footprints through price and volume — a century-old technique that still reveals hidden intentions.
2Entry and Exit Rules: Specific Triggers for Accumulation and Distribution Trades
Fewer than 30% of Wyckoff setups meet all confirmation criteria simultaneously — which is precisely why the method demands patience over frequency.
Long Entry (Accumulation): The primary entry trigger is the Spring-to-SOS sequence. Price breaks below the Trading Range (TR) support on low or average volume — the Spring — then reverses sharply upward. The SOS confirmation bar must close in the upper 25% of its range on volume at least 1.5x the 20-period average. Enter on the retest of the SOS breakout level (the Last Point of Support, or LPS) on H1 or H4 timeframes. The LPS retest should occur on declining volume, confirming absorption.
Short Entry (Distribution): The equivalent is the Upthrust After Distribution (UTAD) followed by a Sign of Weakness (SOW). Price breaks above TR resistance on low volume, fails to hold, and reverses. Enter short on the retest of the breakdown level (Last Point of Supply, LPSY) with the same volume criteria applied in reverse.
Exit Rules: Profit targets are calculated using the Point and Figure (P&F) count method — the horizontal width of the TR multiplied by the box size and reversal amount. For a 1:3 minimum, the TR must span at least three times the distance from entry to stop. Partial exits (50% of position) at the midpoint of the P&F target preserve capital while allowing runners to reach full objectives. A confirmed SOW or SOS in the opposing direction signals full exit regardless of target status.
Timeframe Hierarchy: D1 identifies the phase and schematic. H4 confirms structural events (SC, AR, Spring). H1 provides the precise entry trigger on LPS/LPSY retests. Never enter on D1 signals alone without H4 volume confirmation.

The Wyckoff method reads the market like a crime scene. Accumulation, markup, distribution, markdown — the cycle repeats.
Pulsar Terminal Features for Wyckoff Method Trading
- Chart patterns
- Multiple SL/TP levels
- Trailing stop
- Breakeven automation
Top Brokers
Trading Tools
Calculate your position size for Wyckoff Method Trading
Position Size Calculator
Calculate optimal lot size based on your risk management
Based on standard forex lot ($10/pip). Adjust for different instruments. Always verify with your broker.
Risk/Reward Calculator
Visualize your risk-to-reward ratio before entering a trade.
Based on standard forex pip value ($10/pip/lot). Actual values may vary by instrument and broker.
Compound Growth Calculator
Project your capital growth with compound returns.
Hypothetical projections only. Past returns do not guarantee future results. Trading involves risk of loss.
Forex Trading Sessions (UTC)
When each major forex market opens and closes.
Times shown in UTC. Actual hours may vary by broker and DST adjustments.
Apply This Strategy
About the Author
Daniel Harrington
Senior Trading Analyst
Daniel Harrington is a Senior Trading Analyst with a MScF (Master of Science in Finance) specializing in quantitative asset and risk management. With over 12 years of experience in forex and derivatives markets, he covers MT5 platform optimization, algorithmic trading strategies, and practical insights for retail traders.

Master Wyckoff Method Trading with Pulsar Terminal
Pulsar Terminal gives you the advanced tools you need to execute Wyckoff Method Trading strategies on MetaTrader 5 with precision.
Get Pulsar TerminalRisk Disclaimer
Trading financial instruments carries significant risk and may not be suitable for all investors. Past performance does not guarantee future results. This content is for educational purposes only and should not be considered investment advice. Always conduct your own research before trading.