Average Day Range (ADR) Indicator: Daily Pip Range for Target Setting & Session Trading
ADR calculates the average daily high-low range over a period, helping traders set realistic profit targets and stop-losses based on typical daily price movement.

Daniel Harrington
Senior Trading Analyst · MT5 Specialist
☕ 17 min read
Settings — ADR
| Category | volatility |
| Default Period | 14 |
| Best Timeframes | M15, H1, H4 |
Here is a question that will save you money the moment you can answer it: how many pips does this pair actually move in a day? Not how many you hope it moves. Not how many it moved that one glorious Tuesday in 2020. How many pips does it move on a normal, boring, nothing-special day? The Average Day Range indicator hands you that number. It takes the high-to-low range of each daily candle, averages it over a lookback period (typically 14 days), and gives you a single value in pips. No normalization, no oscillation between 0 and 100, no overbought or oversold zones. Just a clean answer: this pair moves about X pips per day. That number becomes your daily budget for expectations. Once you internalize it, you stop chasing 150-pip targets on EUR/USD when the pair averages 75, and you stop panicking over a 40-pip drawdown on GBP/JPY when it routinely swings 130. Simple concept, massive impact on your trading decisions.
Key Takeaways
- The Average Day Range calculation could not be simpler. Take the high of a daily candle, subtract the low, and you have ...
- Not all currency pairs are built the same. GBP/JPY can cover 130 pips before lunch while EUR/CHF takes a full week to mo...
- The single most common mistake among day traders is setting profit targets that require the market to do more than it us...
1ADR in Plain English: How Many Pips Does This Pair Move Per Day?
The Average Day Range calculation could not be simpler. Take the high of a daily candle, subtract the low, and you have that day's range. Do this for the last N days (the default is 14), add them up, divide by N. Done. You now have the ADR value in pips.
ADR = Sum(Daily High - Daily Low, N periods) / N
That is literally the entire formula. If you were expecting exponential smoothing or weighted coefficients, the ADR will underwhelm you. And that is exactly its strength.
Let us walk through a quick example. Suppose EUR/USD posted these daily ranges over the last five days: 72 pips, 65 pips, 88 pips, 54 pips, 81 pips. The 5-period ADR would be (72 + 65 + 88 + 54 + 81) / 5 = 72 pips. That tells you the pair has been moving roughly 72 pips from daily low to daily high. Not from open to close — from the absolute bottom to the absolute top of each day's candle, including wicks.
This distinction matters more than traders realize. A day where EUR/USD opens at 1.0900, drops to 1.0860, rallies to 1.0940, and closes at 1.0910 had a range of 80 pips even though the close was only 10 pips above the open. The ADR captures that full 80-pip swing. Your opportunity to profit existed within those 80 pips, not within the 10-pip open-to-close move.
The default 14-period lookback strikes a balance between responsiveness and stability. A 5-period ADR reacts quickly to recent volatility changes — useful during event-driven weeks like NFP or central bank meetings — but can whipsaw between readings. A 20-period ADR gives a smoother, more stable baseline that is less affected by a single abnormal day. Most traders find the 14-period default suitable for everyday use and only switch to 5-period around known high-impact events when they want an updated read on recent market energy.
One thing the ADR does not tell you is direction. An ADR of 90 pips on GBP/USD means the pair travels 90 pips from extreme to extreme — but it says nothing about whether that movement is bullish or bearish. This is not a flaw. The ADR is a volatility ruler, not a trend compass. You combine it with directional tools (trendlines, moving averages, price action) to decide which way to trade, and then use the ADR to set realistic distance targets.
The indicator is not built into MetaTrader 5 by default, but dozens of free custom versions exist on MQL5 forums, Forex Factory, and TradingView. Most of them plot the ADR value as a number on your chart along with horizontal lines showing the projected high and low for the current day. Those projected levels are calculated by adding the ADR value above the current day's low and subtracting it below the current day's high, giving you a visual box where price is statistically likely to stay.
When you see the ADR value on your chart every morning, it resets your expectations before you place a single trade. A quiet pair with a 45-pip ADR tells you a 30-pip target is perfectly reasonable — you are asking for two-thirds of the typical range. But aiming for 80 pips on that same pair means you need price to exceed its normal daily range by nearly double. Possible? Sure. Probable? No. And probability is what keeps a trading account alive.
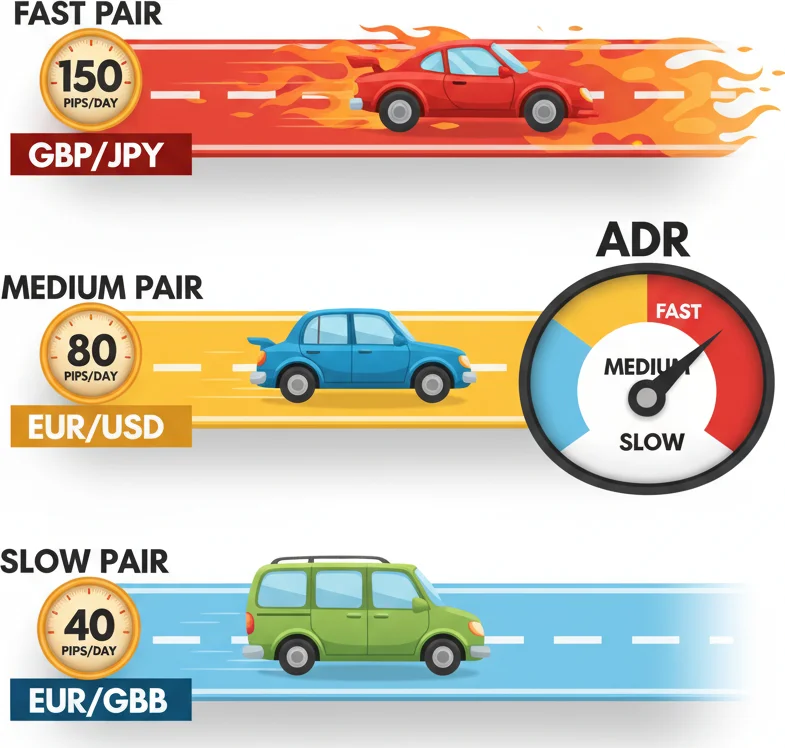
ADR tells you the daily mileage of a currency pair — some pairs are sports cars, others are minivans.
2ADR by Major Pair: Your Daily Pip Budget Cheat Sheet
Not all currency pairs are built the same. GBP/JPY can cover 130 pips before lunch while EUR/CHF takes a full week to move that far. Knowing the typical ADR for the pairs you trade is like knowing the speed limit on the highway you drive — it keeps you from setting unrealistic expectations or getting unnecessarily nervous.
Here are typical ADR values for major and popular pairs. These are approximate ranges based on normal market conditions and will shift during high-volatility periods, central bank decisions, and risk events. Think of them as ballpark figures for your daily planning.
| Pair | Typical ADR (pips) | Personality |
|---|---|---|
| EUR/USD | 60-85 | The steady workhorse. Moderate range, high liquidity, tight spreads |
| GBP/USD | 80-120 | Wider swings than EUR/USD, especially around London session |
| USD/JPY | 55-80 | Tends to be calmer unless BOJ surprises or risk sentiment shifts hard |
| USD/CHF | 50-75 | Often mirrors EUR/USD inversely, moderate range |
| AUD/USD | 55-80 | Sensitive to commodity prices and Asian session data |
| NZD/USD | 55-75 | Slightly narrower than AUD/USD, similar drivers |
| USD/CAD | 60-85 | Oil correlation adds occasional spikes |
| EUR/GBP | 35-55 | One of the tightest major cross pairs, moves slowly |
| GBP/JPY | 110-160 | The beast. Massive daily ranges, not for the faint-hearted |
| EUR/JPY | 75-110 | Solid range, popular for carry-related setups |
A few observations jump out immediately.
First, the yen crosses (GBP/JPY, EUR/JPY) run dramatically wider ADRs than the dollar majors. This is partly because yen pairs are quoted with two decimal places instead of five, so a "pip" represents a larger price increment. But even accounting for that, GBP/JPY genuinely moves more in absolute terms. If you are used to trading EUR/USD and switch to GBP/JPY without adjusting your position size and targets, you will either get stopped out by normal noise or set targets that are too conservative for the pair's personality.
Second, EUR/GBP sits at the quiet end of the spectrum. Traders who love fast action will find it painfully slow. But for traders who want to hold positions for days with tight stops relative to the target, the narrow ADR makes EUR/GBP surprisingly manageable — you can set a 25-pip stop on a 50-pip target and still be within normal daily range expectations.
Third, these values are not static. ADR expands during periods of elevated uncertainty (think elections, banking crises, pandemic-era volatility) and contracts during holiday weeks and summer doldrums. The ADR itself will track these changes automatically over your chosen lookback period. That is why looking at the indicator every morning is useful — it tells you whether the market is currently running hot, cold, or normal compared to its own recent baseline.
How to use these numbers practically
Suppose you are a day trader who aims for a 1:2 risk-reward ratio. You trade EUR/USD with a 30-pip stop and a 60-pip target. On a normal day with an ADR of 75, your target asks for 80% of the daily range. That is achievable but demanding — you need to catch most of the day's move in one direction. A 45-pip target (60% of ADR) would be more forgiving and still gives you a 1:1.5 ratio.
Now switch to GBP/JPY with its 140-pip ADR. The same 1:2 ratio with a 40-pip stop gives you an 80-pip target — only 57% of the daily range. Suddenly your target is comfortable within the pair's normal movement. This is why many intraday traders prefer higher-ADR pairs: they provide more room for meaningful reward-to-risk ratios without requiring you to catch the entire day's move.
The ADR cheat sheet is not a trading strategy. It is a reality filter. Before every trade, ask yourself: does my target require this pair to do something normal or something exceptional today? If the answer is exceptional, you either need a very strong reason to believe today is different, or you need to reduce your target.
Your daily pip budget cheat sheet printing right here - know before you trade!
“The single most common mistake among day traders is setting profit targets that require the market to do more than it usually does.”
3Using ADR for Take Profit Targets: Don't Expect More Than the Market Gives
The single most common mistake among day traders is setting profit targets that require the market to do more than it usually does. A trader sees a textbook setup on EUR/USD, enters long, and slaps a 120-pip take profit because "the chart says it should go there." The chart might be right on a weekly basis, but the daily range is 75 pips. Expecting 120 pips in a single session is like expecting to drive 200 km/h on a road with an 80 km/h speed limit. Technically possible, statistically unlikely, and probably going to end badly.
The ADR gives you a framework for setting targets that the market can realistically deliver within your trading timeframe.
The percentage rule
A useful guideline is to set your take profit at 40-70% of the ADR. This range accounts for the fact that you almost never enter at the exact low and exit at the exact high. Even a perfectly timed entry happens some distance from the daily extreme, and your exit will likely leave some meat on the bone. Asking for 40-70% of the typical daily range is ambitious but achievable for a well-timed intraday trade.
| ADR Capture | Difficulty | Realistic For |
|---|---|---|
| 20-40% of ADR | Comfortable | Most traders, most days |
| 40-60% of ADR | Ambitious but achievable | Skilled intraday traders with good timing |
| 60-80% of ADR | Requires excellent entry and timing | Only with strong directional conviction |
| 80-100% of ADR | Near-perfect low-to-high capture | Rare — do not plan for this regularly |
| 100%+ of ADR | Exceptional day or multi-session hold | Only during major moves |
Let us work through a real scenario. You trade GBP/USD on the H1 chart and the current ADR reads 105 pips. You spot a bullish pin bar at a support level during the early London session and enter long with a 30-pip stop. Where should your take profit go?
At 50% of ADR, your target is roughly 52 pips — a 1:1.7 reward-to-risk ratio. At 65% of ADR, it is about 68 pips — a 1:2.3 ratio. Both are reasonable. The 68-pip target is more ambitious but still within the range of what GBP/USD regularly delivers in a single session. Setting a target at 100 pips (95% of ADR) would require you to catch nearly the entire day's range, which demands perfect entry timing and a strong trending day.
ADR-based trailing
Some traders use the ADR as a trailing tool rather than a fixed target. The logic: enter the trade, set an initial target at 40% of ADR, and if price reaches that target during a clearly trending day, trail your stop to breakeven and let the position run toward 60-70% of ADR. This hybrid approach captures the easy middle portion of the daily range while leaving room for bonus profit on strong days.
The news day exception
On days with high-impact news (NFP, FOMC, ECB rate decisions), the actual daily range often exceeds the ADR by 30-60%. This does not mean you should set wider targets on news days — the extra volatility cuts both ways. Your stop is equally likely to get hit before your target. What it does mean is that after a major news candle has already consumed 80% of the ADR, there may still be room for follow-through. Use the ADR as a starting expectation, not a ceiling.
The multi-day target adjustment
If you are a swing trader holding positions for two to five days, ADR still helps. A pair with a 70-pip daily range has the potential to move 140-200 pips over two to three days in a directional trend (not 210 pips — some overlap occurs as price retraces intraday). Your multi-day target can reasonably be 1.5 to 2.5 times the ADR. Going beyond 3x ADR for a swing trade implies you are expecting an extended trend move, which requires additional confluence beyond just support-resistance levels.
What happens when you ignore ADR
You set a 150-pip target on EUR/USD (ADR 72). Price moves 60 pips in your favor over two days — a beautiful 83% ADR capture per day — and then consolidates. Your target is still 90 pips away. Price pulls back 30 pips. You are still in profit but frustrated. It consolidates again. Eventually you either close manually at a worse price than if you had set a 60-pip target, or it reverses entirely and you break even or lose. The market gave you what it normally gives — you just asked for twice as much. The ADR would have told you, before the trade, that your target was unrealistic for this pair on this timeframe.
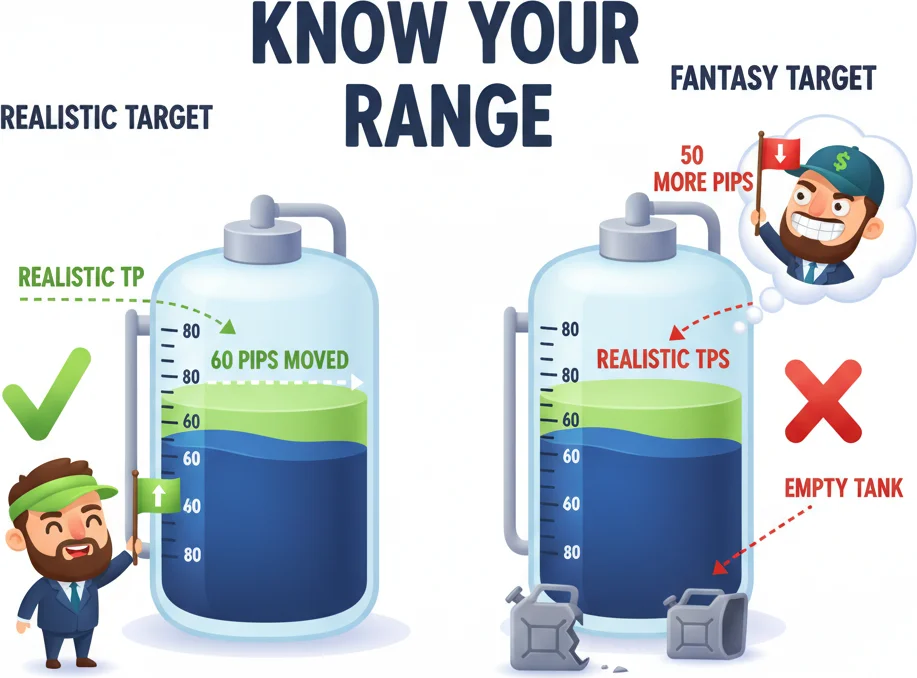
If a pair moves 80 pips a day and it already moved 70, expecting another 50 is pure fantasy.
4ADR and Session Trading: When 80% of the Range Has Already Happened
Here is where the ADR goes from "useful reference" to "active trading filter." The idea is based on a statistical reality: once a currency pair has consumed a large portion of its average daily range, the probability of significant further extension drops sharply. Empirical observations suggest that price stays within its ADR boundaries roughly 80% of trading days. It exceeds 125% of ADR only about 23% of the time, and blows past 200% of ADR less than 3% of the time.
These are not guarantees, but they are powerful probabilities that you can build rules around.
The ADR exhaustion framework
At the start of each trading day, the ADR indicator resets. It takes the current day's developing high and low and compares the current range to the ADR value. Most custom indicators display this as a percentage — "ADR used: 45%" means the pair has already traveled 45% of its typical daily range.
Here is the decision framework many intraday traders use:
| ADR Used | Implication | Suggested Action |
|---|---|---|
| 0-30% | Early in the day, range is wide open | Best time for new directional trades |
| 30-60% | Moderate consumption, room remains | Trades still viable, tighten targets |
| 60-80% | Most of the day's range is consumed | Be selective, reduce position size |
| 80-100% | Near full range exhaustion | Avoid new entries, consider mean-reversion |
| 100%+ | Exceeding typical range | Exceptional conditions — only news-driven |
The practical application changes depending on which session you trade.
Asian session (Tokyo)
Most major pairs consume only 15-30% of their ADR during the Asian session, with USD/JPY and AUD/USD being exceptions. If you trade the London open, the ADR tells you that 70-85% of the daily range is still available for the European and American sessions. This is why London breakout strategies work — they capitalize on the remaining range after Asia's narrow contribution.
London session
The London session typically captures 50-70% of the daily range for EUR and GBP pairs. This is when the majority of the ADR gets consumed. If you are trading at the London open and the pair has only used 20% of its ADR during Asia, you have a statistical tailwind — there is room to move. Enter directional trades confidently during the first two hours of London when ADR usage is still below 40%.
New York session
Here is where the ADR filter becomes critical. If London has already consumed 65-75% of the ADR by the time New York opens, you are late to the party. Initiating a fresh breakout trade when 75% of the range is used up means you are betting on the remaining 25% — and against the statistical tendency for price to slow down. This does not mean you cannot trade New York, but your approach should shift from breakout entries to mean-reversion setups or tight-range scalps.
The London-New York overlap
The overlap (roughly 13:00 to 17:00 UTC) is where most traders make their ADR-based mistakes. Volatility picks up because both markets are active, and traders see fresh momentum forming. But if the ADR is already 80% consumed, that fresh momentum is more likely to be a fake breakout that quickly reverses back into the range than a genuine extension. Experienced traders use the 80% threshold as a hard filter: if ADR is more than 80% consumed, they stop initiating new trend-following positions and switch to looking for reversals near the ADR extremes.
Building ADR levels on your chart
Most ADR indicators project two horizontal lines on your intraday chart:
- Upper ADR level: Current day's low + ADR value
- Lower ADR level: Current day's high - ADR value
These lines update as the day progresses because the daily high and low are constantly being redefined. Early in the Asian session, the projected range is narrow because the day's high and low are close together. By mid-London, the levels stabilize as the day's extremes become established.
When price approaches an ADR level and shows rejection — a wick, a bearish engulfing candle, a stall in momentum — that is a high-probability mean-reversion signal. The market is telling you it has used its daily fuel allocation and is unlikely to push much further. Combine that rejection with the 80% exhaustion reading and you have a setup that works precisely because most traders are still trying to chase breakouts.
The exception: trend days
Roughly one in five trading days is a genuine trend day where price moves directionally from open to close with minimal retracement. On these days, the ADR gets exceeded early and price keeps going. You cannot predict trend days with certainty, but you can identify them as they develop — price exceeds 100% of ADR before the New York session even starts, and there is a clear fundamental catalyst. On these days, abandon the mean-reversion playbook and trail your stop below structure. The ADR is a probability tool, not a law of physics.

When 80% of the range is done, patience beats FOMO every time.
“The Average Day Range and the Average True Range sit next to each other in every indicator list, their names differ by one word, and traders constantly confuse them or assume they are interchangeable.”
5ADR vs ATR: Similar Names, Important Differences
The Average Day Range and the Average True Range sit next to each other in every indicator list, their names differ by one word, and traders constantly confuse them or assume they are interchangeable. They are not. The difference is technical, but it has practical consequences for how you use each one.
What ATR does differently
The Average True Range, developed by J. Welles Wilder in 1978, calculates what he called the "True Range" for each period. True Range is the greatest of three values:
- Current high minus current low (the normal daily range)
- Current high minus previous close
- Previous close minus current low
The second and third calculations capture price gaps — situations where the current bar opens significantly above or below the previous close. ATR then averages these True Range values over N periods, typically 14.
The ADR only uses calculation number one: high minus low. It completely ignores the previous close. No gap adjustment, no true range concept. Just the raw intraday spread.
When the difference matters
In forex, the practical difference between ADR and ATR is often small because currency pairs rarely gap during the trading week. The market trades 24 hours, Monday to Friday, so the previous close and the current open are usually identical or within a pip or two. In this context, the True Range equals the regular range on most days, and ADR and ATR produce nearly identical readings.
But there are exceptions:
- Weekend gaps. Every Monday open can produce gaps in forex, especially if news breaks over the weekend. ATR captures these gaps; ADR does not.
- Stock indices and commodities. If you trade DAX, S&P 500, or gold futures, significant overnight gaps are common. ATR will consistently read higher than ADR on these instruments because it includes the gap distance.
- Crypto. Despite trading 24/7, crypto platforms sometimes have maintenance windows or liquidity gaps that create discontinuities. ATR handles these; ADR does not.
| Feature | ADR | ATR |
|---|---|---|
| Formula | High - Low, averaged | True Range (includes gaps), averaged |
| Gap handling | Ignores gaps | Includes gaps |
| Best for | Intraday range estimation | Overall volatility measurement |
| Forex accuracy | Very accurate (few gaps) | Slightly higher on Mondays |
| Stocks/indices accuracy | Understates volatility | More accurate |
| Typical use | Setting daily TP/SL targets | Position sizing, trailing stops |
| Built into MT5 | No (custom indicator) | Yes (native) |
| Created by | Community-developed | J. Welles Wilder (1978) |
Which one should you use?
The answer depends on what question you are asking.
If the question is "how many pips will this pair likely move today from its intraday low to its intraday high?" — use ADR. It directly answers that question without contamination from gap data that is irrelevant to your intraday trading plan.
If the question is "what is the overall volatility of this instrument including all possible price movement?" — use ATR. It gives a more complete picture of risk exposure, which is why ATR is the standard tool for position sizing and trailing stop calculations.
For forex day traders, ADR is usually the better choice because the market's 24-hour nature means gaps rarely distort the picture. For swing traders holding through weekends, or traders working with stocks and indices where gaps are a daily reality, ATR provides more accurate risk assessment.
A common mistake: using ATR for intraday targets on stocks
Imagine a stock that closed at 50 dollars yesterday, gapped up to 52 dollars at the open, traded between 52 and 55 dollars all day, and closed at 54 dollars. The daily range (ADR-style) was 3 dollars (55 minus 52). The True Range was 5 dollars (55 minus yesterday's close of 50). If you set your intraday take profit at 70% of ATR (3.5 dollars), you are aiming for more than the stock's entire intraday range because ATR is inflated by the gap. Using ADR instead, 70% of 3 dollars is 2.1 dollars — a realistic intraday target. This gap inflation is the number one reason day traders on stocks should prefer ADR over ATR for target setting.
Can you use both?
Absolutely. A practical dual setup: use ADR to set your intraday take profit levels, and use ATR to determine your position size (since ATR captures total risk including gaps). This way your targets match what the market actually delivers intraday, while your risk management accounts for the worst-case overnight move. It is one of those rare cases where using two similar indicators together is not redundant — they are answering genuinely different questions.
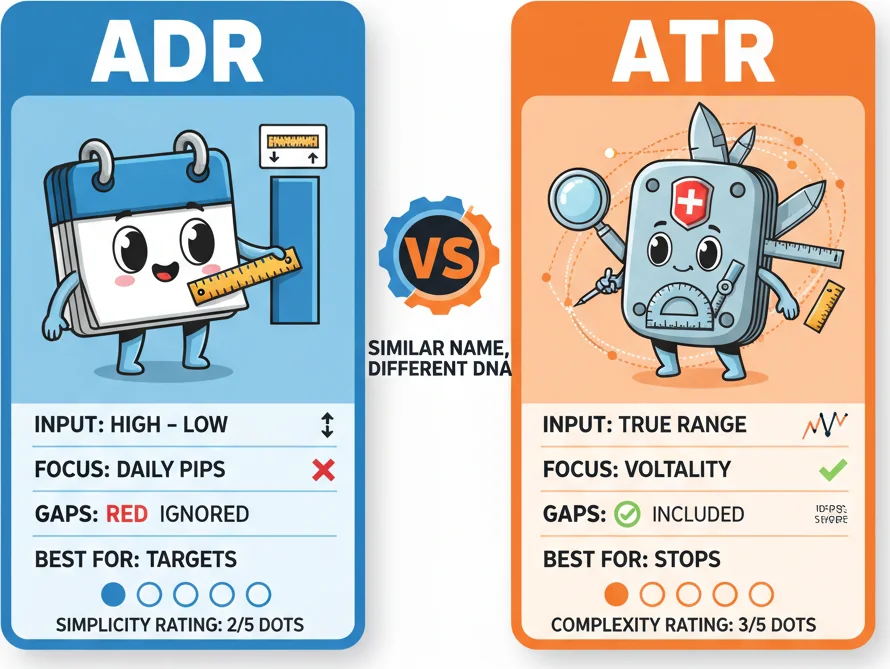
ADR counts daily highs and lows. ATR factors in gaps and uses true range. Similar names, different DNA.
Frequently Asked Questions
Q1What is the Average Day Range (ADR) indicator?
The Average Day Range is a volatility indicator that measures the average number of pips a currency pair moves from its daily high to its daily low over a specified lookback period, typically 14 days. The formula is simple: subtract the daily low from the daily high for each day, then average those values. The result tells you how much intraday movement to expect on a normal trading day. It does not indicate direction — only the size of the daily range.
Q2What is a good ADR lookback period for forex trading?
The standard default is 14 days, which balances responsiveness with stability. A 5-day ADR reacts quickly to recent volatility shifts and is useful during event-heavy weeks like NFP or central bank decisions. A 20-day ADR provides a smoother baseline less influenced by single abnormal days. Most intraday traders stick with 14 for everyday use and may temporarily switch to 5 around known high-impact events to get an updated read on current market energy.
Q3How do I use ADR to set take profit targets?
Set your intraday take profit at 40-70% of the current ADR value. Since you rarely enter at the exact daily low and exit at the exact daily high, asking for 40-70% of the typical range is ambitious but achievable. For example, if EUR/USD has an ADR of 75 pips, a target of 30-52 pips is realistic for a single intraday trade. Targets above 80% of ADR require near-perfect timing and a strongly trending day, which only occurs roughly 20% of the time.
Q4What does it mean when ADR is 80% exhausted?
When the current day's range (high minus low so far) has reached 80% of the ADR value, the pair has consumed most of its typical daily movement. Statistically, price stays within its ADR boundaries about 80% of trading days. Once 80% is used up, the probability of significant further extension drops. Many intraday traders stop initiating new trend-following positions at this point and either stand aside or look for mean-reversion setups near the ADR extremes.
Q5Is ADR or ATR better for forex day trading?
For forex day trading, ADR is generally the better choice for setting intraday targets. Since forex trades 24 hours with very few gaps, ADR and ATR produce nearly identical readings during the week. However, ADR directly answers the question day traders care about: how many pips will this pair move from low to high today? ATR includes gap data from its True Range calculation, which can slightly inflate readings on Mondays or around weekend events. ATR remains the better tool for position sizing and overnight risk management because it captures total volatility including gaps.
Top Brokers
About the Author
Daniel Harrington
Senior Trading Analyst
Daniel Harrington is a Senior Trading Analyst with a MScF (Master of Science in Finance) specializing in quantitative asset and risk management. With over 12 years of experience in forex and derivatives markets, he covers MT5 platform optimization, algorithmic trading strategies, and practical insights for retail traders.
Use This Indicator
Risk Disclaimer
Trading financial instruments carries significant risk and may not be suitable for all investors. Past performance does not guarantee future results. This content is for educational purposes only and should not be considered investment advice. Always conduct your own research before trading.