Awesome Oscillator (AO) Guide: Bill Williams' Momentum Histogram Explained
Awesome Oscillator measures market momentum by comparing a 5-period and 34-period simple moving average of the median price.

Daniel Harrington
Senior Trading Analyst · MT5 Specialist
☕ 17 min read
Settings — AO
| Category | oscillator |
| Default Period | null |
| Best Timeframes | H1, H4, D1 |
Bill Williams did not do humble indicator names. He called this one the Awesome Oscillator, and while the marketing was bold, the tool itself earned the swagger. The AO is a momentum histogram that compares what price has done recently against what it has done over a broader window — and it does this using the midpoint of each bar rather than the close, which gives it a slightly different personality than indicators like MACD. Williams introduced the AO as part of his Trading Chaos methodology in the 1990s, alongside the Alligator, Fractals, and Accelerator Oscillator. Together they formed a complete system, but the AO stands on its own as a clean, readable momentum gauge that works across forex, indices, and commodities on MT5.
Key Takeaways
- To understand the AO, you first need to understand the man behind it. Bill Williams (1932-2019) was not your typical qua...
- The AO histogram looks simple — green bars, red bars, a zero line — but most traders misread it in their first weeks. Th...
- If you only learn one AO pattern, make it the Saucer. This is the continuation signal — it catches moments when a trend ...
1Bill Williams' Philosophy: Why He Called It 'Awesome'
To understand the AO, you first need to understand the man behind it. Bill Williams (1932-2019) was not your typical quant. He held a PhD in psychology, traded for over 50 years, and built his entire technical framework around chaos theory — the idea that markets are nonlinear systems where small changes in momentum can trigger large directional moves. His book Trading Chaos, published in 1995, laid out a complete trading methodology that rejected the idea of predicting price and instead focused on reacting to momentum shifts as they happened. A follow-up, New Trading Dimensions (1998), refined the system and cemented his reputation among retail traders worldwide.
Williams drew his philosophical core from chaos theory in physics and mathematics: complex systems, despite their apparent disorder, follow hidden and repetitive patterns. He argued that price movements are not random but are driven by identifiable behavioral patterns, and that traders should focus less on predicting markets and more on understanding their structure. Markets unfold in phases, and traders must align themselves with the natural flow rather than fighting it.
The Awesome Oscillator was the centerpiece of that system. Williams called it 'awesome' because he believed it captured the single most important thing a trader needs to know: whether the immediate driving force behind the market is gaining or losing strength. Not where price is going — but whether the energy pushing it is increasing or fading.
The formula is deliberately simple:
AO = SMA(Median Price, 5) - SMA(Median Price, 34)
Median price is (High + Low) / 2. That is important. Williams specifically chose the midpoint of each candle rather than the close because he believed the midpoint represented the true consensus of buyers and sellers during that period. As he explained it, the median price lets you capture the full volatility that occurred during a bar — something a close-only calculation completely misses. A candle can close near its open and look neutral while its high and low tell a wildly different story of aggressive buying absorbed by sellers. The midpoint captures this struggle.
The 5-period SMA captures what momentum is doing right now. The 34-period SMA captures the broader baseline. When the fast average sits above the slow average, the AO is positive — recent momentum is stronger than the norm. When it sits below, momentum is weakening relative to the longer-term rhythm.
Why 5 and 34? Both are Fibonacci numbers, and Williams was clearly influenced by the Fibonacci sequence, though he never explicitly tied the AO to Fibonacci theory. The practical effect is that these periods create a responsive but not jittery oscillator. The 5-period window reacts within a few candles. The 34-period window spans enough history to establish what normal momentum looks like for the current market cycle.
Compared to MACD — which uses exponential moving averages of closing prices — the AO's use of simple moving averages on median price makes it less twitchy. A single dramatic closing candle can whip MACD's histogram around; the AO absorbs that noise better because it weighs each bar equally and measures from the midpoint. This smoothing was intentional. Williams designed the AO for traders who want to see genuine momentum shifts rather than react to every candle's closing drama.
The AO plots as a histogram centered on a zero line. Bars above zero mean the fast average is above the slow average. Bars below zero mean the opposite. Each bar is colored green if it is higher than the previous bar, red if it is lower. This color coding is not about whether the AO is positive or negative — it is about the direction of change. You can have a red bar above zero (momentum is still positive but declining) or a green bar below zero (momentum is still negative but recovering). That distinction is the foundation of every AO signal.

Bill Williams was not humble about naming his indicator — he genuinely believed it cracked the code of momentum.
2Green and Red Bars: Reading the AO Histogram
The AO histogram looks simple — green bars, red bars, a zero line — but most traders misread it in their first weeks. The color does not tell you whether to buy or sell. The color tells you whether momentum is accelerating or decelerating, which is a different question entirely. Getting this wrong is like checking the speedometer but ignoring whether you are pressing the gas or the brake.
Let's break down what you are actually looking at on your MT5 chart.
Above Zero, Green Bars — Bullish momentum is present and getting stronger. The fast 5-period average is above the slow 34-period average, and the gap between them is widening. This is the strongest bullish reading: trend is up and accelerating.
Above Zero, Red Bars — Bullish momentum is still present (fast average is still above slow), but the gap is narrowing. The trend is up but losing steam. This is not a sell signal by itself — it is an early warning. Many traders exit prematurely when they see red bars above zero, only to watch price continue higher after a brief pause.
Below Zero, Red Bars — Bearish momentum is present and intensifying. The fast average is below the slow average and pulling further away. Shorts are in control and pressing their advantage.
Below Zero, Green Bars — Bearish momentum is still present, but it is weakening. The fast average is still below the slow average, but the gap is shrinking. Again, not a buy signal on its own — but the bears are losing energy.
The Zero Line Cross — When the histogram crosses from negative to positive territory, it signals that the 5-period momentum average has overtaken the 34-period baseline. This is the most straightforward AO signal: a shift from bearish to bullish momentum (or vice versa for a downward cross). It is also the most lagging of the three main signals — by the time the cross happens, the initial momentum shift has already been underway for a few bars. That lag is the tradeoff for reliability: zero-line crosses confirm that a real shift has occurred rather than just a momentary wobble.
Zero-line crosses on H4 tend to be more reliable than on M15, where they occur frequently enough to generate noise. On H1, they sit in a middle ground — useful with confirmation, risky as standalone triggers. One study using backtested data on major forex pairs found that out of four zero-line crossover signals on higher timeframes, only one was false — a much better ratio than many oscillator crossover strategies produce.
A practical way to think about the histogram: imagine a tug-of-war rope. The zero line is the center marker. Green bars mean your team is pulling the rope in your direction. Red bars mean the other team is pulling back. The position above or below zero tells you which side is currently winning. The color tells you which side is gaining ground right now.
One common mistake is treating every color change as an action signal. On H1, the AO can alternate between green and red bars five or six times during a choppy session without producing any meaningful directional move. The skilled AO trader waits for specific bar patterns — the Saucer and Twin Peaks — rather than reacting to every color flip. Raw color changes are data. Patterns are signals.
Another subtlety worth noting: the height of the bars matters. Tall bars above zero indicate strong bullish momentum. Short bars just barely above zero suggest the bullish edge is marginal. When bars shrink progressively toward zero, they are telling you that the two moving averages are converging — a potential crossover is approaching. Watch for this shrinking pattern as an early heads-up that a zero-line cross may be imminent.
On MT5, the AO is found in the Navigator panel under Indicators > Bill Williams > Awesome Oscillator. The default settings (5 and 34) do not need adjustment — Williams designed them as fixed parameters, and changing them defeats the purpose of the indicator's specific rhythm. Unlike RSI or Stochastic where period-tuning is standard practice, the AO is a fixed-parameter tool. Leave it alone and learn to read it as designed.

When the AO histogram flows smoother than your morning coffee ☕
“If you only learn one AO pattern, make it the Saucer.”
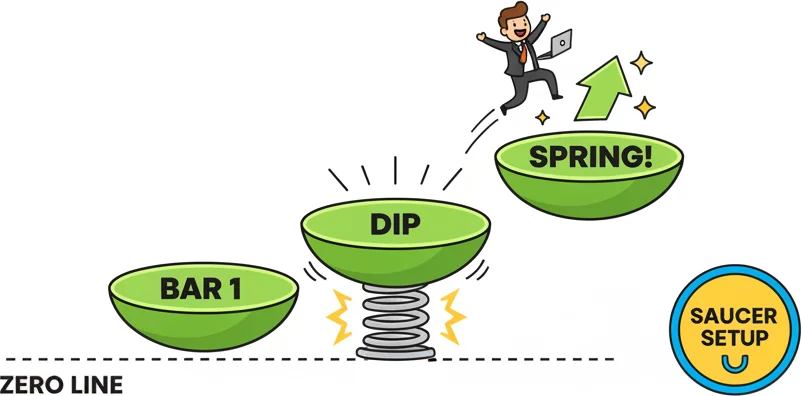
3The Saucer Setup: AO's Most Reliable Continuation Signal
If you only learn one AO pattern, make it the Saucer. This is the continuation signal — it catches moments when a trend pauses briefly and then resumes, giving you a precise entry point in the direction of the prevailing momentum. Think of it as the AO's way of saying 'the trend took a coffee break but it is coming back to work.'
The bullish Saucer requires three conditions:
- The AO histogram must be above the zero line (momentum is already bullish)
- There must be at least two consecutive red bars (a brief deceleration within the uptrend)
- The third bar must be green and higher than the second red bar (momentum resumes)
The entry triggers on the candle that completes that third bar — the green bar that confirms the pullback in momentum was temporary. Your stop-loss goes below the recent swing low that formed during the red-bar deceleration. Your target is the next structural resistance level or a fixed 1.5:1 to 2:1 reward-to-risk ratio.
The bearish Saucer is the mirror image:
- The AO histogram must be below the zero line
- At least two consecutive green bars (brief deceleration within the downtrend)
- The third bar must be red and lower than the second green bar
Why does this pattern work? Because in a genuine trend, momentum does not move in a straight line. Even strong trends produce small pullbacks where profit-taking or counter-trend orders temporarily slow the advance. The Saucer catches the exact moment that temporary slowdown ends and the primary force reasserts itself. It is designed to help traders capture opportunities during a quick change in price momentum within the established trend.
The Saucer is effectively an AO-specific version of the broader concept of buying dips in uptrends and selling rallies in downtrends, but with a concrete, rule-based definition of what constitutes a dip and what constitutes a resumption. Many traders seek to enter during the third bar or the bar immediately following it — provided the follow-up bar also confirms the direction.
Where the Saucer works best: H1 and H4 timeframes during established trends. On H4, a bullish Saucer above zero with the AO histogram bars that are tall (not just barely above zero) tends to produce moves of 60-120 pips on major forex pairs. On H1, the same pattern catches shorter moves of 20-50 pips but fires more frequently.
Where it struggles: M15 and choppy markets. On the 15-minute chart, the AO histogram flips colors so rapidly that Saucer patterns form constantly — many of them false. If you trade the Saucer on M15, add a filter: require the H1 AO to be on the same side of zero as the M15 Saucer direction. This multi-timeframe alignment cuts M15 Saucer false signals roughly in half.
Enhanced Saucer with RSI: A popular combination pairs the Saucer with the Relative Strength Index. In a bullish scenario, require the AO Saucer setup above zero plus an RSI reading above 50. This dual-momentum confirmation filters out Saucers that form during weak, indecisive momentum. The RSI acts as a second opinion — if both the AO and RSI agree that momentum favors the bulls, the setup carries more weight.
Common Saucer mistakes:
- Entering before the green (or red) confirmation bar closes. The bar must complete — an in-progress bar can change color before the candle closes.
- Trading Saucers when the histogram is barely above (or below) zero. Shallow histogram bars near the zero line produce weak Saucers because there is not much momentum behind the setup. Look for Saucers where the histogram is clearly on one side of zero, not hugging it.
- Ignoring the broader price structure. A bullish Saucer above zero that forms right at a major resistance level is a different proposition than one forming in open space. Always check where price sits relative to key levels before acting on the pattern.
The Saucer is Bill Williams' momentum equivalent of a trend continuation candlestick pattern like the bullish engulfing — except it operates on the momentum dimension rather than the price dimension. When both align (a bullish engulfing candle forming at the same time as a bullish AO Saucer), you have a high-conviction setup that many experienced Williams system traders consider their bread-and-butter entry.
The Saucer is subtle — three bars where the middle one dips but does not flip. That tiny pullback is the springboard.
4Twin Peaks: AO's Reversal Pattern with a Cool Name
If the Saucer is the AO's continuation signal, Twin Peaks is its reversal signal. And yes, the name probably sounded cooler in 1995 when the TV show was still fresh in cultural memory. But the pattern itself is one of the more elegant reversal setups in technical analysis because it captures a specific type of momentum failure.
A bullish Twin Peaks forms below the zero line and requires:
- Two distinct peaks (troughs) in the histogram, both below zero
- The second peak must be closer to zero than the first — meaning the second bearish push was weaker
- There must be a trough between the peaks (the histogram moves further from zero between them)
- A green bar must follow the second peak to confirm the reversal
The logic is straightforward: the first peak below zero represents the strongest bearish momentum. Price pushes down, the AO drops to its lowest point. Then momentum partially recovers (the trough between peaks). Then the bears try again — but this time the AO does not drop as far. The second peak is shallower. The bears could not match their previous effort. That failure to make a new momentum low, followed by a green bar, signals that the bearish pressure is exhausting.
A bearish Twin Peaks is the mirror: two peaks above zero, the second lower than the first, followed by a red bar. Importantly, the trough between both peaks must not break past the zero line — if it does, the signal is invalid because a zero-line cross resets the entire momentum context.
Twin Peaks vs. Divergence — If this sounds like divergence, you are not wrong. Twin Peaks is essentially a specific, rule-based form of momentum-price divergence. The difference is that Williams defined exact criteria — both peaks on the same side of zero, specific bar-color confirmation — rather than leaving divergence interpretation to the trader's eye. This makes Twin Peaks more systematic and less prone to the subjective 'is this divergence or not?' debates that plague RSI divergence trading.
It is also a contrarian strategy by nature. You are entering short positions when the AO is above zero (bearish Twin Peaks) and buying when the AO is below zero (bullish Twin Peaks). You are betting against the current momentum reading because the pattern tells you that momentum is losing conviction even though it has not yet crossed zero.
The critical requirement: both peaks must remain on the same side of zero. If the histogram crosses zero between the two peaks, the pattern is invalidated. This rule exists because a zero-line cross resets the momentum context entirely — you can no longer compare the two peaks as part of the same directional push.
Best timeframes for Twin Peaks: H4 is the sweet spot. On H4, Twin Peaks setups typically take 20-40 bars to form, giving the pattern enough time to develop clearly. The resulting reversals on major pairs often produce 100-200 pip moves when they work. On H1, the pattern forms faster but produces smaller moves and more false signals. On D1, Twin Peaks are rare but powerful — a daily Twin Peaks reversal can mark the beginning of a multi-week trend change.
How to trade it step by step:
- Identify the first peak below zero (for bullish) — this should be a clear trough in the histogram
- Wait for the histogram to recover (move toward zero) without crossing it
- Watch for the second push below zero that fails to match the first peak's depth
- Enter when a green bar prints after the second peak
- Stop-loss below the lowest point of the entire pattern (the first peak's corresponding price low)
- Target the next structural resistance level, or trail the stop using AO color changes
Where Twin Peaks fail: ranging markets. In a sideways consolidation, the AO can produce multiple peaks below (or above) zero that look like Twin Peaks but lead nowhere because there is no directional force to drive the reversal. Before trading a Twin Peaks setup, check that price is at a meaningful structural level — a support zone for bullish Twin Peaks, a resistance zone for bearish. The combination of momentum divergence (Twin Peaks) and structural support creates a much higher-probability reversal setup than either signal alone.
The patience factor: Twin Peaks is not a pattern you find every day. On H4, you might see one clean setup per pair every two to four weeks. That infrequency is actually a feature — it means the pattern is selective enough to maintain signal quality. Traders who force Twin Peaks setups by lowering their standards (accepting peaks that are barely different in height, or patterns where the zero line was nearly crossed) end up diluting the edge.

Twin Peaks: When momentum pulls a complete 180 on you 🔄
“Bill Williams never intended the AO to be used alone.”
5AO + Fractals: Bill Williams' Complete Trading System
Bill Williams never intended the AO to be used alone. In his Trading Chaos methodology, the AO was one piece of a five-indicator system that he called the five dimensions of the market: the Alligator (trend direction), Fractals (entry triggers), AO (momentum), Accelerator Oscillator (momentum acceleration), and the Gator Oscillator (trend dormancy). But you do not need all five to build a solid strategy. The AO paired with Fractals creates a potent two-indicator system that covers both momentum and price structure.
What are Fractals? Williams' Fractals are five-bar patterns where the middle bar has the highest high (bearish fractal, marking resistance) or the lowest low (bullish fractal, marking support). On MT5, they appear as small arrows above or below the candles. Fractals serve as natural structural reference points — they mark where price found buyers or sellers in the recent past.
In Williams' system, fractals come first. He was explicit about the trading sequence: unless price breaks above a bullish fractal or below a bearish fractal, you should not consider any other indicator signals to take a trading decision. The fractal breakout is Dimension One — everything else follows.
The AO + Fractals Strategy:
For long entries:
- Wait for the AO to cross above the zero line (bullish momentum confirmed)
- Identify a bullish fractal (a fractal arrow below a candle) that formed during or after the AO cross
- Place a buy stop order one pip above the high of the fractal candle
- If price breaks above that fractal high, the order triggers — momentum and structure are aligned
- Stop-loss below the most recent bearish fractal (the nearest fractal below price)
- Target the next bearish fractal above the entry, or use a 1.5:1 reward-to-risk minimum
For short entries:
- Wait for the AO to cross below the zero line
- Identify a bearish fractal that formed during or after the cross
- Place a sell stop one pip below the low of the fractal candle
- Stop-loss above the most recent bullish fractal
- Target the next bullish fractal below entry
This system works because it solves the two biggest problems traders face with the AO alone. First, the AO tells you momentum has shifted but does not tell you where to enter — Fractals provide that structural entry point. Second, the AO does not define stop-loss levels — Fractals provide natural invalidation points based on recent price extremes.
Adding the Alligator as a trend filter takes this from good to excellent. The Alligator is a system of three smoothed moving averages (Jaw 13-period shifted 8 bars, Teeth 8-period shifted 5 bars, Lips 5-period shifted 3 bars) that Williams used to define whether the market is trending or sleeping. When the three lines are intertwined (closed mouth), the market is ranging — avoid trading. When they are separated and pointing in one direction (open mouth), the market is trending — take AO + Fractal signals in that direction only.
The Alligator filter eliminates the biggest source of AO false signals: ranging markets. During consolidation, the AO oscillates around zero and produces frequent crosses that go nowhere. The Alligator's closed-mouth state warns you to stay flat during those periods.
The full Williams signal stack: For the highest-conviction entries, align all three. AO positive and green (momentum up and accelerating) + Alligator mouth open and pointing up (trend confirmed) + price breaking above a bullish fractal (structure confirms). When all three dimensions agree, the probability of a sustained move increases substantially. The same logic applies in reverse for shorts.
Practical timeframe recommendations for the combined system:
- M15: High noise on AO, too many fractals to filter — marginal fit, needs additional filters like an EMA 200 trend filter.
- H1: Moderate AO noise, good fractal structure with 30-50 pip targets. Solid for intraday swing entries. Produces two to four tradeable setups per week on EUR/USD or GBP/USD during trending conditions.
- H4: Clean AO signals, excellent fractal structure with 80-150 pip targets. Best overall balance. Manageable for part-time traders who check charts a few times per day.
Risk management within the Williams system: Williams recommended risking no more than 2-5% per trade and using Fractals as trailing stops. As price moves in your favor and new Fractals form behind it, you move your stop to each new Fractal level. This creates a natural trailing stop that respects market structure rather than arbitrary pip distances. Instead of a fixed take-profit, you let the market's own turning points — the Fractals — tell you when the move is losing structural support.
One final note on the AO's role within this system: it acts as a gatekeeper. You do not take a Fractal breakout trade unless the AO supports the direction. And you do not trade an AO signal without a Fractal to define your entry and stop. Neither indicator is the star — the combination is. Williams was explicit about this in his books: individual indicators are tools, but trading systems are toolkits. The AO is your momentum wrench. Fractals are your structural screwdriver. The Alligator is your trend-direction level. Use them together, and you have a framework that covers direction, momentum, entry, and exit — which is more than most single-indicator strategies can claim.

AO alone is good. AO plus Fractals is what Williams actually designed — the full system, not just one piece.
Frequently Asked Questions
Q1What is the Awesome Oscillator and how is it calculated?
The Awesome Oscillator is a momentum histogram developed by Bill Williams that measures the difference between a 5-period simple moving average and a 34-period simple moving average, both applied to the median price (High + Low) / 2 of each candle. When the result is positive, short-term momentum is stronger than the longer-term baseline. When negative, momentum has weakened. The histogram bars are colored green when rising and red when falling, reflecting the direction of momentum change rather than absolute value. Williams chose median price over closing price because it captures the true midpoint of trading activity, making the AO more stable than close-based oscillators.
Q2What are the three main AO trading signals?
The three core signals are the Zero Line Cross (histogram moves from negative to positive for a bullish signal, or the reverse for bearish — the most lagging but most reliable confirmation), the Saucer (a three-bar continuation pattern where momentum briefly dips then resumes within an existing trend — the most frequent and practical signal), and Twin Peaks (a two-peak reversal pattern where the second momentum peak fails to match the first, signaling exhaustion — a contrarian signal). The Saucer is considered the most reliable for trend continuation, while Twin Peaks targets reversals at structural levels.
Q3How is the Awesome Oscillator different from MACD?
The AO uses simple moving averages applied to the median price of each candle, while MACD uses exponential moving averages applied to the closing price. This makes the AO less reactive to individual candle spikes or dramatic closes — a single news candle distorts MACD more than it distorts the AO. The AO also lacks a signal line, relying instead on histogram patterns like the Saucer and Twin Peaks for trade signals rather than line crossovers. The AO's fixed parameters (5 and 34) are not meant to be changed, while MACD's periods are commonly adjusted. Both measure momentum, but the AO tends to produce fewer false signals in exchange for slightly more lag.
Q4Should I change the AO's default settings from 5 and 34?
No. Bill Williams designed the AO specifically around the 5 and 34 period parameters — both Fibonacci numbers — and all three signal patterns (Zero Line Cross, Saucer, and Twin Peaks) were defined and tested using those values. Changing them alters the indicator's behavior and invalidates the standard pattern rules. The settings are embedded in the MT5 built-in AO and cannot be changed through the platform interface. Unlike indicators such as RSI where period adjustment is common, the AO is meant to run on its fixed defaults across all timeframes and all instruments.
Q5Can I use the Awesome Oscillator as my only indicator?
You can, but you probably should not. Williams himself designed the AO as one component within a multi-indicator system — the five dimensions of the market — that included Fractals, the Alligator, and the Accelerator Oscillator. The AO tells you about momentum direction and strength, but it does not define entry levels, stop-loss placement, or trend context on its own. Used alone, it will generate many false signals, especially in ranging conditions. Pairing it with at least one structural tool like Fractals and one trend filter like the Alligator or a 200 SMA dramatically improves signal quality and gives you the entry, stop, and directional framework the AO alone cannot provide.
Top Brokers
About the Author
Daniel Harrington
Senior Trading Analyst
Daniel Harrington is a Senior Trading Analyst with a MScF (Master of Science in Finance) specializing in quantitative asset and risk management. With over 12 years of experience in forex and derivatives markets, he covers MT5 platform optimization, algorithmic trading strategies, and practical insights for retail traders.
Use This Indicator
Risk Disclaimer
Trading financial instruments carries significant risk and may not be suitable for all investors. Past performance does not guarantee future results. This content is for educational purposes only and should not be considered investment advice. Always conduct your own research before trading.