Bollinger %B Indicator: Precise Position Within the Bands for Better Entries
Bollinger %B shows where price is relative to the Bollinger Bands, with values above 1 indicating price above the upper band and below 0 below the lower band.

Daniel Harrington
Senior Trading Analyst · MT5 Specialist
☕ 17 min read
Settings — %B
| Category | volatility |
| Default Period | 20 |
| Best Timeframes | M15, H1, H4 |
Bollinger Bands are one of the most popular tools on any trader's chart — but they have a dirty little secret. Reading them is subjective. Is price "near" the upper band? Is it "touching" the lower band? Ask five traders and you'll get five different answers. That's exactly why John Bollinger created %B: to turn a visual guess into a precise number between 0 and 1 (and sometimes beyond). Instead of squinting at bands and hoping your eyes are calibrated, %B tells you exactly where price sits relative to the bands — as a clean decimal you can build rules around, backtest, and actually trust.
Key Takeaways
- John Bollinger introduced %B in the early 2000s as a companion to his famous Bollinger Bands, and the motivation was ref...
- Understanding %B starts with four reference points, and once you internalize these, you'll read the indicator intuitivel...
- Mean reversion with %B is probably the most natural application of this indicator, and it's where beginners should start...
1Why Bollinger Created %B: Making Band Position a Number
John Bollinger introduced %B in the early 2000s as a companion to his famous Bollinger Bands, and the motivation was refreshingly practical. Traders kept asking the same question: how do I know when price is at the top of the bands versus near the middle? On a zoomed-out daily chart, a close that looks like it's touching the upper band might actually be 15 pips below it. On a zoomed-in M15 chart, a modest move can look dramatic. Human perception is terrible at gauging relative position on a dynamic, self-adjusting envelope. %B fixes this permanently.
The formula is elegant in its simplicity:
%B = (Price - Lower Band) / (Upper Band - Lower Band)
That's it. You take the current price, subtract the lower Bollinger Band value, and divide by the total band width. The result is a number that tells you exactly where price is positioned within the bands as a proportion. With the standard 20-period SMA and 2 standard deviations, the lower band represents zero and the upper band represents one.
Before %B existed, traders using Bollinger Bands had to do everything visually. "Price is near the lower band" might mean %B is at 0.08, or it might mean %B is at 0.22 — those are fundamentally different situations that look almost identical on a busy chart with multiple indicators. One is a genuine band touch that statistically tends to produce a bounce. The other is just price hanging out in the lower half of the range, doing nothing special.
Bollinger himself was explicit about why this mattered: he wanted traders to be able to write systematic rules. You can't program a trading system around "price looks close to the band." But you absolutely can program one around "%B drops below 0.05" or "%B crosses above 0.80." That precision is the entire point of the indicator's existence.
There's also a normalization benefit that often gets overlooked. Because %B divides by band width, it automatically adjusts for volatility. During a high-volatility expansion, the bands are wide and a large price move might only push %B from 0.5 to 0.7. During a low-volatility squeeze, the bands are narrow and a tiny price move can send %B from 0.5 to 0.95. This self-adjusting behavior means %B readings are comparable across different market conditions — a reading of 0.90 always means "price is 90% of the way from the lower band to the upper band," whether the bands are 40 pips wide or 120 pips wide.
For MetaTrader 5 users, %B isn't built into the default indicator list. You'll need to grab it from the MQL5 community library or code it yourself — which takes about five lines of MQL since the formula is just basic arithmetic. On TradingView, it's available natively as "Bollinger Bands %B" in the indicator search. The default settings match the parent Bollinger Bands: 20-period SMA with 2 standard deviations, which works well on M15, H1, and H4 timeframes without modification.
The conceptual leap that makes %B powerful is treating the Bollinger Bands not as lines on a chart but as a coordinate system. The lower band is your floor (0), the upper band is your ceiling (1), and the moving average is dead center (0.5). Once you think of it this way, every price bar gets an exact address within that system. No more guessing, no more squinting. Just a number you can actually work with.
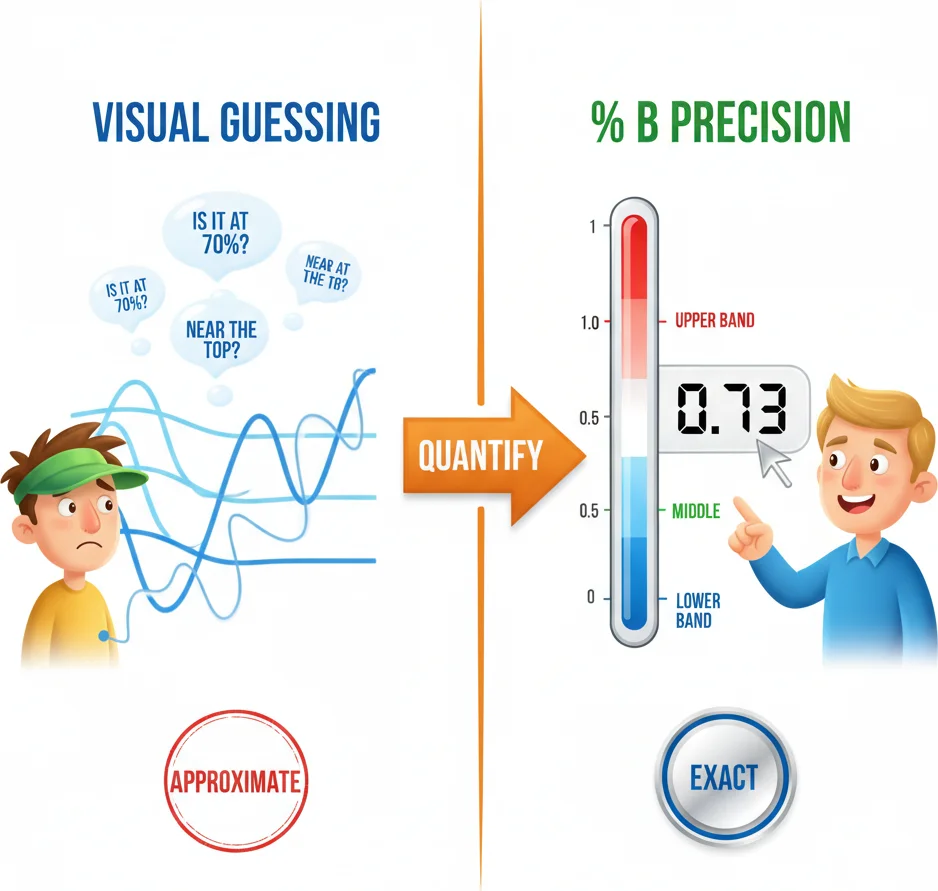
Instead of squinting at bands wondering where price is, %B gives you the exact answer: 0.73. Done.
2%B Values Decoded: 0, 0.5, 1, and Beyond
Understanding %B starts with four reference points, and once you internalize these, you'll read the indicator intuitively.
%B = 1.0 means price is exactly at the upper Bollinger Band. Not above it, not near it — mathematically sitting right on it. In a strong uptrend, %B will hover around 0.80 to 1.0 for extended periods, occasionally poking above 1.0 during momentum thrusts. This is what Bollinger called "walking the band" — a persistent condition where price hugs the upper band as the trend advances. Seeing %B at 1.0 is not inherently a sell signal. It depends entirely on context.
%B = 0.5 means price is at the 20-period moving average — the exact midpoint of the bands. This level functions as a natural gravitational center. Mean reversion traders use 0.5 as their profit target: enter at extremes, exit at the middle. Trend traders use it as a re-entry zone: wait for a pullback to the moving average (where %B reads 0.5), then rejoin the trend. On EUR/USD H1, price touches the %B = 0.5 level an average of 3 to 5 times per trading day, making it a practical reference that triggers frequently enough to build strategies around.
%B = 0.0 means price is at the lower Bollinger Band. Again, this is a mathematical statement — price equals the lower band value exactly. In ranging markets, this often marks a bounce zone. In downtrends, price can sit at or below zero for days as it rides the lower band downward. The mistake most beginners make is treating every touch of zero as a buy signal. That works beautifully in sideways markets and kills accounts in trending ones.
Now here's where it gets interesting: %B can go above 1.0 and below 0.0. A reading of 1.15 means price has closed 15% of the band width above the upper band. A reading of -0.10 means price has closed 10% of the band width below the lower band. These extreme readings are relatively rare — statistically, under a normal distribution assumption with 2 standard deviations, price should close outside the bands roughly 5% of the time. When it happens, you're looking at a genuine statistical outlier.
But — and this is crucial — being a statistical outlier doesn't automatically mean reversal. In trending markets, outlier readings can persist or even intensify. During the January 2024 USD/JPY rally, %B on the daily chart stayed above 0.90 for 14 consecutive sessions and exceeded 1.0 on three of them. Shorting at 1.0 would have been painful. The correct reading of %B above 1.0 is: something unusual is happening, pay close attention. It's a flag, not a trigger.
The range between 0.20 and 0.80 is what I'd call the "normal zone." When %B oscillates within this range, price is essentially moving within the expected bounds of recent volatility. Nothing dramatic. No edge. Most of the time, %B lives here — which means most of the time, there's no signal. That's actually a feature. An indicator that fires constantly is useless. %B's value lies precisely in those moments when it leaves the normal zone.
For practical thresholds that work across major forex pairs on H1 and H4:
- Above 0.95: Strong bullish momentum or overbought in a range
- 0.80 to 0.95: Bullish bias, price in upper quarter of bands
- 0.20 to 0.80: Neutral zone, no directional edge from %B alone
- 0.05 to 0.20: Bearish bias, price in lower quarter of bands
- Below 0.05: Strong bearish momentum or oversold in a range
These aren't rigid rules — they're starting points. Adjust based on whether the market is trending or ranging, which we'll cover in the next section.
One detail that trips up newcomers: %B reacts to band width changes, not just price changes. If price stays flat but volatility contracts (bands narrow), %B will drift toward whichever band price is closest to because the denominator in the formula is shrinking. This means %B can move even when price doesn't. During a squeeze, keep in mind that %B movements might reflect band contraction rather than genuine price momentum.

When %B hits exactly 0.5 - you're perfectly centered in the Bollinger Band universe!
“Mean reversion with %B is probably the most natural application of this indicator, and it's where beginners should start.”
3%B for Mean Reversion: Trading Bounces at 0 and 1
Mean reversion with %B is probably the most natural application of this indicator, and it's where beginners should start. The logic is simple: when price reaches an extreme position within the bands (near 0 or near 1), it has a statistical tendency to revert toward the mean (0.5). Your job is to identify when that tendency is likely to play out and when it's a trap.
Let's start with the basic setup. A mean reversion long triggers when %B drops below 0.05 — price has either touched or dipped slightly below the lower Bollinger Band. You enter long with a target at %B = 0.50 (the 20-period moving average) and a stop loss below the recent swing low or a fixed distance below the lower band. A mean reversion short triggers when %B exceeds 0.95 — price is at or above the upper band. You enter short targeting %B = 0.50, with a stop above the recent swing high.
On paper, this works. In practice, there's one absolutely critical filter: this strategy only functions in ranging markets. In a strong trend, %B can stay above 0.80 for weeks while price grinds relentlessly higher. Shorting every time %B hits 0.95 during a trend is a strategy for blowing up an account with remarkable efficiency.
So how do you distinguish ranging from trending? The simplest approach: check the slope of the 50-period moving average. If it's essentially flat (slope near zero), you're in a range — go ahead with mean reversion. If the 50 MA is clearly angled upward, only take mean reversion longs (buy at the lower band). If it's angled downward, only take mean reversion shorts (sell at the upper band). This one rule eliminates most of the catastrophic losers.
Larry Connors popularized a more sophisticated version in his book "High Probability ETF Trading." His approach requires three consecutive closes with %B below 0.20 (not just one touch), with price still above the 200-day moving average as a trend filter. The exit comes when %B closes above 0.80. On backtested equity data, this approach produced win rates above 70% — though the holding periods varied from 2 to 15 days, which tests your patience.
Adapting Connors' approach to forex on H4, I'd modify the rules slightly. Instead of three consecutive closes below 0.20, look for two consecutive closes below 0.10 — forex pairs on H4 don't spend as much time at band extremes as daily equities do, so tightening the threshold compensates for the shorter timeframe. The trend filter changes from the 200 SMA (which is unwieldy on H4) to the 50-period EMA. Take longs when price is above the 50 EMA and %B drops below 0.10 for two bars. Target the first touch of %B = 0.50. Stop loss goes 10 pips below the lower Bollinger Band at entry.
For major pairs like EUR/USD and GBP/USD on H4, this modified approach typically generates 2 to 4 signals per week and targets moves of 30 to 60 pips per trade. The average trade duration is 8 to 16 hours — long enough to capture a meaningful reversion but short enough that overnight risk is manageable.
The mirror trade (shorting at the upper band) follows the same logic in reverse, but with one asymmetry worth noting: markets tend to fall faster than they rise. A mean reversion short from %B above 0.90 to the 0.50 target often completes in fewer bars than the equivalent long from below 0.10 back to 0.50. This means your short trades will typically have shorter holding periods and slightly better risk/reward ratios — something to factor into your position sizing.
A common mistake is setting the profit target at the opposite band instead of the midline. If you're long from %B = 0.0 and targeting %B = 1.0, you're asking for the entire band width as your move. That happens sometimes, but it's rare in a single impulse. Price usually stalls at the moving average (0.5) before deciding whether to continue or reverse. Taking the 0.5 target gives you a realistic, repeatable exit that keeps your win rate healthy.
One more thing: pay attention to band width when taking mean reversion trades. If the bands are extremely narrow (a Bollinger squeeze), the distance from the lower band to the midline might be only 15 pips — hardly worth the risk after spreads and slippage. Mean reversion %B trades work best when band width is at or above its 20-period average, ensuring the target offers enough pips to justify the trade.
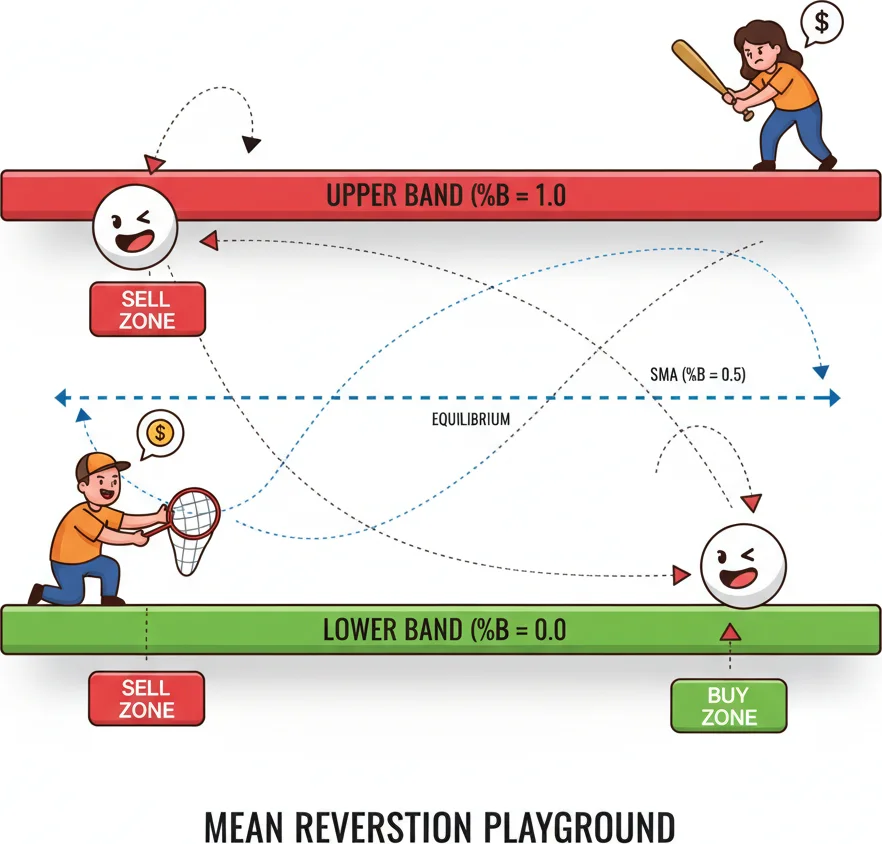
When %B hits 0, price is kissing the lower band. When it hits 1, it is at the ceiling. Bounce traders live here.
4%B + Volume: Confirming Band Touches with Participation
Here's a question that separates intermediate traders from beginners: when %B hits an extreme, how do you know if it's a genuine reversal setup or just a momentary poke that means nothing? The answer, more often than not, is volume.
A band touch with volume is a band touch with conviction. A band touch on thin volume is just noise wandering to the edge of its cage. This distinction matters enormously for trade quality, and it's the reason Bollinger himself recommended pairing %B with the Money Flow Index — a volume-weighted oscillator — rather than using %B alone.
Let's start with the basic framework. When %B drops below 0.05 (price at or below the lower band), check what volume is doing. You're looking for one of two volume patterns that suggest a reversal is coming:
Pattern 1: Volume spike followed by volume decline. Price plunges to the lower band on a burst of selling volume. The next bar, price still sits near the band, but volume drops by 30% or more. This sequence — panic selling followed by exhaustion — is the footprint of capitulation. The sellers have finished dumping, and there's nobody left to push price lower. This is your highest-probability mean reversion setup.
Pattern 2: Sustained high volume with a long lower wick. Price touches the lower band on heavy volume, but the candle closes well off its lows, leaving a long lower shadow (wick). The volume confirms participation — people were actively trading at these levels — and the wick confirms rejection. Buyers stepped in and absorbed the selling pressure during that bar.
Contrast these with the pattern you want to avoid: %B drops below 0.05 on low, unremarkable volume. Price just drifted to the lower band because nothing was happening. No sellers capitulated, no buyers defended — it was just a quiet market with nothing going on. These low-volume band touches are where mean reversion trades go to die. Without volume participation, there's no real "event" to trigger a reversal. Price might sit at the lower band for hours, slowly grinding lower as the band adjusts to catch up.
Bollinger's preferred volume tool was the Money Flow Index (MFI), and his specific system was straightforward: buy when %B is above 0.80 and MFI is above 80 (momentum thrust), sell when %B is below 0.20 and MFI is below 20 (momentum collapse). This is a trend-following approach, not mean reversion — high %B with high MFI means money is flowing into the move with conviction, so join the trend rather than fade it.
For mean reversion traders, I'd flip that MFI logic: buy when %B drops below 0.10 and MFI is below 20 (oversold on both price position and money flow), targeting a reversion to 0.50. The double confirmation — price at the band extreme plus volume-weighted exhaustion — filters out roughly half the false signals compared to %B alone.
On MetaTrader 5, if you don't have MFI available or prefer something simpler, raw tick volume works as a reasonable proxy. The absolute tick count on forex doesn't represent true market volume, but relative changes in tick volume do correlate with participation. If the bar where %B hits zero has 150% of the 20-bar average tick volume, that's a meaningful participation spike regardless of whether it maps to actual dollar volume.
Another effective pairing is %B with On-Balance Volume (OBV). While %B tells you where price sits within the bands, OBV tells you whether volume is accumulating (flowing in) or distributing (flowing out) over time. A bullish divergence between OBV and price when %B is below 0.10 — price making lower lows but OBV making higher lows — is a strong signal that buying pressure is building under the surface even as price sits at the lower band. This setup, when it occurs on H4, tends to precede multi-day reversals rather than just a quick bounce to the midline.
For practical implementation on H1 charts, here's a complete volume-confirmed %B system:
Entry: %B below 0.05, current bar's tick volume at least 1.3x the 20-bar volume average, and the current bar closes in its upper half (evidence of buyer absorption). Stop: 5 pips below the low of the entry bar. Target: First touch of %B = 0.45 (slightly below the midline to ensure you actually get filled before price might reverse again). Time filter: Only take signals during the London-New York overlap (12:00 to 16:00 UTC) when volume is naturally highest and mean reversion moves tend to complete faster.
The volume filter alone reduces your signal count from maybe 8 to 10 raw %B touches per week down to 3 or 4 — but those 3 or 4 are materially better trades. That's the trade-off with volume confirmation: fewer signals, higher quality. For most retail traders managing limited capital, quality beats quantity every single time.
High volume at band touches means the crowd agrees - that's when %B signals get serious!
“If you already have Bollinger Bands on your chart, why bother adding %B as a separate indicator? Fair question.”
5%B vs Raw Bollinger Bands: When the Number Beats the Visual
If you already have Bollinger Bands on your chart, why bother adding %B as a separate indicator? Fair question. And the answer isn't always "you should" — there are situations where the visual bands are sufficient and adding %B just clutters the screen. But there are specific scenarios where the numerical precision of %B provides an edge that no amount of squinting at bands can replicate.
Scenario 1: Backtesting and system building. This is %B's killer application, full stop. You cannot backtest a strategy based on "price touches the upper Bollinger Band" because "touches" is ambiguous. Does the high need to touch? The close? Within 3 pips? Within 10 pips? Every tester will define it differently, making results unreproducible. %B eliminates this problem entirely. "%B crosses above 0.95" is an objective, binary condition that any platform can test consistently. If you're building systematic strategies — even simple ones — %B is not optional. It's required.
Scenario 2: Multi-timeframe analysis with precise levels. Suppose you're watching EUR/USD on both H1 and H4, and you want to know if both timeframes agree that price is at a band extreme. On the visual chart, the H1 Bollinger Bands and H4 Bollinger Bands will have completely different widths and positions, making visual comparison nearly impossible. But if H1 %B reads 0.03 and H4 %B reads 0.08, you instantly know that price is near the lower band on both timeframes — a much stronger signal than a single-timeframe touch. Try getting that information from overlapping band lines on a chart.
Scenario 3: Comparing band position across instruments. Checking whether Gold and Silver are both at similar %B levels is a two-second glance at two numbers. Comparing their visual band positions requires loading two separate charts with potentially very different scales and band widths. For traders who scan multiple pairs or trade correlated instruments, %B's normalization is a genuine time-saver.
Scenario 4: Divergence detection. Spotting divergence between price and %B is significantly easier than spotting divergence between price and the bands visually. When price makes a new high but %B makes a lower high, that's immediately visible on the %B sub-window because you're comparing peaks on a bounded oscillator. On the Bollinger Bands overlay, the equivalent information — price made a new high but the distance to the upper band increased — is nearly invisible without careful measurement.
Now, when should you stick with visual Bollinger Bands and skip %B?
If you're a discretionary trader who makes decisions based on price action patterns and candlestick formations at band touches, the visual bands give you all the context you need. You can see the candle shape, the wick rejection, the proximity to the band — all in one chart window without needing a separate oscillator. Adding %B in this case just duplicates information you're already processing visually.
If you're primarily using Bollinger Bands for volatility context (recognizing squeezes and expansions), the visual bands are actually superior to %B. Band width changes are immediately obvious on the price chart — you can see the bands pinching together or spreading apart. %B doesn't show band width at all; you'd need the separate Bollinger Band Width indicator for that. Using %B to analyze volatility would be using the wrong tool.
Also worth noting: the Bollinger Bands overlay has the advantage of staying on the price chart, which means you can see the bands' relationship to support and resistance levels, trendlines, and candlestick patterns all at once. %B sits in a separate sub-window and disconnects from that visual context. Many experienced traders find that the bands plus price action tell a richer story than the %B number alone.
The optimal setup for most traders is to keep Bollinger Bands on the price chart for visual context and add %B in a sub-window only when you need precision: for alert-based trading, multi-timeframe confirmation, or systematic strategy development. You don't have to choose one or the other — they serve complementary purposes.
One final thought on this. Some platforms (TradingView in particular) let you set price alerts directly on %B values — "alert me when %B drops below 0.05 on EUR/USD H4." That capability alone justifies having %B available even if you never actually look at the line on your chart. Setting an equivalent alert on the visual Bollinger Bands would require you to calculate the band values manually and update the alert constantly as the bands move. With %B, the alert is self-adjusting because the indicator is self-adjusting. Set it once, forget it, and wait for the notification. That's a practical workflow advantage that saves real time over a trading week.
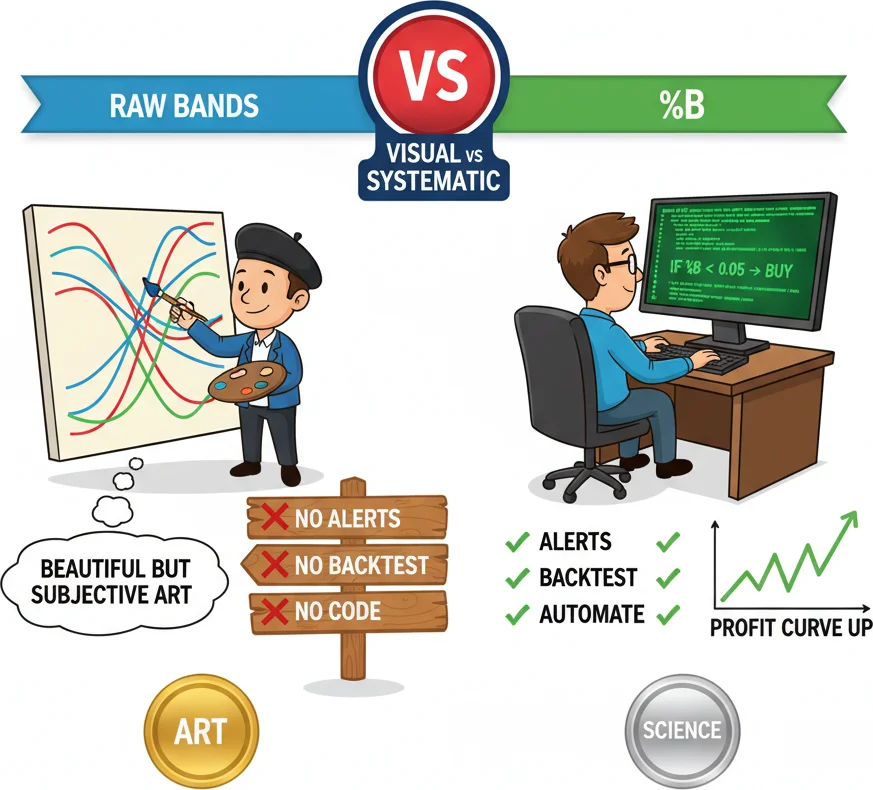
%B lets you backtest, set alerts, and code strategies. Try backtesting a visual squeeze — good luck.
Frequently Asked Questions
Q1What is the best %B setting for forex day trading?
The default 20-period with 2 standard deviations works well for most forex day trading on M15 and H1 timeframes. On M15, you'll see more frequent signals — expect %B to hit extremes 6 to 10 times per session on active pairs — so pair it with a volume or RSI filter to reduce noise. On H1, the same settings produce 2 to 4 quality signals per day on major pairs. Avoid shortening the period below 14 on intraday charts because the standard deviation calculation becomes statistically unreliable with too few data points, leading to erratic band movements and meaningless %B readings.
Q2Is %B above 1.0 always a sell signal?
No. A %B reading above 1.0 means price has closed above the upper Bollinger Band, which is statistically unusual but not inherently bearish. In strong uptrends, price can close above the upper band for multiple consecutive sessions — this is called walking the band and it signals strength, not exhaustion. Treat %B above 1.0 as a sell signal only in confirmed ranging markets where the 50-period moving average is flat. In trending conditions, above-1.0 readings are better interpreted as momentum confirmation.
Q3Can I use %B without Bollinger Bands on my chart?
Yes, %B is a standalone indicator that contains all the mathematical information from the Bollinger Bands in a single oscillator line. You don't need the bands plotted on your price chart to use %B effectively. However, most traders benefit from having both: the bands on the price chart for visual context and support/resistance interaction, and %B in a sub-window for precise readings, alerts, and systematic rule-building. If screen space is limited, %B alone is sufficient for signal generation.
Q4How is %B different from Bollinger Band Width?
They measure completely different things. %B tells you where price sits within the bands — its position from the lower band (0) to the upper band (1). Bollinger Band Width tells you how far apart the bands are — measuring volatility. A %B reading of 0.50 tells you nothing about whether the bands are wide or narrow, and a Band Width reading tells you nothing about whether price is near the top or bottom of the range. Effective Bollinger Band analysis often uses both: Band Width to identify volatility regime (squeeze vs expansion) and %B to identify price position within that regime.
Q5Does %B work better on stocks or forex?
The indicator works on any liquid market, but the optimal thresholds differ. Forex pairs on H1 and H4 tend to respect the 0.05 and 0.95 levels as meaningful extremes because currency markets are highly mean-reverting on intraday timeframes. Individual stocks can trend more aggressively, so extreme %B readings persist longer — you may need to tighten thresholds to 0.02 and 0.98 or add a trend filter. ETFs and indices behave similarly to forex in terms of %B mean reversion reliability. The formula itself is identical across all markets; only the interpretation and threshold calibration change.
Top Brokers
About the Author
Daniel Harrington
Senior Trading Analyst
Daniel Harrington is a Senior Trading Analyst with a MScF (Master of Science in Finance) specializing in quantitative asset and risk management. With over 12 years of experience in forex and derivatives markets, he covers MT5 platform optimization, algorithmic trading strategies, and practical insights for retail traders.
Use This Indicator
Risk Disclaimer
Trading financial instruments carries significant risk and may not be suitable for all investors. Past performance does not guarantee future results. This content is for educational purposes only and should not be considered investment advice. Always conduct your own research before trading.