Chaikin Money Flow (CMF) Indicator: Measuring Buying & Selling Pressure Over Time
CMF measures the amount of money flow volume over a period, with positive values indicating buying pressure and negative values indicating selling pressure.

Daniel Harrington
Senior Trading Analyst · MT5 Specialist
☕ 19 min read
Settings — CMF
| Category | volume |
| Default Period | 20 |
| Best Timeframes | H1, H4, D1 |
Most volume indicators give you a vague "volume is up" or "volume is down" and leave you to figure out the rest. Chaikin Money Flow takes a different approach — it tells you exactly where within each candle's range the close landed, weights that position by volume, and averages the whole thing over 20 periods. The result is a single oscillator between -1 and +1 that answers a very specific question: is money flowing into this asset, or quietly sneaking out the back door? Developed by Marc Chaikin in the 1980s, CMF was built on the observation that institutional players leave fingerprints in the relationship between closing prices and trading ranges. When the big money is accumulating, price tends to close near the high of each bar. When they're distributing, price drifts toward the low — even if the candle itself looks bullish. CMF captures that subtlety in a way that simpler volume tools miss entirely, and once you learn to read it, you'll start noticing things on your charts that were hiding in plain sight.
Key Takeaways
- Marc Chaikin didn't wake up one morning and invent CMF from scratch. The indicator was the product of a decades-long obs...
- The CMF formula has three steps, and none of them require a math degree. If you can subtract and divide, you can calcula...
- If you had to reduce CMF to one rule — one sentence you could tape to your monitor — it would be this: CMF above zero me...
1Marc Chaikin's Evolution: From A/D Line to Money Flow
Marc Chaikin didn't wake up one morning and invent CMF from scratch. The indicator was the product of a decades-long obsession with one question: how do you measure whether institutional investors are buying or selling when they're specifically trying not to be noticed?
Chaikin spent the early part of his career as a stockbroker on Wall Street in the 1960s and 1970s, watching large block trades move markets in ways that retail investors couldn't see on standard price charts. He became fascinated with the work of Joe Granville and Larry Williams — two pioneers who had independently tackled the volume-price relationship. Granville's On Balance Volume (OBV), introduced in 1963, was revolutionary but blunt: it treated every up-close day as bullish and every down-close day as bearish, regardless of where within the bar's range the close actually landed. Williams' Accumulation/Distribution concept refined this by looking at the close relative to the open, but Chaikin felt it still missed nuance.
Chaikin's key insight was the Close Location Value (CLV) — the idea that where price closes within its high-low range matters more than whether it closed up or down from the previous bar. A stock that trades between $50 and $52 and closes at $51.80 is showing accumulation (close near the high), even if the previous close was $51.90. OBV would call that a down day and subtract volume. Chaikin's approach would recognize the buying pressure within the bar itself.
This led to his first major creation: the Accumulation/Distribution Line (A/D Line), which applies the CLV concept as a running cumulative total — similar to OBV but weighted by intrabar close position rather than simple up/down classification. The A/D Line became widely adopted and remains a standard indicator on every major platform today.
But Chaikin wasn't satisfied. The A/D Line, being cumulative, carried one practical problem: its absolute value was meaningless, and it could drift for months in one direction, making it hard to identify when accumulation or distribution was actually intensifying or fading. He needed a way to normalize the signal — to create a bounded oscillator that would tell you the current state of money flow over a defined period, not just the historical total.
The solution was CMF: take the A/D Line concept, but instead of running an infinite cumulative total, average the money flow volume over a fixed 20-period window and divide by total volume. The result is an oscillator that stays between -1 and +1, resets naturally as old data drops off, and gives you a real-time reading of whether the last 20 bars show net accumulation or net distribution.
| Evolution Step | Creator | Concept | Limitation Chaikin Saw |
|---|---|---|---|
| On Balance Volume (1963) | Joe Granville | Cumulative volume, up-close adds, down-close subtracts | Ignores where close lands within bar's range |
| Accumulation/Distribution | Larry Williams / Chaikin | CLV-weighted cumulative volume | Unbounded — absolute value meaningless, hard to read current state |
| Chaikin Money Flow (1980s) | Marc Chaikin | CLV × Volume averaged over 20 periods | Bounded -1 to +1, shows current money flow state |
Chaikin went on to develop other tools — notably the Chaikin Oscillator (the MACD of the A/D Line) and Chaikin Volatility — but CMF remains his most widely used creation in retail trading. He later founded Chaikin Analytics, a platform that combines his indicators into proprietary stock ratings. Whatever you think of the commercial venture, the intellectual progression from OBV's simplicity through the A/D Line's refinement to CMF's normalization represents one of the cleanest evolutions in technical analysis history.
The practical takeaway for you: CMF wasn't invented in isolation. It was specifically designed to fix the weaknesses of the two indicators that came before it. Understanding that progression helps you understand what CMF does well (measuring current-period money flow direction) and what it deliberately doesn't do (provide a cumulative historical record like OBV).
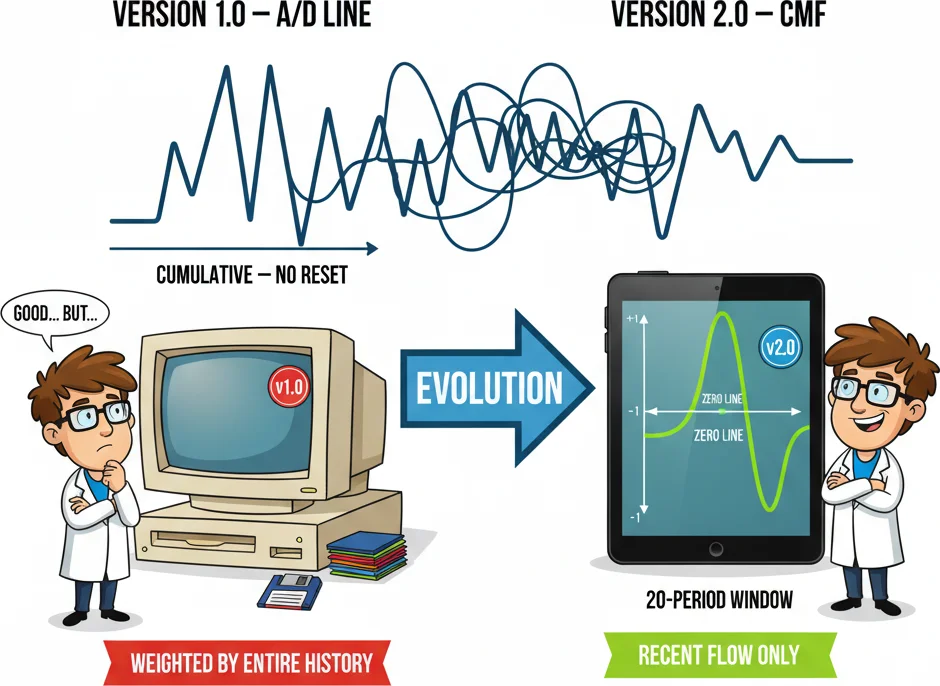
The A/D line was Chaikin is first attempt. CMF was the upgrade — same DNA, better time frame control.
2CMF Calculation: Close Location Value × Volume, Averaged
The CMF formula has three steps, and none of them require a math degree. If you can subtract and divide, you can calculate CMF by hand — though thankfully your charting platform handles this for you.
Step 1: Close Location Value (CLV)
This is the engine of the entire indicator. CLV measures where the close sits within the high-low range of each bar:
CLV = [(Close - Low) - (High - Close)] / (High - Low)
This simplifies to:
CLV = (2 × Close - Low - High) / (High - Low)
The result ranges from -1 to +1. A close at the exact high of the bar produces CLV = +1. A close at the exact low produces CLV = -1. A close at the exact midpoint of the range produces CLV = 0. Most real candles land somewhere in between.
Let's see this in action with a real EUR/USD H4 candle:
- High: 1.0920, Low: 1.0880, Close: 1.0912
- CLV = [(1.0912 - 1.0880) - (1.0920 - 1.0912)] / (1.0920 - 1.0880)
- CLV = [0.0032 - 0.0008] / 0.0040 = 0.0024 / 0.0040 = +0.60
That +0.60 tells you the close was 80% of the way up the bar's range — strong buying pressure within this candle. Not quite at the high, but close.
Step 2: Money Flow Volume (MFV)
Multiply the CLV by the bar's volume:
MFV = CLV × Volume
Using our example with tick volume of 14,500:
- MFV = 0.60 × 14,500 = +8,700
Positive MFV means volume-weighted buying pressure. Negative MFV means volume-weighted selling pressure. The magnitude reflects both how strongly the close favored one side and how much volume participated.
Step 3: CMF (20-Period Average)
Sum the MFV over 20 periods and divide by the sum of volume over the same 20 periods:
CMF(20) = Sum(MFV, 20) / Sum(Volume, 20)
Here's a simplified 5-period example to illustrate the process:
| Period | High | Low | Close | CLV | Volume | MFV |
|---|---|---|---|---|---|---|
| 1 | 1.0920 | 1.0880 | 1.0912 | +0.60 | 14,500 | +8,700 |
| 2 | 1.0935 | 1.0905 | 1.0910 | -0.67 | 11,200 | -7,504 |
| 3 | 1.0925 | 1.0890 | 1.0920 | +0.71 | 16,800 | +11,928 |
| 4 | 1.0940 | 1.0915 | 1.0918 | -0.76 | 9,300 | -7,068 |
| 5 | 1.0930 | 1.0900 | 1.0928 | +0.87 | 18,200 | +15,834 |
| Totals | 70,000 | +21,890 |
CMF(5) = 21,890 / 70,000 = +0.313
That +0.313 reading tells you buying pressure has dominated over the last 5 periods. In a real 20-period calculation, the smoothing is more substantial, but the process is identical — just with more rows in the table.
Interpreting the CMF Scale
While CMF technically ranges from -1 to +1, hitting those extremes would require 20 consecutive closes at the absolute high or absolute low of each bar — essentially impossible in practice. Real-world CMF readings almost always stay between -0.50 and +0.50. Here's what the ranges mean:
| CMF Range | Interpretation | Typical Market Condition |
|---|---|---|
| +0.25 to +0.50 | Strong buying pressure | Healthy uptrend with institutional accumulation |
| +0.05 to +0.25 | Moderate buying pressure | Mild bullish bias, possible uptrend forming |
| -0.05 to +0.05 | Neutral / indecision | Consolidation, range-bound market |
| -0.25 to -0.05 | Moderate selling pressure | Mild bearish bias, possible downtrend forming |
| -0.50 to -0.25 | Strong selling pressure | Active distribution, sustained downtrend |
The 20-period default: why 20? Chaikin chose 20 periods because it represents approximately one trading month on a daily chart (roughly 21-22 trading days). This captures a full cycle of institutional activity — long enough to filter out daily noise, short enough to remain responsive to genuine shifts in accumulation or distribution. On H4 charts, 20 periods covers about 80 hours (roughly two trading weeks), and on H1, just 20 hours. Some traders adjust the period down to 10 for faster signals on intraday charts or up to 40 for longer-term trend analysis on daily charts. Shorter periods make CMF more sensitive but also noisier — the eternal tradeoff.
One edge case worth knowing: when a bar has no range (High = Low, a doji), the CLV formula divides by zero. Most platforms handle this by setting CLV to 0 for that bar, which effectively removes it from the calculation. This rarely matters in practice since pure dojis with zero range are uncommon on liquid instruments.

When CMF smooths out the noise and shows you the real money flow direction.
“If you had to reduce CMF to one rule — one sentence you could tape to your monitor — it would be this: CMF above zero means buyers are winning; CMF below zero means sellers are winning.”
3CMF Above Zero vs Below Zero: The Simplest Trend Confirmation
If you had to reduce CMF to one rule — one sentence you could tape to your monitor — it would be this: CMF above zero means buyers are winning; CMF below zero means sellers are winning. That's it. That's the foundation everything else builds on.
The zero line is CMF's most important reference level. It divides the indicator into two zones: positive territory (accumulation, buying pressure dominates) and negative territory (distribution, selling pressure dominates). When CMF crosses from negative to positive, the balance of power shifts to buyers. When it crosses from positive to negative, sellers take control. This is conceptually simple but practically powerful because it tells you whether volume is confirming or contradicting the price trend.
Zero-Line Crossover Strategy
The most basic CMF trading approach uses zero-line crosses as a trend filter:
- Bullish signal: CMF crosses above zero. Consider long positions only. Avoid shorts.
- Bearish signal: CMF crosses below zero. Consider short positions only. Avoid longs.
- Confirmation: The signal is stronger when price is also breaking above resistance (for bullish) or below support (for bearish) at the time of the crossover.
Let's walk through a real-world scenario. GBP/USD on the H4 chart enters a downtrend in early Q1, falling from 1.2750 toward 1.2550. During this decline, CMF(20) stays persistently below zero — reading between -0.10 and -0.30 for most of the move. This confirms that volume is supporting the decline. Sellers are closing bars near the low of each candle's range, and they're doing it on above-average volume. If you're short during this period, CMF validates your position.
Then, near 1.2550, something changes. Price makes one more push lower to 1.2530, but CMF starts rising toward zero. It crosses the zero line while price is still below its 50-period moving average. This is your first clue that the selling pressure is exhausting. Two sessions later, price breaks above 1.2580 with CMF reading +0.12. The buyers have taken over.
Sustained Readings: The Real Power of CMF
Single zero-line crosses are useful, but CMF's real strength shows in sustained readings. A brief dip below zero during an uptrend is normal — markets pull back, and that's healthy. What matters is whether CMF recovers quickly or stays negative.
| CMF Behavior During Uptrend | Interpretation | Action |
|---|---|---|
| CMF stays above zero throughout pullbacks | Very strong trend — buyers absorb every dip | Hold longs, add on pullbacks |
| CMF dips briefly below zero, recovers within 3-5 bars | Normal retracement, trend intact | Hold longs, tighten stops slightly |
| CMF drops below zero and stays for 10+ bars | Trend weakening, distribution beginning | Take partial profits, move stops to breakeven |
| CMF drops below -0.15 during uptrend | Serious selling pressure emerging | Consider exiting longs entirely |
This framework works beautifully on USD/JPY daily charts, where trends tend to be persistent. During the multi-month yen weakening trends of recent years, CMF on the D1 chart stayed above zero for weeks at a time, with only brief dips below zero during consolidation phases. Traders who used "CMF above zero" as their hold filter would have captured the majority of the trend move while avoiding the chop.
Combining CMF Zero-Line with Moving Averages
Here's a setup that experienced traders use on H1 and H4 charts:
- Apply a 50-period EMA to price.
- Apply CMF(20) in the indicator window.
- Long entry: Price crosses above the 50 EMA AND CMF is above zero. Both conditions must be true.
- Short entry: Price crosses below the 50 EMA AND CMF is below zero.
- Exit: When CMF crosses back through zero against your position.
The logic: the moving average tells you the trend direction, and CMF confirms that volume supports it. This double filter eliminates a significant number of false signals that either tool would produce alone. If price breaks above the 50 EMA but CMF is still negative, it means volume hasn't confirmed the breakout — and unconfirmed breakouts fail at a much higher rate.
On EUR/USD H4, this combination performs particularly well during trending weeks. During range-bound markets (think mid-summer low-volatility periods), both the EMA and CMF will whipsaw around their respective zero/crossover levels. No indicator cures choppy markets — but at least the double filter keeps you from taking the worst signals during those periods.
What CMF Zero-Line Signals Can't Do
A zero-line cross doesn't tell you how far price will move. CMF crossing to +0.05 could precede a 300-pip rally or a 30-pip fizzle. The indicator measures the current balance of buying vs. selling pressure — it doesn't predict magnitude. For target-setting, you'll need price structure (support/resistance levels, Fibonacci extensions) or a separate momentum indicator.
Also, CMF zero-line crosses tend to lag slightly. Because CMF averages 20 periods of data, it takes several bars of consistent buying or selling to push the indicator through zero. By the time CMF crosses above zero, the initial move has already started. This is the nature of all lookback-based indicators — they confirm rather than predict. If you want faster signals, reduce the period to 10, but accept more noise and more false crosses in exchange.
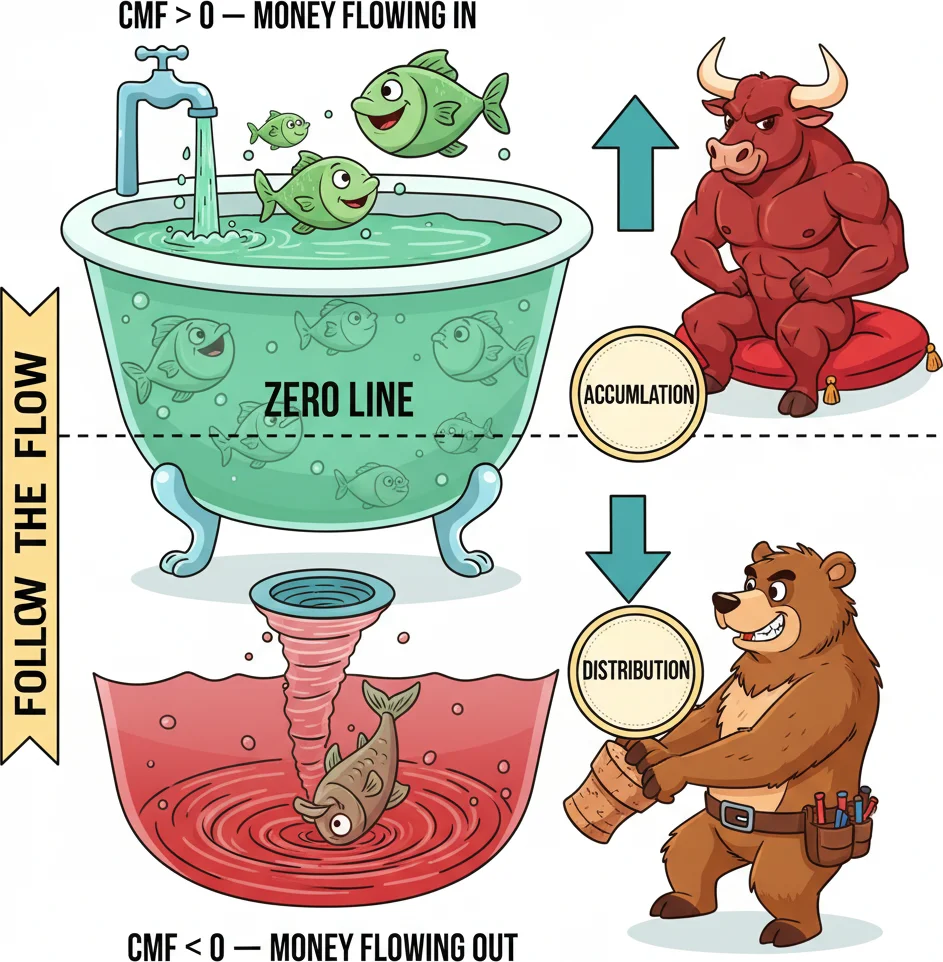
CMF above zero means money is flowing IN. Below zero means money is flowing OUT. It really is that simple.
4CMF Divergence: When Money Flow Contradicts Price
If zero-line analysis is CMF's bread and butter, divergence is the steak dinner. CMF divergence occurs when price and the indicator move in opposite directions — and when they disagree, the volume story usually has the final word.
Bullish CMF Divergence
This forms when price makes a lower low but CMF makes a higher low. Translation: price went lower, but it took less selling volume (relative to bar position) to get there. The sellers are running out of ammunition.
Picture AUD/USD on the H4 chart. Price drops from 0.6650 to 0.6580, forming Swing Low #1. CMF drops to -0.22 — solid selling pressure. Price bounces to 0.6620, then drops again to 0.6555 — a lower low on the price chart. But this time, CMF only reaches -0.14. The selling pressure at this new low is weaker than it was at the previous low, even though price went further down. That's bullish divergence.
Now here's the part that separates profitable traders from frustrated ones: divergence is a warning, not an entry signal. The fact that CMF diverges doesn't mean you slap a buy order in immediately. You need a trigger.
Effective triggers after bullish CMF divergence:
- CMF crossing back above zero (confirms buyers have actually taken control)
- Price breaking above the swing high between the two lows
- A bullish engulfing candle or pin bar at the second low
- The 20 EMA turning upward after being flat or declining
Bearish CMF Divergence
The mirror image: price makes a higher high but CMF makes a lower high. The rally is running on fumes — price is pushing higher but with declining volume conviction.
A classic example on USD/CAD D1: price rallies from 1.3450 to 1.3580, with CMF peaking at +0.28. Price pulls back to 1.3520, then pushes to a new high at 1.3610. But CMF at this second peak only reaches +0.18. The buying pressure behind the new high is weaker than behind the first one. The pair subsequently reversed from 1.3610 and dropped over 200 pips in the following two weeks.
| Divergence Type | Price Action | CMF Action | What It Means | Best Trigger |
|---|---|---|---|---|
| Bullish regular | Lower low | Higher low | Selling pressure fading | CMF crosses above zero |
| Bearish regular | Higher high | Lower high | Buying pressure fading | CMF crosses below zero |
| Hidden bullish | Higher low (pullback) | Lower low | Weak-hand shakeout in uptrend | Price bounces from support |
| Hidden bearish | Lower high (rally) | Higher high | Dead-cat bounce in downtrend | Price rejects from resistance |
Hidden Divergence: The Continuation Signal
Hidden divergence confuses many traders because it looks backwards at first glance. During an uptrend, hidden bullish divergence forms when price makes a higher low (a healthy pullback) but CMF makes a lower low. It seems bearish — CMF dipped further than before — but the context matters. The pullback shook out weak hands and stopped out impatient longs. But the trend's underlying structure (higher lows on price) remains intact, and once the shakeout ends, the uptrend resumes with fewer passengers and more room to run.
On GBP/JPY H1 during trending days, hidden bullish divergence appears frequently after London-session pullbacks. Price dips to a higher low from the Asian high, CMF briefly dips below its previous low reading, and then both price and CMF resume their upward trajectory. Traders who recognize this pattern can use the pullback as a re-entry point rather than a reason to panic.
Multi-Timeframe Divergence: The High-Conviction Setup
The single most reliable CMF divergence setup combines two timeframes:
- Identify divergence on the higher timeframe (D1 or H4). This establishes the directional bias.
- Drop to the lower timeframe (H1 or M30) for entry timing.
- Wait for the lower timeframe to show a confirming signal — a zero-line cross, a moving average cross, or a price structure break in the direction suggested by the higher-timeframe divergence.
For example: EUR/JPY D1 shows bearish divergence — price made a higher high at 164.50 while CMF made a lower high. You switch to H1 and wait for CMF to cross below zero combined with price breaking below the most recent H1 swing low. This multi-timeframe approach filters out the noise that plagues single-timeframe divergence signals.
The Patience Problem
Here's the uncomfortable truth about divergence: it's often early. CMF can diverge from price for 5, 10, even 15 bars before the reversal actually happens — if it happens at all. Selling pressure can be "fading" for two weeks while price grinds another 100 pips higher. During strong trends, divergence can appear and resolve without any reversal, as new volume enters and re-energizes the move.
This is why rigid rules help. If you spot divergence but the trigger never fires (CMF never crosses zero, price never breaks structure), you simply don't trade. Divergence without confirmation is information, not instruction. File it away as context — it tells you the trend is aging — but don't act until the market gives you a concrete entry signal.

Price goes up, CMF goes down - divergence signals the smart money's real intentions.
“If you've spent any time looking at volume indicators, you've probably wondered: why are there three (or more) tools that all claim to measure money f...”
5CMF vs OBV vs MFI: Three Volume Indicators Compared
If you've spent any time looking at volume indicators, you've probably wondered: why are there three (or more) tools that all claim to measure money flow? What's the actual difference between CMF, On Balance Volume, and the Money Flow Index — and which one should you use?
The honest answer: they measure related but different things, and understanding the distinction matters more than picking a "winner."
How Each One Thinks About Volume
OBV (On Balance Volume) is the grandfather of the group. Created by Joe Granville in 1963, it asks one binary question per bar: did price close up or down? If up, add the entire bar's volume. If down, subtract it. That's it. OBV doesn't care whether the close was 0.1 pips above the previous close or 100 pips above — it adds the full volume either way. This makes OBV simple and effective as a trend-confirmation tool, but it's a blunt instrument. A bar that closes 1 pip higher after a massive selloff gets the same bullish treatment as a bar that rockets 80 pips higher.
CMF (Chaikin Money Flow) fixes that bluntness by looking at where price closes within each bar's range. A close near the high contributes positive money flow; a close near the low contributes negative money flow. The weighting is proportional — a close at the 80% mark of the range contributes more positive flow than a close at the 55% mark. CMF then averages this over 20 periods, producing a bounded oscillator.
MFI (Money Flow Index) takes yet another approach. It calculates a "typical price" for each bar (High + Low + Close / 3), multiplies it by volume, and then applies an RSI-style formula to produce a bounded oscillator from 0 to 100. MFI is essentially RSI with a volume component bolted on, which means it has built-in overbought (80) and oversold (20) levels that neither OBV nor CMF provide.
| Feature | OBV | CMF | MFI |
|---|---|---|---|
| Created by | Joe Granville (1963) | Marc Chaikin (1980s) | Gene Quong & Avrum Soudack (1989) |
| Scale | Unbounded (cumulative) | -1 to +1 | 0 to 100 |
| Default period | None (running total) | 20 | 14 |
| Close position within bar | Ignored | Core of calculation | Not directly used |
| Overbought/Oversold levels | No | No | Yes (80/20) |
| Best signal type | Divergence, trendline breaks on OBV | Zero-line crosses, sustained readings | Overbought/oversold extremes |
| Responds to | Close-to-close direction | Intrabar close position × volume | Typical price momentum × volume |
| Forex tick volume reliability | Moderate (noisy below H4) | Good on H1+ | Good on H1+ |
When to Use Each One
Use OBV when you want a long-term cumulative picture. OBV excels at showing whether an asset has been under net accumulation or distribution over weeks and months. Because it's a running total with no period setting, it captures the entire history of volume flow. It's the best of the three for drawing trendlines directly on the indicator and spotting breakouts in the OBV line before they appear in price. If you trade D1 or W1 charts and hold positions for weeks, OBV's cumulative nature works in your favor.
Use CMF when you want a current-state snapshot. CMF's 20-period averaging means it reflects recent money flow, not historical totals. When you need to know whether buying or selling pressure is dominant right now — this week, this session — CMF gives a cleaner answer than OBV. It's particularly useful as a breakout confirmation tool: a price breakout above resistance with CMF above +0.20 has volume conviction; a breakout with CMF near zero does not. For H1 to D1 swing trading, CMF is arguably the most practical of the three.
Use MFI when you want overbought/oversold signals with volume backing. If you already use RSI and wish it accounted for volume, MFI is your indicator. It's the only one of the three that tells you when buying or selling has become statistically extreme (above 80 or below 20). This makes MFI uniquely useful for mean-reversion strategies and for timing entries during pullbacks in trends. MFI reading below 20 during an overall uptrend? That's a volume-confirmed oversold dip — potentially a great re-entry point.
Can You Use Them Together?
Absolutely — and many professional traders do. A practical combination:
- OBV on D1 for the big picture: is the asset under long-term accumulation or distribution?
- CMF on H4 for the current state: is money flowing in or out over the past ~80 hours?
- MFI on H1 for entry timing: has the pullback reached an oversold extreme?
When all three agree — OBV trending up, CMF above zero, MFI bouncing from oversold — you have a multi-layered volume confirmation that single-indicator traders simply don't have. When they disagree (OBV rising but CMF below zero), it flags a conflict worth investigating before entering a position.
| Scenario | OBV | CMF | MFI | Interpretation |
|---|---|---|---|---|
| Strong trend | Rising | Above +0.15 | Between 50-80 | Full volume confirmation — trend is healthy |
| Exhaustion near top | Still rising (lagging) | Declining from peak | Above 80 | CMF and MFI warn before OBV catches up |
| Healthy pullback in uptrend | Flat or slight dip | Dips toward zero | Below 30 | MFI oversold = potential re-entry |
| Trend reversal forming | Breaks OBV trendline | Crosses below zero | Drops below 20 | All three confirm — serious shift underway |
The bottom line: you don't need to pick one and abandon the others. Each sees volume through a slightly different lens. OBV is the historian, CMF is the journalist reporting on current events, and MFI is the doctor checking vital signs. Together, they give you a much more complete picture of what the volume is actually telling you than any single indicator could provide on its own. If forced to choose just one for general-purpose trading on H1 to D1 timeframes — which, let's be honest, covers most retail traders — CMF offers the best balance of responsiveness, readability, and signal clarity.
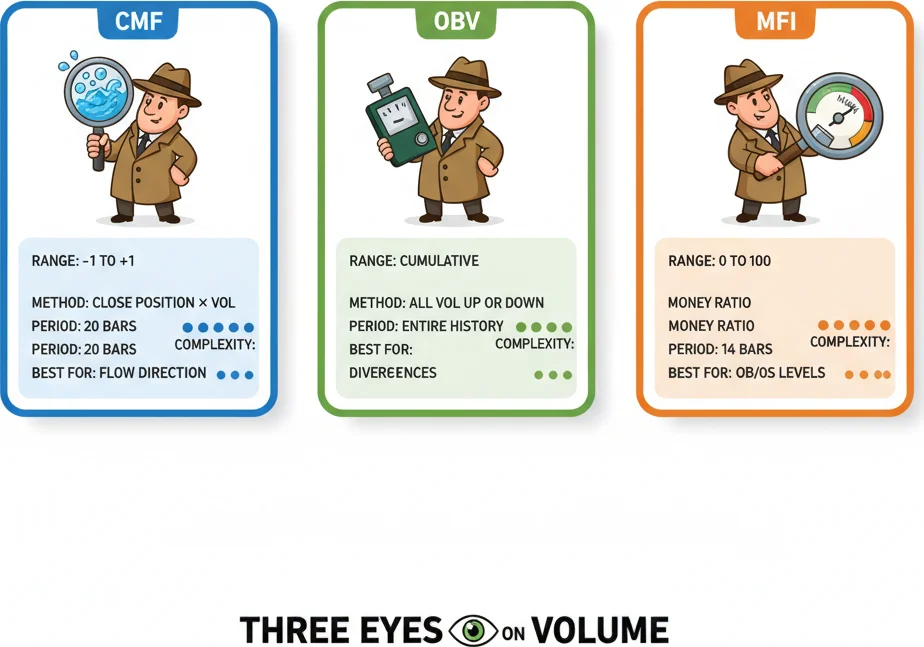
CMF, OBV, and MFI all track volume — but each has its own math, its own strengths, and its own blind spots.
Frequently Asked Questions
Q1What does a CMF reading of +0.25 or higher actually mean?
A CMF reading of +0.25 or above indicates strong, sustained buying pressure over the past 20 periods. It means that, on average, price has been closing in the upper quarter of each bar's high-low range and doing so on meaningful volume. This level is widely cited as the threshold for genuine institutional accumulation. It doesn't guarantee further price gains — nothing does — but it tells you that volume is actively supporting the upward move rather than contradicting it.
Q2Does CMF work on forex pairs since there's no centralized volume?
CMF works on forex pairs using tick volume (the number of price changes per period) as a proxy for real volume. Research shows tick volume correlates with actual institutional forex volume at roughly 90% on major pairs during active sessions. CMF signals are most reliable on EUR/USD, GBP/USD, and USD/JPY during the London and New York sessions. On exotic pairs or during the quiet Asian session, tick volume becomes a weaker proxy. For the strongest forex CMF signals, use H1 or higher timeframes where tick aggregation smooths out broker-specific noise.
Q3Should I change the default 20-period CMF setting?
The 20-period default works well on daily charts, covering roughly one trading month. On H4 charts, some traders prefer 14 periods for faster responsiveness. On H1 charts, consider extending to 24-28 periods to cover a full trading day and reduce intraday noise. Avoid going below 10 periods on any timeframe — at that point, CMF starts behaving like a simple momentum oscillator and loses its volume-weighting advantage. If you're unsure, stick with 20 — Chaikin chose it for a reason, and it remains the most widely tested setting across academic and practical trading research.
Q4How is CMF different from the Chaikin Oscillator?
Both were created by Marc Chaikin, but they measure different things. CMF averages the Close Location Value multiplied by volume over a fixed period (default 20), producing a bounded oscillator between -1 and +1. The Chaikin Oscillator applies a MACD-style calculation (3-period EMA minus 10-period EMA) to the Accumulation/Distribution Line, measuring the momentum of cumulative money flow rather than the current level. Think of CMF as answering 'is money flowing in or out right now?' while the Chaikin Oscillator answers 'is the rate of money flow accelerating or decelerating?'
Q5Can CMF divergence predict exact reversal points?
No — and treating it that way is a recipe for frustration. CMF divergence tells you that buying or selling pressure is weakening relative to price movement, but it doesn't tell you when the reversal will happen. Divergence can persist for 5, 10, or even 20 bars before price reverses, and sometimes it resolves without any reversal at all if fresh volume re-enters the market. Always pair divergence with a concrete entry trigger: a zero-line cross, a price structure break, or a candlestick pattern at a key support/resistance level. Divergence provides the context; the trigger provides the timing.
Top Brokers
About the Author
Daniel Harrington
Senior Trading Analyst
Daniel Harrington is a Senior Trading Analyst with a MScF (Master of Science in Finance) specializing in quantitative asset and risk management. With over 12 years of experience in forex and derivatives markets, he covers MT5 platform optimization, algorithmic trading strategies, and practical insights for retail traders.
Use This Indicator
Risk Disclaimer
Trading financial instruments carries significant risk and may not be suitable for all investors. Past performance does not guarantee future results. This content is for educational purposes only and should not be considered investment advice. Always conduct your own research before trading.