Chande Momentum Oscillator (CMO): Tushar Chande's Unbiased Momentum Measure
CMO measures momentum by calculating the difference between the sum of gains and losses over a period, normalized to oscillate between -100 and +100.

Daniel Harrington
Senior Trading Analyst · MT5 Specialist
☕ 19 min read
Settings — CMO
| Category | oscillator |
| Default Period | 14 |
| Best Timeframes | M15, H1, H4 |
Most retail traders meet the RSI on their first week of charting, fall in love with its 0-100 scale, and never question whether it might be lying to them. Tushar Chande did question it. In his 1994 book The New Technical Trader, co-authored with Stanley Kroll, Chande pointed out that the RSI only uses upward price changes in its numerator. Downward changes sit in the denominator, sure, but they never directly contribute to the signal. The result is a subtle upward bias baked into every RSI reading you have ever seen. Chande's fix was elegant: take the difference between the sum of gains and the sum of losses, divide by the total movement, and multiply by 100. The Chande Momentum Oscillator oscillates between -100 and +100, treats bulls and bears with equal mathematical weight, and applies zero internal smoothing. It is faster, more symmetrical, and more honest than its famous cousin. If you have ever felt that your RSI was lagging behind obvious momentum shifts or giving lukewarm readings in strong trends, the CMO might be the upgrade you did not know you needed.
Key Takeaways
- Before we touch the CMO formula, let's dissect the problem it was built to solve. The Relative Strength Index, created b...
- The CMO's bipolar scale is one of the first things traders notice, and it changes how you interpret momentum compared to...
- The standard overbought and oversold levels for the CMO are +50 and -50. These thresholds are not arbitrary — they corre...
1Tushar Chande's Fix: Why RSI Has a Hidden Bias
Before we touch the CMO formula, let's dissect the problem it was built to solve. The Relative Strength Index, created by J. Welles Wilder in 1978, calculates momentum using this formula: RSI = 100 - (100 / (1 + RS)), where RS equals the average gain divided by the average loss over N periods. Notice what happens in the numerator of RS: only upward price changes are counted. Downward changes appear only in the denominator. This asymmetry means the RSI inherently weights bullish momentum more heavily than bearish momentum in its internal math.
In practice, this manifests as a subtle upward skew. RSI readings tend to hover slightly above 50 during genuinely neutral markets, and the indicator reaches oversold territory (below 30) less frequently than it reaches overbought territory (above 70) on many instruments. If you have ever noticed that RSI seems to bounce off 40 more often than it drops to 30, you have observed this bias in action. It does not mean the RSI is broken — it has been the most popular oscillator for nearly five decades for good reason — but it does mean the signal is slightly tilted.
Tushar Chande's solution was to put both sides of the equation into the numerator. The CMO formula is:
CMO = 100 x (Sum of Gains - Sum of Losses) / (Sum of Gains + Sum of Losses)
Where gains are the sum of all positive close-to-close changes over the lookback period, and losses are the absolute value of all negative close-to-close changes. Both directions of price movement participate equally in both the numerator and denominator.
Let's walk through a concrete calculation. Suppose over the last 14 periods on EUR/USD H4, you count these close-to-close changes:
| Period | Change (pips) | Gain | Loss |
|---|---|---|---|
| 1 | +12 | 12 | 0 |
| 2 | -8 | 0 | 8 |
| 3 | +15 | 15 | 0 |
| 4 | +3 | 3 | 0 |
| 5 | -11 | 0 | 11 |
| 6 | -6 | 0 | 6 |
| 7 | +22 | 22 | 0 |
| 8 | +9 | 9 | 0 |
| 9 | -4 | 0 | 4 |
| 10 | +7 | 7 | 0 |
| 11 | -14 | 0 | 14 |
| 12 | +18 | 18 | 0 |
| 13 | -2 | 0 | 2 |
| 14 | +10 | 10 | 0 |
Sum of Gains = 96. Sum of Losses = 45. CMO = 100 x (96 - 45) / (96 + 45) = 100 x 51 / 141 = +36.17.
Now here is the critical difference: the RSI applied to the same data would compute RS = (96/14) / (45/14) = 2.133, giving RSI = 100 - (100 / 3.133) = 68.1. The RSI reading of 68 is approaching overbought. The CMO reading of +36 is nowhere near its +50 overbought threshold. Same data, different conclusion about how stretched the market is. The CMO gives a more tempered reading because it does not ignore the 45 pips of downward movement when assessing the numerator.
Another key architectural difference: the RSI uses Wilder's smoothing method, which is essentially an exponential moving average applied to both the gain and loss averages. This internal smoothing dampens short-term spikes and produces a gentler, more rounded indicator curve. The CMO uses no internal smoothing at all. It sums raw gains and raw losses over the lookback period and divides. Period. The result is a more volatile, more responsive line that reacts to momentum shifts faster than the RSI — sometimes by several bars on H1 and H4 charts.
This lack of smoothing is both the CMO's superpower and its Achilles' heel. On the superpower side, the CMO will flag a momentum reversal while the RSI is still digesting the move through its exponential averaging. You see sharp turns on the CMO that the RSI rounds into gentle curves. On the Achilles' heel side, the CMO generates more noise in choppy, range-bound markets. Those sharp turns cut both ways — some are legitimate early signals, and others are just the indicator overreacting to a couple of large candles.
Chande was aware of this tradeoff. In The New Technical Trader, he explicitly recommended applying a moving average overlay — typically 9 or 10 periods — to the CMO line to create a signal line, much like the MACD uses a signal line to smooth its histogram. The signal line approach gives you the best of both worlds: the CMO's unbiased formula plus a degree of noise reduction for cleaner crossover signals.
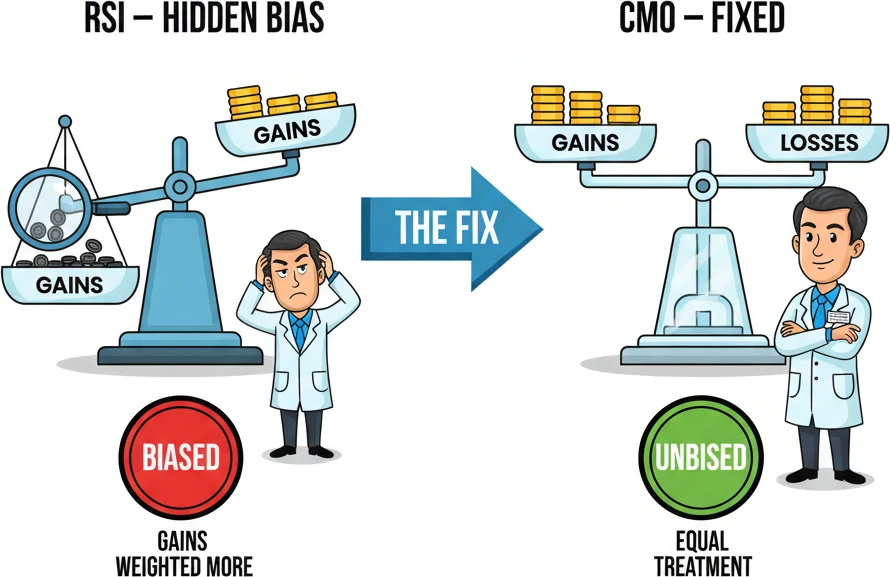
RSI has a dirty secret: its formula naturally drifts upward over time. Chande is CMO fixed that by treating ups and downs equally.
2CMO's -100 to +100 Scale: Reading True Momentum
The CMO's bipolar scale is one of the first things traders notice, and it changes how you interpret momentum compared to the RSI's 0-100 range. On the CMO, zero is the equilibrium point. Positive readings mean upward close-to-close changes have dominated the lookback window. Negative readings mean downward changes have dominated. The sign itself tells you the direction, and the magnitude tells you the strength.
A CMO reading of +80 means that out of all the price movement over the last 14 periods, gains dominated losses by a massive margin. Nearly every bar closed higher than the previous one, with minimal pullbacks. A reading of -80 means the exact opposite — relentless selling with almost no upward bounces. Readings near zero indicate that bulls and bears have fought to a draw over the lookback period. Total gains roughly equal total losses, producing net zero momentum.
| CMO Range | Interpretation | Market Context |
|---|---|---|
| +70 to +100 | Extremely strong bullish momentum | Parabolic move, potential blowoff top |
| +50 to +70 | Strong bullish momentum | Healthy uptrend, overbought zone starts |
| +20 to +50 | Moderate bullish momentum | Established uptrend, normal readings |
| -20 to +20 | Neutral / no clear momentum | Range-bound, consolidation |
| -50 to -20 | Moderate bearish momentum | Established downtrend, normal readings |
| -70 to -50 | Strong bearish momentum | Active downtrend, oversold zone starts |
| -100 to -70 | Extremely strong bearish momentum | Panic selling, potential capitulation |
The zero-line crossover is the CMO's most basic signal. When the indicator crosses from negative to positive territory, net momentum has shifted from bearish to bullish. When it crosses from positive to negative, the bears have taken control. This is conceptually identical to how you would read the MACD histogram crossing its zero line, except the CMO does it without any exponential moving average lag.
On GBP/USD H4 during a trending phase, zero-line crossovers can mark clean trend changes. In March 2024, the CMO (14) crossed above zero as price broke above the 1.2650 resistance level. The crossover confirmed that bullish momentum had genuinely shifted — not just a temporary bounce — and the pair subsequently climbed toward 1.2830 over the following week. The zero-line crossover acted as a momentum confirmation for the price breakout.
But here is where new CMO traders make their first mistake: trading every zero-line crossover as a signal. During ranging markets on H1 or lower timeframes, the CMO's lack of smoothing means it will whip across the zero line multiple times per session. EUR/GBP during London-New York overlap in a 30-pip range can produce five or six zero-line crosses in a single afternoon, none of them worth trading. The solution is the same as with any oscillator — use trend filters.
A 50-period EMA on the price chart works well as a directional filter. Only take bullish zero-line crossovers when price is above the 50 EMA. Only take bearish crossovers when price is below. This single rule eliminates the majority of whipsaw signals during consolidation phases. Some traders prefer using the ADX: only trade CMO zero-line crossovers when the ADX is above 20, confirming that a trend actually exists.
The CMO also provides a direct measure of trend strength through its absolute value. Regardless of whether the CMO is positive or negative, the further it sits from zero, the stronger the trend. A reading of +65 and a reading of -65 both indicate powerful directional momentum, just in opposite directions. When the CMO retreats toward zero from an extreme, it signals that the trend is losing steam — even if price has not yet reversed. This makes the CMO a leading indicator of trend exhaustion.
On USD/JPY D1, watching the CMO decline from +70 toward +30 while price continues to push higher is a classic early warning of bearish divergence forming. The trend still looks fine on the price chart, but the engine driving it is producing less and less force. Experienced CMO traders use this declining magnitude — even without a formal divergence signal — as a cue to tighten stop losses or reduce position sizes.
One practical trick: overlay a horizontal band between +20 and -20 on your CMO window. When the indicator is trapped inside this band, the market has no meaningful directional momentum over your lookback period. Save your trades for when the CMO breaks out of this neutral zone with conviction. This alone can keep you out of the frustrating chop trades that erode accounts during consolidation weeks.

RSI might be popular, but CMO's -100 to +100 scale gives you the full momentum picture.
“The standard overbought and oversold levels for the CMO are +50 and -50.”
3CMO Overbought/Oversold Signals: +50/-50 Thresholds
The standard overbought and oversold levels for the CMO are +50 and -50. These thresholds are not arbitrary — they correspond roughly to a market where gains outweigh losses by a 3:1 ratio (or vice versa) over the lookback period. When the CMO crosses above +50, the market has moved decisively upward and may be overextended. When it drops below -50, selling has been intense enough to suggest a bounce may be approaching.
Let's put numbers to this. If the Sum of Gains over 14 periods is 75 pips and the Sum of Losses is 25 pips, CMO = 100 x (75 - 25) / (75 + 25) = +50. So a +50 reading means exactly three-quarters of total price movement was upward. That is a lopsided ratio, and in most market environments, such one-sided movement tends to revert.
Here is a comparison of equivalent levels across popular oscillators:
| Condition | CMO | RSI | Stochastic |
|---|---|---|---|
| Strong Overbought | +70 | 80 | 90 |
| Overbought | +50 | 70 | 80 |
| Neutral | 0 | 50 | 50 |
| Oversold | -50 | 30 | 20 |
| Strong Oversold | -70 | 20 | 10 |
Trading overbought and oversold signals on the CMO follows the same logic as any oscillator, but the CMO's lack of internal smoothing makes these signals more frequent and more volatile. The indicator reaches +50 and -50 more often than the RSI reaches 70 and 30 because there is no averaging to dampen short-term momentum spikes. This is a feature for swing traders who want more entry opportunities, and a headache for those who prefer fewer, more filtered signals.
The classic mean-reversion trade using the CMO works like this: wait for the CMO to cross above +50, then sell when it crosses back below +50 heading toward zero. The logic is that the overextended momentum is unwinding. The reverse applies on the bearish side — buy when the CMO crosses back above -50 from below. This is a counter-trend approach and it works best in ranging or mildly trending markets.
On AUD/USD H4 during a three-month consolidation range between 0.6480 and 0.6620 in late 2023, the CMO (14) crossed above +50 four times and below -50 five times. Each overbought reading near the range top preceded a pullback toward the midpoint, and each oversold reading near the range bottom preceded a bounce. The signals were clean because the market context — a well-defined range — suited the mean-reversion approach.
But here is the trap that catches aggressive traders: the CMO can stay above +50 or below -50 for extended periods during strong trends. In a powerful uptrend like USD/JPY's rally from 140.00 to 152.00 in late 2023, the CMO spent weeks above +50, occasionally spiking to +70 or +80. Traders who sold every +50 reading expecting a reversal got steamrolled. The overbought condition was not a reversal signal — it was a confirmation that the trend had serious velocity.
The fix is combining overbought/oversold CMO readings with trend context:
In trending markets (ADX > 25): Use overbought/oversold only in the trend direction. In an uptrend, buy oversold readings (CMO crossing back above -50 or even -30 as a shallower pullback entry). Ignore overbought readings — they just confirm the trend is strong. In a downtrend, sell overbought readings and ignore oversold ones.
In ranging markets (ADX < 20): Use both overbought and oversold signals as mean-reversion entries. Sell when CMO drops back from above +50. Buy when CMO rises back from below -50.
Signal line crossovers at extremes offer another refinement. Apply a 9 or 10-period SMA to the CMO to create a signal line. When the CMO is above +50 and crosses below its signal line, that is a more precise sell trigger than simply watching the CMO cross below +50. The signal line smooths out minor fluctuations and gives you a cleaner reversal point. Tushar Chande himself recommended this approach in his original work — the raw CMO for reading momentum levels, the signal line crossover for timing entries.
A practical example: EUR/USD D1 in early January 2024. The CMO (14) climbed to +62 as the pair rallied from 1.0930 to 1.1005. The 9-period signal line lagged behind at +55. When the CMO dropped to +48 and crossed below the signal line, it marked the beginning of a pullback toward 1.0910. The crossover gave a cleaner exit signal than waiting for the CMO to reach zero.
Divergence at overbought/oversold levels adds a final layer of precision. When price makes a new high but the CMO makes a lower high above +50, bearish divergence at an overbought extreme is one of the highest-confidence reversal signals the CMO produces. Similarly, bullish divergence at oversold levels — price makes a new low, CMO makes a higher low below -50 — is a strong buy signal. These divergence-at-extreme setups combine two independent signals (directional weakening + overextension) into a single high-probability trade idea.
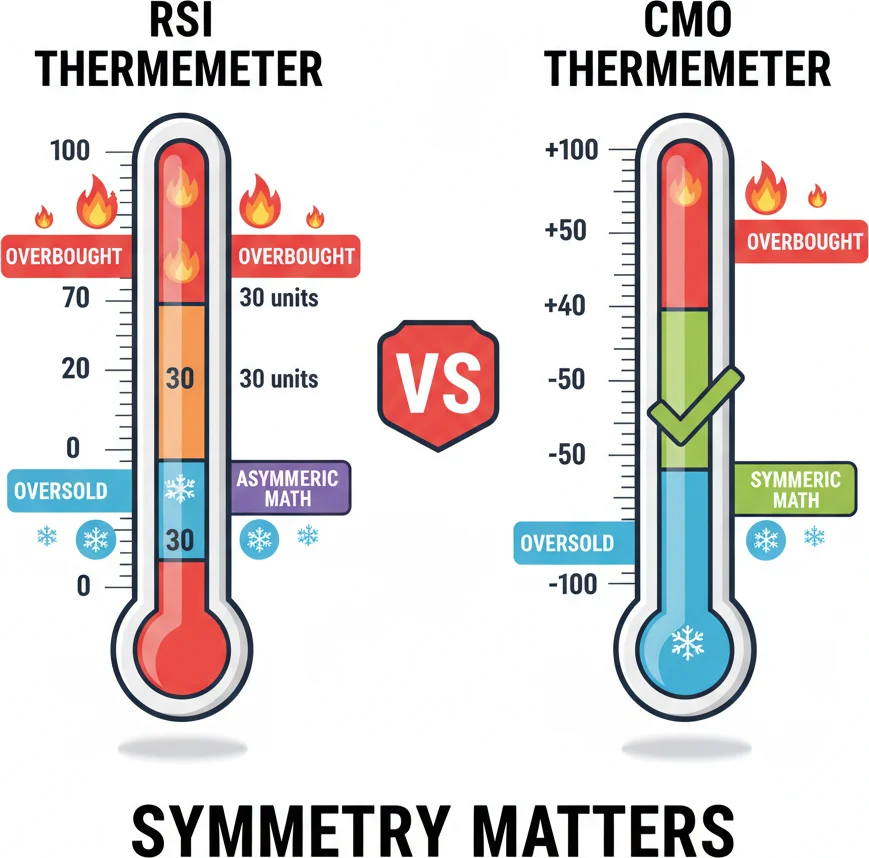
RSI uses 70/30. CMO uses +50/-50. Same concept, different calibration — and CMO is symmetrical.
4Using CMO as an Adaptive Period Selector (VidyA Connection)
Here is a side of the CMO that most retail traders never discover: Tushar Chande did not design it purely as a standalone oscillator. He also created it to serve as the volatility engine inside one of his other inventions — the Variable Index Dynamic Average, or VidyA. Understanding this connection transforms the CMO from a simple overbought/oversold tool into a building block for adaptive trading systems.
The problem VidyA was built to solve is one every trader has felt. Fixed-period moving averages are always wrong about something. A 20-period EMA responds quickly during trends but whipsaws during ranges. A 50-period EMA handles ranges better but lags painfully during fast moves. You cannot pick a period that works well in all market conditions because market conditions change constantly. Chande's insight was to make the period itself change with market conditions.
VidyA's formula looks like this: VidyA(i) = Price(i) x F x |CMO(i)| + VidyA(i-1) x (1 - F x |CMO(i)|), where F is the standard EMA smoothing factor (2 / (Period + 1)) and |CMO(i)| is the absolute value of the Chande Momentum Oscillator.
The absolute CMO value acts as a throttle. When momentum is strong — the CMO is near +80 or -80, meaning |CMO| is close to 0.80 — VidyA places heavy weight on the current price. The moving average hugs price tightly, responding almost immediately to new bars. It behaves like a very short-period EMA. When momentum is weak — the CMO hovers near zero, |CMO| is close to 0 — VidyA places almost no weight on new prices. The moving average flattens out and barely moves, behaving like a very long-period EMA.
| CMO Value | |CMO| | VidyA Behavior | Equivalent EMA Speed | |---|---|---|---| | +80 or -80 | 0.80 | Very responsive | ~5-period EMA | | +50 or -50 | 0.50 | Moderately responsive | ~12-period EMA | | +20 or -20 | 0.20 | Sluggish | ~30-period EMA | | Near 0 | ~0.05 | Nearly flat | ~100-period EMA |
The practical result is a moving average that tightens during trends and loosens during chop — exactly the behavior you want but cannot get from any fixed-period average. On EUR/USD H4, VidyA tracks price closely during directional moves, providing tight trailing stop levels, then goes flat during consolidation, keeping you from getting whipsawed by range-bound noise.
This design reveals the CMO's deeper purpose. Its value is not just about saying "overbought" or "oversold." The CMO quantifies how directional the market has been over the lookback period, expressed as a ratio between -1 and +1 (before the x100 scaling). That ratio is a direct measure of trending versus ranging behavior. When |CMO| is high, the market is strongly directional. When |CMO| is low, gains and losses are roughly equal, meaning the market is chopping sideways.
You can apply this insight even without using VidyA directly. Here is one practical approach that borrows the adaptive logic:
Adaptive period selection for any moving average. Calculate the 14-period CMO. When |CMO| is above 50 (strong trend), use a short EMA period (10-12) for your trend-following entries. When |CMO| is below 25 (range-bound), switch to a longer EMA period (30-50) to avoid whipsaws. When |CMO| is between 25 and 50, use your default period (20). You are manually doing what VidyA does automatically — adjusting your responsiveness to match the market's current character.
VidyA as a trend filter. Add VidyA (default period 14) to your price chart alongside a standard 20 EMA. During trending markets, VidyA will lead the standard EMA because it adapts faster. The gap between VidyA and the standard EMA acts as a visual measure of how adaptive the market demands your tools to be. When VidyA and the 20 EMA are nearly overlapping, the market is calm and trending steadily. When VidyA diverges sharply from the 20 EMA, momentum has spiked and you need to pay attention.
In MetaTrader 5, VidyA is available natively under Insert > Indicators > Trend > Variable Index Dynamic Average. The default settings use a CMO period of 9 and an EMA period of 12. You can experiment with longer CMO periods (14, 20) for smoother adaptation and shorter ones (7, 9) for faster response.
The VidyA connection also explains why the CMO uses no internal smoothing. Chande needed a raw, unfiltered momentum reading to drive the adaptive mechanism. If the CMO were internally smoothed like the RSI, VidyA's adaptation would lag — the smoothed CMO would take too long to register a momentum spike, and the moving average would miss the early phase of a new trend. The CMO's responsiveness is not a design flaw; it is a deliberate requirement for its role as a volatility sensor.
For traders who want to go deeper, the CMO-VidyA framework opens the door to building fully adaptive trading systems where every parameter — moving average periods, oscillator lookbacks, even stop-loss distances — adjusts in real-time based on measured market momentum. That is the rabbit hole Chande originally intended. The standalone oscillator signals are just the tip of the iceberg.

CMO doesn't just signal trades - it fine-tunes your VidyA periods for adaptive market conditions.
“Let's put the CMO and RSI head-to-head on the specifics that actually matter for trading decisions.”
5CMO vs RSI: The Unbiased Alternative
Let's put the CMO and RSI head-to-head on the specifics that actually matter for trading decisions. You already know the philosophical difference — the CMO treats gains and losses equally while the RSI weights gains more heavily in the numerator. But what does that look like in practice?
Scale and interpretation. The RSI oscillates between 0 and 100, centered at 50. The CMO oscillates between -100 and +100, centered at 0. A CMO reading of +50 is roughly equivalent to an RSI reading of 70. A CMO reading of -50 maps to an RSI of approximately 30. A CMO of 0 corresponds to an RSI of 50. The mapping is not perfectly linear, but for practical purposes these equivalences hold.
| Feature | CMO | RSI |
|---|---|---|
| Range | -100 to +100 | 0 to 100 |
| Center line | 0 | 50 |
| Overbought | +50 | 70 |
| Oversold | -50 | 30 |
| Internal smoothing | None | Wilder's exponential smoothing |
| Numerator | Gains minus Losses | Gains only |
| Denominator | Gains plus Losses | Gains plus Losses |
| Responsiveness | Faster | Slower |
| Noise level | Higher | Lower |
| Platform availability | Most platforms | All platforms |
| Default period | 14-20 | 14 |
Speed of signal generation. Because the CMO applies no internal smoothing, it reacts to momentum shifts approximately 1-3 bars faster than the RSI on most timeframes. On USD/CAD H4, when price begins a sharp selloff, the CMO will typically cross below zero (signaling bearish momentum) while the RSI is still above 50 and declining gradually. For traders who prioritize early entries and are willing to accept more false signals, this speed advantage is significant.
But that speed comes at a cost. The CMO's sharper movements mean more whipsaws during sideways markets. Where the RSI might gently oscillate between 45 and 55 during a consolidation — never triggering extreme readings — the CMO can swing between +30 and -30, crossing zero repeatedly and tempting traders into positions that go nowhere. The RSI's internal smoothing acts as a natural noise filter that the CMO deliberately lacks.
Divergence detection. Both indicators identify divergence, but the CMO often flags it earlier. When price makes a new high but momentum is fading, the CMO's raw calculation shows the weakening immediately. The RSI, smoothed by Wilder's averaging, may take an extra bar or two to confirm the lower high on the indicator. In fast-moving markets like GBP/JPY on H1, that one-bar difference can mean the difference between catching a reversal near the top and entering after the move has already started.
Which should you actually use? Here is a pragmatic framework:
Choose the CMO if you trade momentum-based strategies on H4 and D1, prefer early signals over clean signals, use the indicator primarily for trend strength measurement and divergence detection, or plan to build adaptive systems (VidyA, dynamic period selection). The CMO rewards traders who have additional confirmation tools in their arsenal to filter the noise.
Stick with the RSI if you trade on H1 or lower timeframes where noise is already a problem, use overbought/oversold levels as your primary signal, want a universally recognized indicator that every trading resource in existence covers, or prefer fewer but higher-confidence signals. The RSI's smoothing provides built-in noise reduction that is especially valuable on shorter timeframes.
Use both together if you want the ultimate momentum read. The RSI provides a smoothed, high-confidence picture of whether the market is overbought or oversold. The CMO provides raw, real-time momentum direction and strength. When both agree — RSI above 70 and CMO above +50 — you have maximum conviction about overbought conditions. When they disagree — RSI near 65 but CMO already declining toward +20 — the CMO is warning you that the RSI is about to roll over.
One more practical difference: period sensitivity. The RSI with a period of 14 and the CMO with a period of 14 do not produce the same readings because their formulas process the same data differently. If you are switching from the RSI to the CMO, do not assume your familiar period setting will produce equivalent behavior. You may need to test CMO periods of 14-20 to find one that generates signals at a frequency and reliability level you are comfortable with. Many practitioners of the CMO prefer a 20-period lookback for swing trading on D1, which produces smoother output while retaining the unbiased formula advantage.
Ultimately, the RSI is not wrong — it is just biased. And for most trading purposes, that bias is harmless. But if you value mathematical symmetry and want your momentum tool to treat buying and selling pressure as genuinely equal inputs, the CMO delivers what the RSI cannot. That is not a small thing. Especially in bear markets, where the RSI's upward bias can mask just how much selling pressure is actually building underneath a seemingly neutral reading.

Same data, different oscillators. CMO gives you the raw truth. RSI sugar-coats it with its averaging method.
Frequently Asked Questions
Q1What is the best CMO period setting for forex trading?
The default period of 14 works well for most forex setups on H1 and H4 charts. For swing trading on D1, many traders prefer a 20-period lookback, which was Chande's original suggestion and produces smoother readings while keeping the unbiased formula advantage. For faster intraday trading on M15 or M30, reduce the period to 9-12. If you add a signal line for crossover entries, a 9 or 10-period SMA of the CMO is the standard choice. The key principle: shorter periods increase signal frequency but also increase noise, so match the period to your trading timeframe and tolerance for false signals.
Q2Can the CMO replace the RSI entirely?
It can, but most traders find the two complement each other rather than compete. The CMO is faster and more responsive due to its lack of internal smoothing, which makes it better for early divergence detection and trend strength measurement. The RSI is smoother and more widely recognized, making it better for overbought/oversold threshold trading and for sharing analysis with other traders who understand the 0-100 scale. If you must pick one and you trade primarily on H4 or D1, the CMO offers a mathematical edge through its unbiased formula. On H1 or lower, the RSI's built-in smoothing may serve you better by reducing noise.
Q3How do I add a signal line to the CMO?
Apply a simple moving average (SMA) directly to the CMO output. The standard setting is a 9 or 10-period SMA. In MetaTrader 5, you can do this by opening the Navigator panel, dragging a Moving Average indicator onto the CMO sub-window, and selecting 'First Indicator's Data' in the 'Apply to' dropdown. Set the period to 9 or 10 and the method to Simple. The signal line crossover then works like MACD crossovers: a bullish signal when the CMO crosses above its signal line, and a bearish signal when it crosses below.
Q4Why does the CMO reach overbought and oversold levels more often than the RSI?
Two reasons. First, the CMO has no internal smoothing — it uses raw sums of gains and losses instead of the exponentially smoothed averages that the RSI employs. This means short-term momentum spikes show up in the CMO immediately, while the RSI dampens them through its averaging. Second, the CMO's overbought and oversold thresholds (+50 and -50) are mathematically closer to the center than the RSI's (70 and 30) in relative terms. The combination produces an indicator that oscillates more aggressively between extremes, which creates more frequent overbought/oversold signals but also more false signals in choppy markets.
Q5What is the relationship between the CMO and VidyA?
VidyA (Variable Index Dynamic Average) is an adaptive moving average that Tushar Chande created using the CMO as its core engine. The absolute value of the CMO controls how responsive VidyA is to new price data. When the CMO shows strong momentum (high absolute value), VidyA hugs price tightly like a short-period EMA. When the CMO shows weak or no momentum (near zero), VidyA flattens out like a long-period EMA. This makes VidyA an automatically adjusting moving average that speeds up during trends and slows down during ranges — solving the fixed-period problem that plagues standard moving averages.
Top Brokers
About the Author
Daniel Harrington
Senior Trading Analyst
Daniel Harrington is a Senior Trading Analyst with a MScF (Master of Science in Finance) specializing in quantitative asset and risk management. With over 12 years of experience in forex and derivatives markets, he covers MT5 platform optimization, algorithmic trading strategies, and practical insights for retail traders.
Use This Indicator
Risk Disclaimer
Trading financial instruments carries significant risk and may not be suitable for all investors. Past performance does not guarantee future results. This content is for educational purposes only and should not be considered investment advice. Always conduct your own research before trading.