Channel Indicator Guide: Ascending & Descending Patterns
Channel patterns consist of parallel trendlines containing price action, offering trading opportunities at channel boundaries and signaling breakouts when violated.

Daniel Harrington
Senior Trading Analyst · MT5 Specialist
☕ 8 min read
Settings — Channel
| Category | chart-pattern |
| Default Period | null |
| Best Timeframes | H1, H4, D1 |
Price rarely moves in a straight line — it oscillates between invisible rails that most traders ignore until it's too late. The Channel (Ascending/Descending) indicator draws those rails for you, identifying parallel trendlines that contain price action and flagging the moments when price breaks free. Miss those boundaries and you're trading noise; catch them and you have defined risk with a clear directional bias.
Key Takeaways
- The indicator uses a lookback period — defaulting to 50 bars — to identify swing highs and swing lows within that window...
- Counterintuitively, the strongest signals often come not from breakouts but from bounces. Price touching the lower rail ...
- The default 50-bar lookback works well on H4, but each timeframe has its own sweet spot. On H1, 50 bars covers about tw...
1How the Channel Indicator Works: The Math, Simplified
The indicator uses a lookback period — defaulting to 50 bars — to identify swing highs and swing lows within that window. It then fits two parallel trendlines: one connecting the most significant highs, another connecting the most significant lows. The slope of both lines must be roughly equal, which is what separates a true channel from a wedge or a triangle.
Ascending channels slope upward — higher highs, higher lows, bullish structure. Descending channels slope downward — lower highs, lower lows, bearish structure. The width between the lines is the channel's range, and that width tells you how much volatility to expect on each oscillation.
The math is geometric, not statistical. No standard deviations, no smoothing. This means the channel reacts to actual price pivots, not averaged noise. A 50-bar lookback on H4 covers roughly 200 hours of trading — enough to capture a meaningful intermediate trend without going so far back that the channel becomes irrelevant to current conditions.
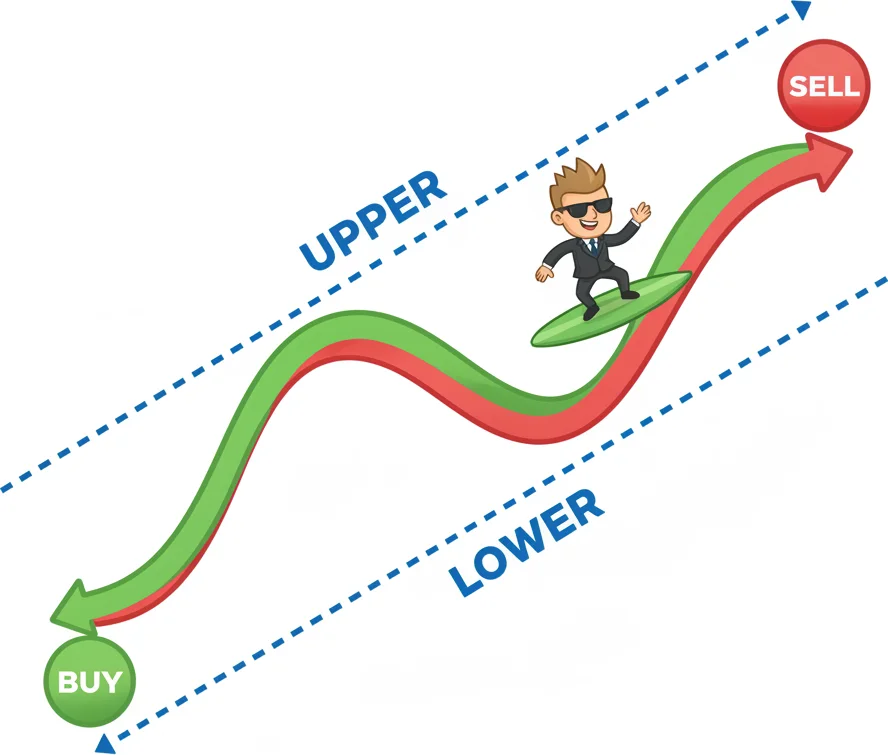
A channel is just two parallel lines acting as walls — price bounces between them until it breaks free.
2Signal Interpretation: Reading Buys, Sells, and Breakouts
Counterintuitively, the strongest signals often come not from breakouts but from bounces. Price touching the lower rail of an ascending channel is a buy signal — you're entering in the direction of the established trend at the cheapest available price within that structure. Price touching the upper rail of a descending channel is a sell signal for the same reason.
Here's how I structure those trades: entry at the channel boundary, stop loss 5-10 pips beyond the opposite side of the boundary bar, and take profit targeting the opposite rail. In a well-formed channel on EUR/USD with a width of 80 pips, that gives you a 1:3 or better risk-to-reward on a clean bounce.
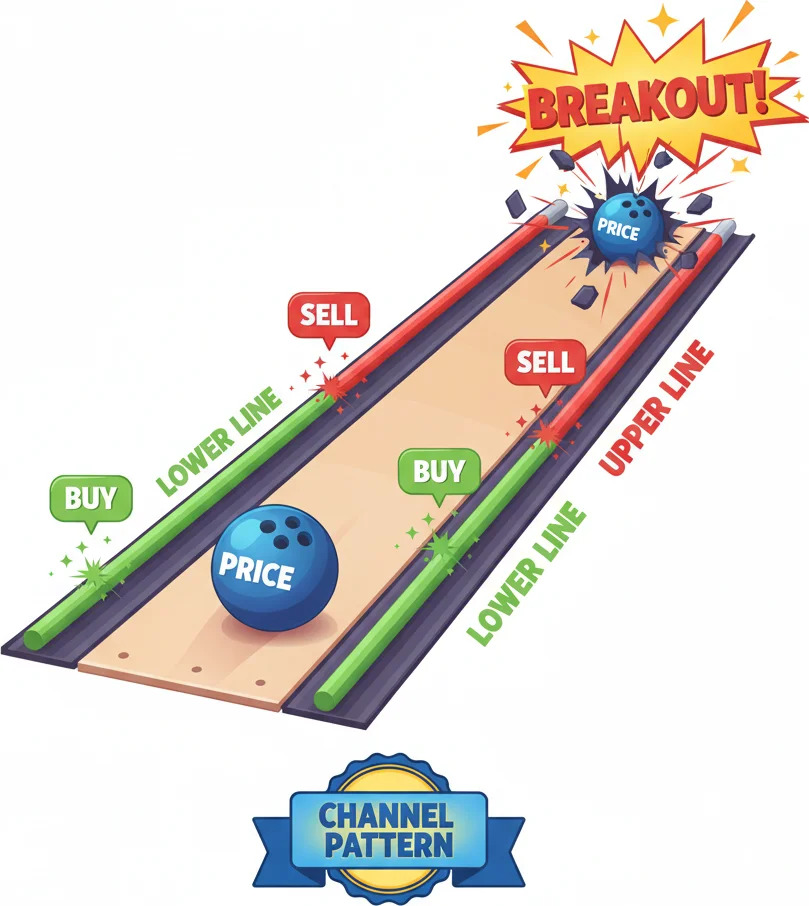
Breakouts tell a different story. A daily close outside the channel — not just a wick — signals a potential trend change. An ascending channel breakdown below the lower rail is bearish. A descending channel breakout above the upper rail is bullish. The key filter: volume should spike on breakout candles (check your broker's tick volume as a proxy). False breakouts that snap back inside the channel within 1-2 bars are common, especially on H1 — which is why confirmation matters more than speed.
Divergence setups are less obvious but highly effective. If price makes a new high within an ascending channel but momentum oscillators (RSI, MACD) fail to confirm, the channel top becomes a high-probability reversal zone rather than a continuation point.

When price breaks the channel and all your indicators finally agree it's time to trade.
“The default 50-bar lookback works well on H4, but each timeframe has its own sweet spot.”
3Optimal Channel Settings by Timeframe
The default 50-bar lookback works well on H4, but each timeframe has its own sweet spot.
On H1, 50 bars covers about two trading days. That's enough to catch intraday channels on active pairs like GBP/USD or USD/JPY, but be prepared for more frequent redraws as new pivots form. H1 channels are best used for entries after a higher-timeframe channel has already been identified.
H4 is the workhorse timeframe for this indicator. The 50-bar default spans roughly two weeks of trading — long enough to define a real trend, short enough to stay actionable. In my experience, H4 channels on EUR/USD and Gold (XAU/USD) produce the cleanest structure, particularly during the London-New York overlap.
D1 channels are where the big picture lives. A 50-bar lookback on daily charts goes back approximately 10 weeks, covering most intermediate trends. These channels move slowly and don't repaint often, making them ideal for swing traders holding positions for days or weeks. The trade-off is wider stops — a D1 channel on EUR/USD might span 150-200 pips, so position sizing needs to adjust accordingly.
For prop firm challenges, D1 channel boundaries are particularly useful for identifying where NOT to enter — approaching a channel top in a downtrend with a long position is how accounts blow up.
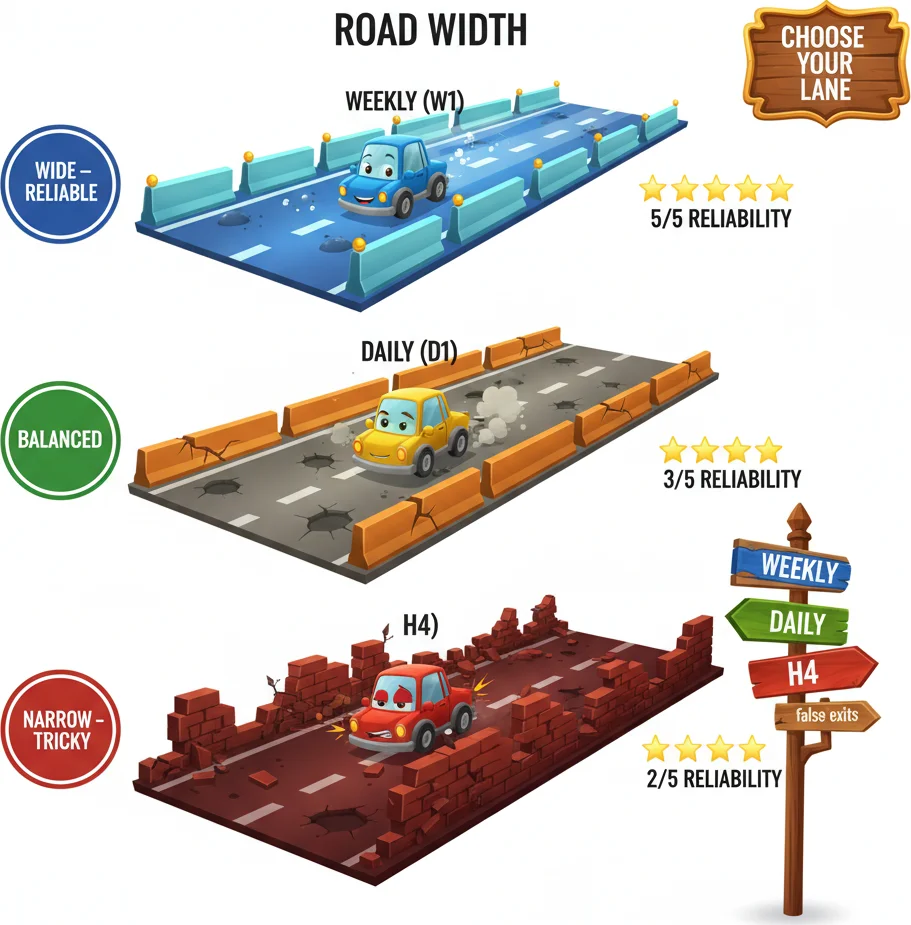
Channels on the weekly chart are like highways — wide and reliable. On H4 they are narrow alleys with more false breaks.
4Practical Application: A Real Channel Trade Setup
Consider EUR/USD in Q3 2023. The pair formed a clear descending channel on H4 between August and October, with the upper rail declining from approximately 1.1000 to 1.0650 and the lower rail from 1.0850 to 1.0500. Each touch of the upper rail produced a 60-80 pip drop back toward the lower rail — three clean short entries over eight weeks.
The setup each time: price rallied into the upper rail, formed a bearish engulfing or pin bar on H4 close, entry on the next open, stop 15 pips above the rail, target the lower rail. Average risk was 20 pips against an average reward of 65 pips. Not every trade hit target — the October 3rd setup only ran 40 pips before reversing — but the structure kept losses small and winners large.
The final touch of the upper rail in mid-October broke through and closed above it. That was the signal to stop shorting and reassess. The channel had been violated. Price subsequently rallied 200 pips over the following three weeks.
Pulsar Terminal makes this workflow practical in real time — once you identify a channel boundary on the chart, you can set multi-level SL/TP directly from the panel without switching screens, keeping your stop precisely calibrated to the channel width. The practical edge here is speed and precision: you're not manually calculating pip distances while price moves against you.

Channel trading requires zen patience - wait for the perfect touch, not every wiggle.
“Channels look clean and tidy on textbook charts.”
5Channel Failures and Breakout Traps: What Most Guides Won't Tell You
Channels look clean and tidy on textbook charts. Real markets are messier, and the failure modes are where most traders lose money with this pattern.
The most common trap is the false breakout — price pokes through a channel boundary, triggers entries, then snaps back inside. On H1 EUR/USD, false breakouts occur on roughly 35-40% of boundary tests. The culprit is usually a liquidity grab: large players push price beyond the rail to trigger stop orders and accumulate positions at better prices, then reverse. The defense is simple but requires discipline: never enter on the piercing candle itself. Wait for a full candle close outside the channel, then watch the next candle for confirmation. If the second candle re-enters the channel, the breakout was a trap.
Channel degradation is subtler and catches swing traders off guard. A channel that held perfectly for three weeks starts producing shallower bounces — price touches the lower rail but only rallies 60% of the way to the upper rail before falling back. This compression within the channel signals that the trend is weakening and a boundary break is approaching. When bounces off the lower rail of an ascending channel start falling short of the upper rail, the pattern is telling you that buyers are losing conviction even though the trendlines technically remain intact.
Another common misread: treating every parallel structure as a tradeable channel. Two touches on each rail is the minimum for structural validity. A 'channel' defined by one touch on the upper rail and two on the lower isn't a channel — it's a trendline with a parallel projection, which has no statistical edge. Genuine channels develop over time with multiple confirmed bounces, and each additional touch strengthens the pattern's reliability.
Finally, channel width matters for practical execution. Narrow channels — under 30 pips on EUR/USD H4 — leave almost no room for stops and targets after spread costs. If the channel width is less than 3x your average spread, the risk-reward math doesn't work regardless of how clean the pattern looks. Wide channels (100+ pips on H4) offer the most tradeable structure because the boundary-to-boundary moves provide real profit potential relative to the stop required.
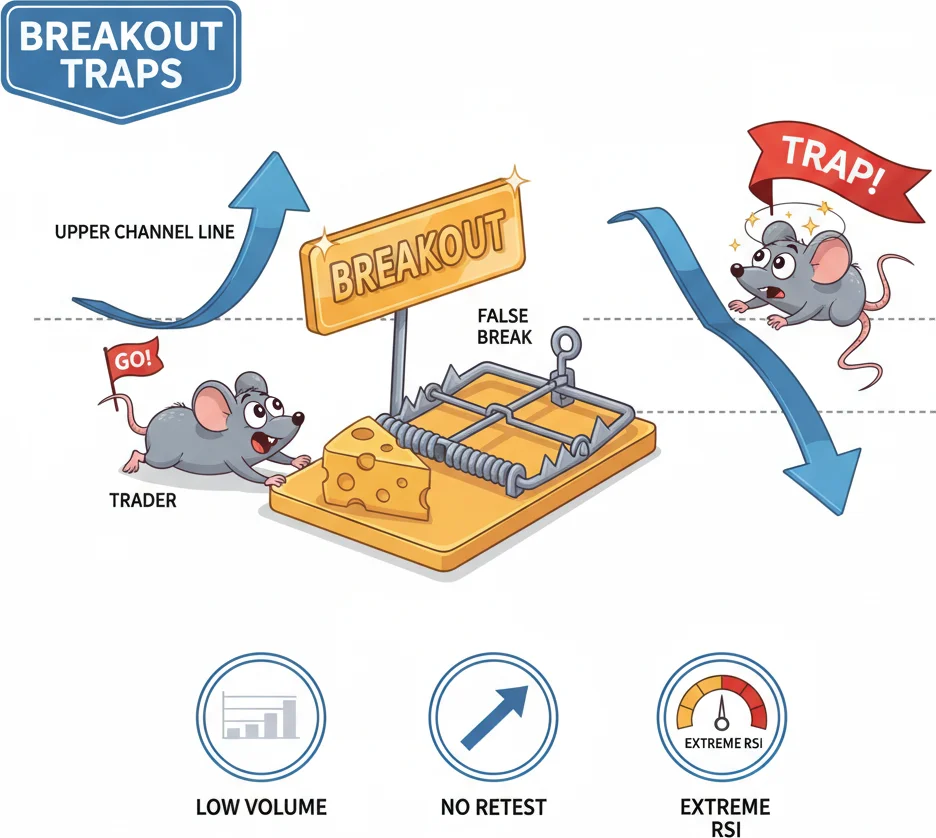
The breakout looked real, the volume was there, and then — snap — price slammed right back inside the channel.
Frequently Asked Questions
Q1How many touches does a channel need to be valid?
A minimum of two touches on each boundary — four total contact points — is required for structural validity. One touch on the upper rail and two on the lower gives you a trendline with a parallel projection, not a confirmed channel. Each additional touch beyond four strengthens the pattern because it demonstrates that the market is repeatedly respecting those levels. Three touches on each side (six total) is considered a high-confidence channel by most technical analysts.
Q2What is the difference between a channel and a wedge pattern?
The key difference is the relationship between the trendlines. In a channel, the two boundaries are parallel — they maintain a constant distance. In a wedge, the boundaries converge, narrowing the price range over time. Channels signal trend continuation (price oscillates within a stable corridor), while wedges signal exhaustion and potential reversal (price compresses until one side gives way). A rising channel is bullish; a rising wedge is bearish. This distinction is critical because the trading approaches are completely different.
Q3Should you trade bounces inside the channel or wait for a breakout?
Both approaches work, but they serve different purposes. Boundary-bounce trades (buying at the lower rail, selling at the upper rail) are mean-reversion setups within an established trend — they offer more frequent entries with smaller, predictable targets. Breakout trades are trend-change signals — less frequent but potentially much larger moves. Most experienced traders focus on bounces in the direction of the channel's slope (buying lower-rail bounces in ascending channels) and only trade breakouts that occur against the channel's direction, since these signal genuine trend reversals rather than temporary overextensions.
Q4What does it mean when the channel starts narrowing?
When bounces within the channel become progressively shallower — price touches the lower rail but only rallies halfway to the upper rail before turning back down — the channel is degrading. This compression signals that the dominant side (buyers in an ascending channel) is losing conviction. A channel breakdown typically follows within 5-10 bars of the first noticeably shallow bounce. Recognizing this early lets you tighten stops on existing positions or prepare for a breakout trade in the opposite direction.
Q5Does the channel indicator work on forex pairs with tick volume?
The channel pattern itself is purely geometric — it's based on price structure, not volume, so it works equally well on forex, futures, stocks, or any instrument with a price chart. Volume serves as an optional confirmation layer: declining volume on boundary bounces suggests a weakening channel, while expanding volume on a boundary break confirms the breakout. On forex where only tick volume is available, the same principle applies — tick volume correlates roughly 90% with real volume on major pairs during active sessions, which is sufficient for confirming channel breakouts.
Top Brokers
About the Author
Daniel Harrington
Senior Trading Analyst
Daniel Harrington is a Senior Trading Analyst with a MScF (Master of Science in Finance) specializing in quantitative asset and risk management. With over 12 years of experience in forex and derivatives markets, he covers MT5 platform optimization, algorithmic trading strategies, and practical insights for retail traders.
Use This Indicator
Risk Disclaimer
Trading financial instruments carries significant risk and may not be suitable for all investors. Past performance does not guarantee future results. This content is for educational purposes only and should not be considered investment advice. Always conduct your own research before trading.