Ease of Movement (EMV) Indicator: Richard Arms' Volume-Distance Relationship Tool
EMV relates the price change to volume, showing how easily price moves by measuring the ratio of distance moved to volume, revealing the effort behind price changes.

Daniel Harrington
Senior Trading Analyst · MT5 Specialist
☕ 21 min read
Settings — EMV
| Category | volume |
| Default Period | 14 |
| Best Timeframes | H1, H4, D1 |
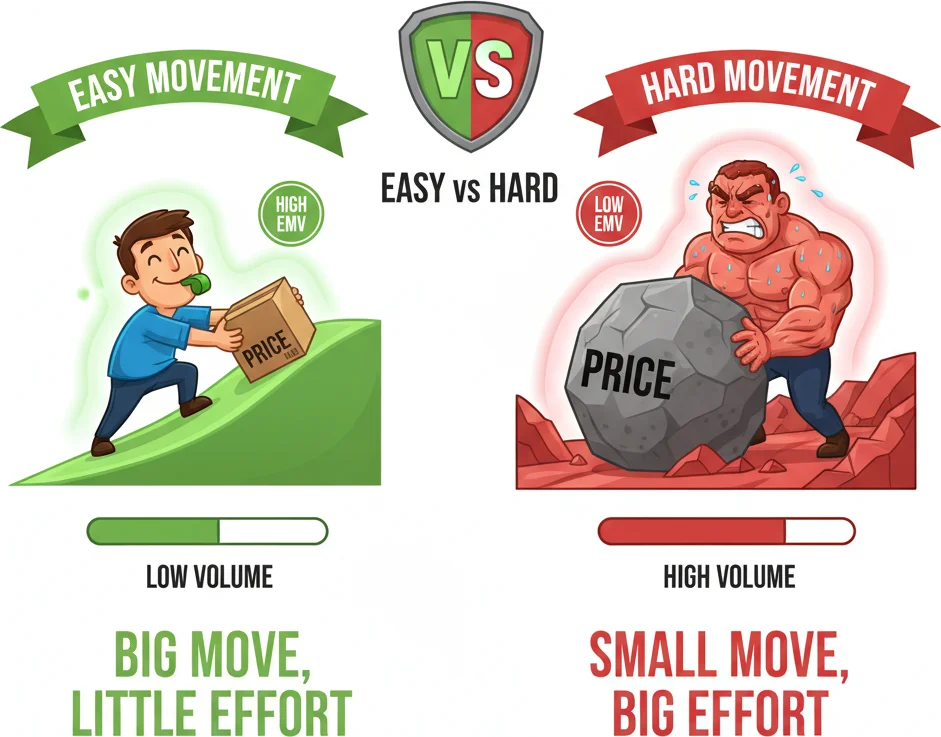
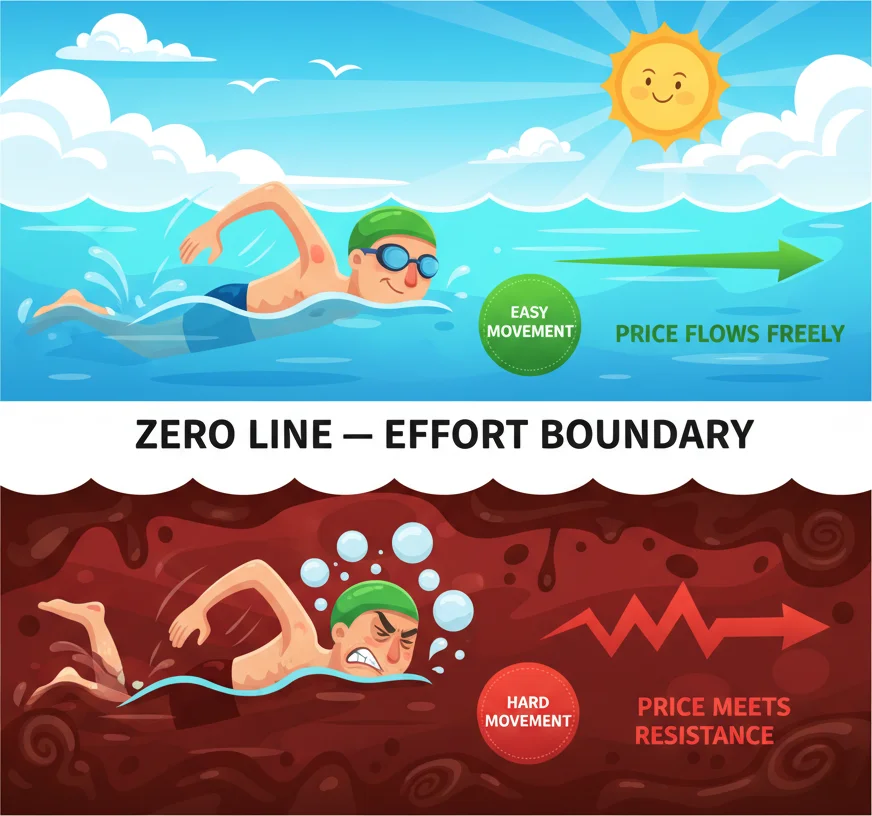
Here's a question most traders never think to ask: how much effort did it take for price to move that far? A 50-pip rally that required barely any volume is a completely different animal from a 50-pip rally that needed massive trading activity to push through. The first one was easy — price slid upward like a knife through butter. The second was a grind, with sellers fighting every tick. Richard Arms thought this distinction mattered more than most traders realized, and in the late 1960s he built an indicator to measure it. The Ease of Movement indicator (EMV) quantifies the relationship between price distance and volume, producing a single oscillating line that tells you whether the current move is happening effortlessly or under heavy resistance. When EMV is positive and rising, bulls are moving price higher without breaking a sweat. When it's negative and falling, bears are in control with similar ease. And when it hovers near zero? That's the market telling you that every inch of price movement is being fought over — which, if you know how to read it, is often the calm before a directional storm.
Key Takeaways
- Richard W. Arms Jr. was not your typical indicator inventor. While most technical analysts in the 1960s were obsessed wi...
- The EMV formula has three parts, and each one does something specific. Understanding the math here isn't just academic —...
- The zero line is the most important feature on the EMV chart. Everything above it says price is moving upward with relat...
1Richard Arms' Question: How Easily Is Price Moving?
Richard W. Arms Jr. was not your typical indicator inventor. While most technical analysts in the 1960s were obsessed with price patterns and moving averages, Arms was staring at something different: the relationship between price range and volume. He noticed that some rallies felt effortless — price covered a lot of ground on relatively little volume — while other rallies were laborious, requiring enormous trading activity just to move a few ticks. That observation became the foundation for his entire body of work, including the Arms Index (TRIN), EquiVolume charts, and eventually the Ease of Movement indicator.
The core insight is almost embarrassingly simple once you hear it. If price moves a long distance on low volume, the move was easy — there was little resistance in the market. If price barely budges despite high volume, the move was hard — buyers and sellers are locked in a tug-of-war. EMV captures this by dividing a measure of price distance by a measure of volume relative to the price range.
Arms published this work in his book "Profits in Volume" and later expanded on it in "Trading Without Fear." The indicator grew out of his earlier EquiVolume charting method, where each bar's width represented volume and its height represented the price range. Wide, short bars meant lots of volume with little price movement (hard movement). Narrow, tall bars meant the opposite (easy movement). EMV simply translates that visual concept into a number.
| Market Condition | Price Distance | Volume | EMV Reading | What It Means |
|---|---|---|---|---|
| Easy upward movement | Large | Low | High positive | Bulls in control, minimal resistance |
| Easy downward movement | Large | Low | High negative | Bears in control, minimal support |
| Hard movement (grinding) | Small | High | Near zero | Heavy two-sided fighting |
| Breakout potential | Small, then expanding | Decreasing, then surging | Flat near zero, then spiking | Coiling before directional explosion |
Why should you care about this distinction? Because not all price moves deserve the same level of trust. A rally that happens on thin volume might be genuine — it could mean there are simply no sellers to oppose it. But it could also be fragile, ready to collapse the moment real selling pressure arrives. EMV helps you tell the difference by putting volume context behind every move.
Compare this to a pure momentum indicator like RSI. RSI tells you that price has moved up over the last 14 periods — but it has absolutely no idea whether that move was effortless or required heroic volume to achieve. EMV fills that gap. A rally with rising RSI AND rising EMV is a rally with both momentum and ease behind it. A rally with rising RSI but flat or falling EMV is a rally that's working too hard — and those tend to stall or reverse.
One practical observation that experienced EMV users learn quickly: extended periods of near-zero EMV readings are not boring — they're informative. When EMV compresses near the zero line for multiple candles, it means volume and price movement are roughly balanced. Neither buyers nor sellers can move price easily. This equilibrium state frequently precedes breakouts, because the market is essentially storing energy. When the balance finally tips, the resulting EMV spike often signals the beginning of a sustained trend.
Arms designed EMV primarily for the stock market, where actual volume data is reported by exchanges. For forex traders, the indicator uses tick volume as a proxy — which is less precise but still captures the general dynamics of participation. We'll address the forex-specific considerations as we go, but the core concept applies regardless of market: price that moves easily on light volume is in a fundamentally different state than price that struggles to move despite heavy activity.
The default period of 14 applies a simple moving average to the raw EMV values, smoothing out the bar-to-bar noise. This is the line you actually see on your chart, and it's the one that generates the trading signals we'll cover in the following sections.
Most indicators ask where price went. EMV asks a better question: how much effort did it take to get there?
2EMV Formula: Distance Moved ÷ Box Ratio
The EMV formula has three parts, and each one does something specific. Understanding the math here isn't just academic — it directly affects how you interpret the indicator's behavior in different market conditions.
Step 1: Distance Moved
Distance Moved = ((Current High + Current Low) / 2) - ((Previous High + Previous Low) / 2)
This is simply the change in the midpoint price from one period to the next. Not the close-to-close change that most indicators use — the midpoint. Arms chose the midpoint because it better represents where the bulk of trading occurred during the bar, rather than the somewhat arbitrary closing price. If today's midpoint is higher than yesterday's, Distance Moved is positive. If lower, negative.
Step 2: Box Ratio
Box Ratio = (Volume / Scale Factor) / (High - Low)
The scale factor (typically 100,000,000 for stocks, though platforms handle this automatically) normalizes the volume to produce manageable numbers. The Box Ratio divides volume by the price range. Think of it as volume density — how much volume was packed into each unit of price movement.
A high Box Ratio means lots of volume relative to the price range — a fat, compressed box in EquiVolume terms. A low Box Ratio means volume was spread thin across a wide price range — a tall, narrow box.
Step 3: The Division
EMV (raw) = Distance Moved / Box Ratio
This is where the magic happens. By dividing the distance price traveled by the volume density, you get a reading of how easily that distance was covered.
| Scenario | Distance Moved | Box Ratio | Raw EMV | Interpretation |
|---|---|---|---|---|
| Big move, low volume | Large positive | Small | Large positive | Easy bullish movement |
| Big move, high volume | Large positive | Large | Moderate positive | Harder bullish movement |
| Small move, high volume | Small | Large | Near zero | Market grinding, no ease |
| Big drop, low volume | Large negative | Small | Large negative | Easy bearish movement |
Step 4: Smoothing
EMV (14) = 14-period SMA of raw EMV
The raw EMV values are noisy — they jump around from bar to bar. Applying a 14-period simple moving average produces the smooth oscillating line that appears on your chart. This is the version you actually trade with.
Let's walk through a concrete example using hypothetical forex data for EUR/USD on a daily chart:
| Day | High | Low | Midpoint | Distance Moved | Volume | Range | Box Ratio | Raw EMV |
|---|---|---|---|---|---|---|---|---|
| 1 | 1.0860 | 1.0830 | 1.0845 | — | 45,000 | 0.0030 | 15,000,000 | — |
| 2 | 1.0880 | 1.0850 | 1.0865 | +0.0020 | 38,000 | 0.0030 | 12,666,667 | +0.000000000158 |
| 3 | 1.0900 | 1.0860 | 1.0880 | +0.0015 | 62,000 | 0.0040 | 15,500,000 | +0.000000000097 |
Notice how Day 2 had a higher raw EMV than Day 3, even though price moved in the same direction both days. Why? Because Day 3 required significantly more volume (62,000 vs 38,000) to achieve a smaller price movement (+0.0015 vs +0.0020). The movement on Day 3 was harder. EMV captured that distinction perfectly.
The raw EMV numbers are absurdly small — that's normal for forex because the scale factor and price ranges produce tiny decimals. Your charting platform handles all the scaling internally, so the line on your chart shows clean, readable values. Don't worry about the raw numbers; focus on whether EMV is above or below zero, and whether it's rising or falling.
Why the midpoint matters more than the close:
Arms' choice to use the midpoint rather than the closing price is a deliberate design decision that affects the indicator's behavior. The close is a single price at a single moment — it can be distorted by a last-second spike or a thin-market closing print. The midpoint of the high-low range better represents the center of gravity of the bar's price action. In fast-moving markets with long wicks, the midpoint stays more stable than the close, which gives EMV a slightly smoother raw reading before the SMA is even applied.
This also means EMV reacts differently than close-based indicators during candles with long shadows. A hammer candle (long lower wick, close near the high) will produce a different EMV reading than a pure price-change indicator would suggest, because the midpoint sits lower than the close. This is actually an advantage — it means EMV accounts for the full range of price activity, not just where the bar happened to close.
Platform implementation notes:
On TradingView, the Ease of Movement indicator is available as a built-in study — search "EOM" or "Ease of Movement" in the indicators panel. The default period is 14, which is what we recommend for most traders. On MetaTrader 5, EMV is not a default built-in indicator, but several solid versions are available in the MQL5 marketplace. When installing a custom MT5 version, verify it uses the standard Arms formula with midpoint distance, not a modified version that substitutes close-to-close changes.
One quirk to be aware of: some platforms label the indicator EOM (Ease of Movement) while others use EMV (Ease of Movement Value). They're the same thing — just different naming conventions. TradingView uses "EOM," StockCharts uses "EMV," and most academic references use "EMV." Don't let the naming confusion throw you off.

When EMV smoothly combines price and volume - no noise, just pure movement efficiency.
“The zero line is the most important feature on the EMV chart.”
3EMV Zero-Line Crossovers: When Movement Gets Easy or Hard
The zero line is the most important feature on the EMV chart. Everything above it says price is moving upward with relative ease. Everything below it says price is moving downward with relative ease. And when the indicator crosses from one side to the other, something meaningful has changed about the effort-to-movement relationship in the market.
Bullish crossover: EMV crosses from negative to positive territory. This means price has shifted from falling easily to rising easily. Volume is no longer supporting the downside — instead, upward movement is meeting less resistance than downward movement was previously. The path of least resistance has flipped.
Bearish crossover: EMV crosses from positive to negative territory. The opposite shift — upward movement has become difficult while downward movement is becoming easy. Sellers are encountering less resistance, and the ease of movement now favors the bears.
The basic trading application is straightforward: buy when EMV crosses above zero, sell or short when it crosses below. But like every zero-line crossover system, the devil is in the details. Not all crosses are worth trading, and the context around each cross dramatically affects its reliability.
What makes a high-quality EMV zero-line cross:
-
Duration below (or above) zero before the cross. An EMV that's been negative for 20 or more bars before crossing positive is more significant than one that dipped below zero for three bars and bounced back. Extended time on one side of zero means the market has been in a sustained easy-movement regime in that direction. When it finally crosses, the shift represents a genuine change in market dynamics, not just noise.
-
Slope at the crossover point. A steep angle through zero suggests conviction. EMV that crawls sideways along the zero line and barely ekes across is less trustworthy — it often leads to immediate whipsaws back to the other side.
-
Price structure confirmation. The best EMV crosses happen simultaneously with meaningful price events: a break above resistance, a bounce off support, or a trend-line break. EMV crossing zero while price sits in the middle of a choppy range is much less reliable.
| Cross Quality | EMV Behavior | Price Action | Reliability |
|---|---|---|---|
| High conviction | Sharp cross, steep slope, 15+ bars on prior side | Breaking key level, trend-line break | Strong — trade with standard stop |
| Moderate | Clean cross, 8-14 bars on prior side | Near support/resistance but not breaking | Decent — add a confirmation candle |
| Low / Whipsaw risk | Slow drift, under 5 bars on prior side | Choppy, no structure | Skip or wait for better setup |
The whipsaw problem and how to handle it:
In ranging, sideways markets, EMV oscillates back and forth across zero like a pendulum. Each cross looks like a signal, but none of them follow through because there's no sustained directional ease in the market. Volume is roughly balanced, price isn't going anywhere with conviction, and the EMV just chops.
The most effective whipsaw filter is simple: require EMV to not only cross zero but close a certain distance beyond it. Instead of buying the instant EMV ticks above zero, wait for it to close above a threshold — say, the average of its positive readings over the last 50 bars. This eliminates the shallow crosses that immediately reverse. You'll miss the occasional genuine signal that starts small, but the trades you do take will have better follow-through.
Another approach: combine the zero-line cross with a trend filter. Use a 50-period moving average on price as your directional bias. Only take bullish EMV crosses when price is above the 50 MA, and only take bearish crosses when price is below. This cuts the signal count roughly in half but eliminates most of the false crosses that occur during consolidations.
Divergence at the zero line — an underrated setup:
One of the most valuable signals EMV produces isn't a clean cross but a divergence pattern near zero. Here's how it works:
Price makes a new low, but EMV makes a higher low that stays closer to zero than the previous dip. This means the downward movement is becoming harder — it's taking more effort (more volume relative to price distance) to push price lower. Even though price made a new low, the ease of that movement has decreased. This bullish divergence pattern often precedes a genuine zero-line cross by several bars, giving you an early warning.
The bearish version: price makes a new high, but EMV's positive peak is lower than the previous one. Upward movement is losing its ease. The market is working harder to push price higher, which typically means a bearish zero-line cross is approaching.
| Divergence Type | Price | EMV | Signal |
|---|---|---|---|
| Bullish | Lower low | Higher low (closer to zero) | Downward ease fading — reversal approaching |
| Bearish | Higher high | Lower high (closer to zero) | Upward ease fading — reversal approaching |
| Hidden bullish | Higher low | Lower low | Trend continuation — pullback exhausting |
| Hidden bearish | Lower high | Higher high | Trend continuation — rally exhausting |
Practical timeframe considerations:
On D1 charts, EMV zero-line crosses produce roughly 6-10 signals per year on major forex pairs — a manageable frequency for swing traders. Each cross tends to be meaningful because daily volume data (even tick volume) smooths out the intraday noise.
On H4, the frequency increases to roughly 2-4 signals per month. These are still tradeable, but you need stricter filters — the slope and price structure filters mentioned above become essential rather than optional.
On H1, crosses happen frequently enough that trading every single one is impractical and unprofitable. Use H1 EMV crosses as confirmation for setups identified through other means (price action, support/resistance) rather than as primary signals. Think of H1 EMV as a "green light" indicator — it doesn't tell you what to trade, but it tells you when volume dynamics support the trade you're already considering.
EMV crossing above zero means price is gliding. Below zero means every tick is a battle.
4EMV for Trend Confirmation: High EMV = Strong, Low Effort Move
Here's where EMV really earns its place on the chart: trend confirmation. Not as a signal generator that tells you when to buy or sell, but as a background filter that tells you whether the current trend has genuine ease behind it or is grinding forward on borrowed time.
The logic is straightforward. A healthy uptrend should produce consistently positive EMV readings. Price is moving higher without excessive volume resistance — the move is easy. When EMV stays positive and ideally rising during an uptrend, the trend has what Arms called a favorable "path of least resistance." Buyers aren't fighting hard to push price up; the market is naturally drifting in their favor.
Conversely, when price is trending higher but EMV is declining toward zero (or already negative), you've got a problem. Price is still going up, but the ease of that movement is deteriorating. It's taking more and more volume just to squeeze out smaller gains. That's a trend running out of steam — and it's the kind of warning you simply cannot get from a pure price-based indicator like a moving average.
The EMV trend confirmation framework:
| Trend Direction | EMV Position | EMV Slope | Trend Health | Action |
|---|---|---|---|---|
| Uptrend | Positive | Rising | Strong — easy upward movement | Hold longs, consider adding |
| Uptrend | Positive | Flat | Moderate — ease stabilizing | Hold longs, watch for deterioration |
| Uptrend | Positive | Falling | Weakening — movement getting harder | Tighten stops, take partial profits |
| Uptrend | Crossing zero | Falling | Danger — ease has shifted to bears | Exit longs, prepare for reversal |
| Downtrend | Negative | Falling | Strong — easy downward movement | Hold shorts, consider adding |
| Downtrend | Negative | Rising toward zero | Weakening — bears losing ease | Tighten stops on shorts |
This framework turns EMV into a trade management tool rather than an entry tool — and honestly, that's where it provides the most value. Finding entries is the easy part of trading (there's no shortage of entry signals from any indicator). Managing positions — knowing when to hold, when to tighten, and when to exit — is what separates profitable traders from break-even ones.
Using EMV to confirm breakouts:
Breakouts are one of the most popular — and most frustrating — trading setups. The problem with breakouts is that roughly half of them fail. Price punches through resistance, you jump in, and then it reverses back into the range. False breakouts destroy accounts.
EMV adds a genuine edge to breakout trading by answering the question: is this breakout happening easily? When price breaks above resistance and EMV simultaneously spikes positive, the breakout is occurring with relative ease — volume isn't excessive relative to the price distance covered. That's a healthy breakout. Smart money is pushing through resistance without needing massive effort.
When price breaks above resistance but EMV barely moves or stays near zero, the breakout required heavy volume just to push through. That's a labored breakout — and labored breakouts have a nasty tendency to fail. The market had to work too hard to get through that level, which means there's likely strong selling interest on the other side.
| Breakout Type | Price Action | EMV Behavior | Probability of Follow-Through |
|---|---|---|---|
| Easy breakout | Clean break above resistance | EMV spikes positive | Higher — path of least resistance is up |
| Labored breakout | Grinds through resistance slowly | EMV near zero or slightly positive | Lower — heavy resistance being encountered |
| Volume-exhaustion breakout | Spikes through on massive volume | EMV moderate (high volume offsets distance) | Mixed — often reverses after initial spike |
| False breakout | Pops above, quickly reverses | EMV stays flat or turns negative | Very low — avoid or fade |
Multi-timeframe EMV confirmation:
One of the most effective ways to use EMV is across two timeframes simultaneously. Check D1 EMV for the overall trend's ease of movement, then drop to H4 for entries.
When D1 EMV is positive and rising: look for long entries on H4 when the H4 EMV pulls back toward zero and bounces positive. You're entering pullbacks within an easy-moving uptrend — buying dips in a market where the path of least resistance is clearly upward.
When D1 EMV is negative and falling: look for short entries on H4 when the H4 EMV rallies toward zero and turns back negative. Same logic, opposite direction.
When D1 EMV is near zero and flat: stay out or reduce position sizes. The daily trend has no clear ease of movement in either direction, which means the market is in a balanced state where both directions require roughly equal effort. These are the conditions that produce whipsaws on every indicator, not just EMV.
EMV and trend exhaustion — the late-stage warning:
Perhaps the most valuable thing EMV does is identify the final phase of a trend before reversal. In the early and middle stages of a trend, EMV confirms the move — it's positive during uptrends and negative during downtrends, as expected. But in the late stage, something interesting happens: price continues making new highs (or lows), but EMV starts making lower highs (or higher lows).
This is classic divergence, and it has a specific meaning in the context of EMV. When price makes a new high but EMV doesn't, it means the latest push higher was harder than the previous one — it took more effort relative to the distance covered. The trend is exhausting itself. Each new high requires proportionally more volume to achieve, which is exactly how trends die.
Arms himself emphasized that this exhaustion signal was one of the primary reasons he created the indicator. Traditional momentum divergence (RSI, MACD) tells you the rate of price change is slowing. EMV divergence tells you the effort-to-distance ratio is deteriorating. Both are bearish for the trend, but EMV's version incorporates the volume dimension that pure momentum indicators miss.
For prop firm traders and anyone managing risk with tight drawdown limits, this late-stage warning is particularly valuable. Exiting a position while it's still profitable — just because the ease of movement is deteriorating — is one of the hardest things in trading. EMV gives you a quantitative reason to take profits before the reversal hits, rather than waiting for price to actually turn against you.

High EMV trends move like butter - effortless price movement with minimal resistance.
“If you've read the Force Index guide on this site, you might be wondering: aren't EMV and the Force Index doing basically the same thing? Both combine price movement with volume.”
5EMV vs Force Index: Two Volume-Movement Indicators Compared
If you've read the Force Index guide on this site, you might be wondering: aren't EMV and the Force Index doing basically the same thing? Both combine price movement with volume. Both oscillate around zero. Both are used for trend confirmation and divergence signals. So why would you choose one over the other?
The answer lies in a fundamental philosophical difference about what volume means.
The Force Index treats volume as an amplifier. Its formula — (Close today - Close yesterday) x Volume — multiplies price change by volume. More volume makes the reading bigger. In Alexander Elder's framework, high volume confirms strong conviction. A rally on heavy volume is more trustworthy than a rally on light volume, because more participants are voting with their money.
EMV treats volume as resistance. Its formula — Distance Moved / Box Ratio — divides by a volume-related term. More volume makes the reading smaller (closer to zero). In Richard Arms' framework, high volume means the market is working hard. A rally on heavy volume might be bullish in price terms, but it tells Arms that the upward movement required significant effort — which is a cautionary sign about sustainability.
These are opposite interpretations of the same data, and both have merit.
| Feature | Ease of Movement (EMV) | Force Index (FI) |
|---|---|---|
| Creator | Richard Arms (1960s) | Alexander Elder (1993) |
| Formula logic | Distance / Volume (division) | Price change x Volume (multiplication) |
| Volume interpretation | High volume = resistance, hard movement | High volume = conviction, strong force |
| What a spike means | Price moved far on thin volume (easy) | Price moved far on heavy volume (forceful) |
| Zero-line meaning | Above = easy upward, below = easy downward | Above = bullish force, below = bearish force |
| Best for | Detecting unsustainable effort, breakout quality | Confirming trend strength, timing pullbacks |
| Default period | 14-period SMA | 13-period EMA (or 2-period for timing) |
| Smoothing method | Simple Moving Average | Exponential Moving Average |
| Dual-period system | No — single period | Yes — 2-period and 13-period serve different roles |
When to choose EMV over Force Index:
EMV excels when you want to know whether a move is sustainable. Because it penalizes high-volume moves, it naturally highlights the rallies and selloffs that are happening on thin volume — which, counterintuitively, are often the most sustainable. When price advances easily (low volume, large distance), it means there's simply no opposition. No sellers are stepping in. That's a market with a clear path of least resistance, and those moves tend to persist until opposition finally arrives.
EMV is also better for identifying breakout quality. A breakout with high EMV means price punched through resistance without needing much volume — the resistance was paper-thin. A breakout with low EMV despite a big price move means the market had to throw heavy volume at that level to get through, which suggests the breakout might not hold. The Force Index would show a large positive reading for both breakouts (because both had significant price change, and the high-volume one even more so), making it harder to distinguish real breakouts from exhaustion spikes.
When to choose Force Index over EMV:
The Force Index is better for identifying the conviction behind a trend. When you want to know whether participants are backing a move with real money, the Force Index's multiplication of price change by volume gives you a direct answer. Rising Force Index during an uptrend means more and more capital is flowing into the move — that's a healthy, well-supported trend.
The Force Index also has a built-in dual-period system that EMV lacks. Elder designed the 2-period Force Index specifically for entry timing (catching pullbacks) and the 13-period for trend confirmation. This gives the Force Index a structured framework for both strategic and tactical decisions. EMV uses a single period and serves primarily as a trend confirmation and filtering tool — it's less suited for precise entry timing.
Force Index also handles mean-reversion entries better. When the 2-period Force Index dips below zero during an uptrend, it explicitly marks the pullback as a buying opportunity. EMV doesn't have an equivalent mechanism — its zero-line crosses are trend signals, not pullback entries.
Can you use both simultaneously?
Absolutely, and there's a logical way to do it. When EMV and Force Index agree — both above zero during an uptrend, or both below zero during a downtrend — you have double confirmation that the move has both ease and conviction. That's the strongest possible configuration.
When they disagree, the market is telling you something nuanced:
| EMV | Force Index | Interpretation |
|---|---|---|
| Positive (easy upward) | Positive (strong buying force) | Full alignment — strong bullish signal |
| Positive (easy upward) | Near zero or negative | Price rising easily but without strong volume conviction — fragile rally |
| Near zero | Positive (strong force) | Heavy volume pushing price, but movement is difficult — potential exhaustion |
| Negative (easy downward) | Negative (strong selling force) | Full alignment — strong bearish signal |
| Near zero | Near zero | No ease, no force — market in equilibrium, expect a breakout |
The disagreement scenarios are particularly interesting. EMV positive with Force Index weak means price is drifting higher effortlessly but without much participation — a quiet rally that could continue indefinitely but would collapse at the first sign of selling pressure. Force Index positive with EMV near zero means heavy volume is being thrown at the market but isn't producing proportional price movement — effort without result, which is often bearish despite the bullish volume.
A practical decision framework:
If you're a trend-following trader who holds positions for days to weeks, EMV is probably your better primary tool. Its emphasis on ease of movement aligns naturally with the trend-following philosophy: you want to ride moves that are happening effortlessly and exit when they start requiring too much effort.
If you're a swing trader who times entries within established trends, the Force Index's dual-period system gives you more actionable signals. Use the 13-period for direction, the 2-period for entries, and you have a complete framework.
If you can't decide — and both indicators interest you — run EMV on D1 for trend filtering and the 2-period Force Index on H4 for entry timing. That combination gives you Arms' ease-of-movement concept for the big picture and Elder's force-based pullback entries for execution. It's a surprisingly complementary pairing, precisely because the two indicators interpret volume in opposite ways.

EMV asks "how easy was this move?" Force Index asks "how powerful was this move?" Subtle but important difference.
Frequently Asked Questions
Q1What does a high positive EMV value mean?
A high positive EMV value means price is advancing a significant distance relative to the volume required. In practical terms, the market is moving upward easily — there's little selling resistance opposing the rally. This typically indicates a clear path of least resistance for bulls and suggests the upward trend is likely to continue until significant selling pressure arrives. The higher the reading, the more effortless the upward movement.
Q2Is EMV reliable on forex charts that use tick volume?
EMV is less precise on forex than on equities or futures because forex platforms report tick volume (number of price changes) rather than actual traded volume. However, tick volume correlates reasonably well with real activity on major pairs like EUR/USD and GBP/USD during liquid sessions (London and New York). Use EMV as a confirmation tool on forex rather than a standalone signal generator. On H4 and D1 charts, the 14-period smoothing averages out most tick volume irregularities. For the most accurate EMV readings, consider using forex futures (CME) where exchange-reported volume is available.
Q3What is the best EMV period setting for different timeframes?
On D1 charts, the default 14-period setting works well for swing trading — it filters daily noise while remaining responsive to multi-week shifts. On H4, reducing the period to 10-12 sharpens signals without excessive whipsaws. On H1, increasing to 18-21 periods adds smoothing that compensates for irregular tick volume spikes. For longer-term position trading on weekly charts, 14 remains appropriate since each bar already represents five days of data. Avoid going below 8 on any timeframe, as the raw EMV values become too noisy to interpret reliably.
Q4How is Ease of Movement different from On Balance Volume (OBV)?
OBV is a cumulative indicator that adds volume on up-close bars and subtracts volume on down-close bars, creating a running total. It measures volume flow direction but doesn't account for how far price moved relative to that volume. EMV directly measures the effort-to-distance ratio — how much volume was needed to move price a given distance. A stock that rallies 2% on massive volume would show a strong OBV increase but a modest EMV reading (because the movement was hard). The same 2% rally on thin volume would barely register on OBV but produce a large EMV spike (because the movement was easy). They measure fundamentally different aspects of the volume-price relationship.
Q5Can EMV be used as a standalone trading indicator?
EMV works best as a confirmation and filtering tool rather than a standalone signal generator. Zero-line crossovers produce too many false signals in ranging markets to be traded mechanically without additional filters. Most experienced traders pair EMV with a trend direction indicator (such as a 50-period moving average or ADX) and price structure analysis (support/resistance levels, chart patterns). The indicator's real strength is answering the question 'how easily is price moving?' — information that enhances any existing strategy but doesn't constitute a complete strategy by itself.
Top Brokers
About the Author
Daniel Harrington
Senior Trading Analyst
Daniel Harrington is a Senior Trading Analyst with a MScF (Master of Science in Finance) specializing in quantitative asset and risk management. With over 12 years of experience in forex and derivatives markets, he covers MT5 platform optimization, algorithmic trading strategies, and practical insights for retail traders.
Use This Indicator
Risk Disclaimer
Trading financial instruments carries significant risk and may not be suitable for all investors. Past performance does not guarantee future results. This content is for educational purposes only and should not be considered investment advice. Always conduct your own research before trading.