Elder-Ray Index: Dr. Alexander Elder's Complete Bull & Bear Power System
Elder-Ray Index combines Bulls Power and Bears Power with an EMA to measure the strength of buying and selling pressure behind price movements.

Daniel Harrington
Senior Trading Analyst · MT5 Specialist
☕ 19 min read
Settings — Elder-Ray
| Category | oscillator |
| Default Period | 13 |
| Best Timeframes | H1, H4, D1 |
Most indicators were built by mathematicians and engineers. This one was built by a psychiatrist. Dr. Alexander Elder fled the Soviet Union, practiced psychiatry in New York, and then turned his clinical eye for human behavior toward the financial markets. In 1989, he published Trading for a Living and introduced the Elder-Ray Index — a system that X-rays the market to reveal the hidden struggle between buyers and sellers beneath every price bar. The name was deliberate: just as a medical X-ray shows bones beneath skin, Elder-Ray shows the forces beneath candlesticks. The system consists of three components — a 13-period EMA for trend direction, Bull Power for measuring buying force, and Bear Power for measuring selling force. Together, they form one of the cleanest diagnostic frameworks in technical analysis, and they are available right inside MetaTrader 5.
Key Takeaways
- Alexander Elder's path to trading guru was anything but conventional. Born in Leningrad in 1950, he grew up in Estonia a...
- Setting up the Elder-Ray system in MetaTrader 5 takes about sixty seconds, but understanding what you are looking at tak...
- Elder's buy conditions are counterintuitive at first glance. You are not buying when everything looks bullish. You are b...
1From Psychiatrist to Trading Guru: Alexander Elder's Journey
Alexander Elder's path to trading guru was anything but conventional. Born in Leningrad in 1950, he grew up in Estonia and studied medicine there before being assigned to work as a ship's doctor. At age 23, while his ship was docked in Africa, Elder defected from the Soviet Union and eventually made his way to New York City, where he built a career in psychiatry. He treated patients, taught at Columbia University's medical school, and seemed settled into a stable professional life.
But Elder had discovered the markets. What hooked him was not greed — it was the psychology. As a psychiatrist, he saw the same emotional patterns in traders that he saw in patients: fear, denial, impulsive behavior, and the stubborn refusal to accept reality when it contradicted their wishes. He realized that understanding crowd psychology gave him an edge that purely mathematical approaches missed. Markets were not just numbers — they were masses of people making decisions under emotional pressure.
His first book, Trading for a Living (1989), became one of the best-selling trading books of all time and remains a staple recommendation for serious traders three decades later. The book laid out Elder's philosophy that successful trading requires three pillars: psychology (managing your own emotions), method (a systematic approach to analysis), and money management (controlling risk). The Elder-Ray Index was the centerpiece of his method pillar.
Elder followed up with Come Into My Trading Room (2002), which refined his systems and introduced updated approaches to his original methodology. He also wrote Sell and Sell Short and several editions of The New Trading for a Living (2014), which modernized the original work for contemporary markets. Throughout, the Elder-Ray Index and the Triple Screen trading system remained central to his approach.
What made Elder different from most indicator creators was his insistence on understanding what an indicator measures in human terms. He did not design Bull Power and Bear Power as abstract mathematical constructs. He framed them as direct measurements of something psychologically real: the maximum effort buyers and sellers exerted during each trading session.
The high of any bar represents the maximum power of buyers during that period — the highest point they managed to push price before running out of steam. The low represents the maximum power of sellers — the deepest they managed to drag price before buyers stepped in. And the 13-period Exponential Moving Average represents the current consensus of value — where the market collectively agrees the asset is worth based on recent trading history.
From these observations, Elder derived two simple formulas:
Bull Power = High - EMA(13) Bear Power = Low - EMA(13)
Bull Power measures how far above the consensus buyers managed to push the session high. Bear Power measures how far below the consensus sellers managed to push the session low. Together with the EMA's slope (rising, falling, or flat), these three components tell you who is winning the battle, who is losing, and — most importantly — who is starting to lose their grip.
The 13-period EMA was not chosen randomly. On a daily chart, 13 periods covers roughly half a trading month — long enough to establish a meaningful consensus but short enough to react to genuine shifts in market sentiment. Elder specifically chose an exponential average over a simple one because the EMA gives more weight to recent prices, making it more responsive to fresh information without overreacting to single-bar noise.
Elder also made a point that many traders overlook: Bull Power should normally be positive and Bear Power should normally be negative. Think about it — in most bars, the high is above the average and the low is below it. When Bull Power drops into negative territory, it means buyers could not even push the session high above the consensus. That is a significant sign of weakness. When Bear Power rises into positive territory, sellers could not push the low below the consensus — a sign that bears have lost control. These zero-line crossings are meaningful events that many traders fail to monitor.

Elder was a psychiatrist who escaped the Soviet Union and applied crowd psychology to markets. His story is wild.
2The Elder-Ray System: EMA + Bull Power + Bear Power
Setting up the Elder-Ray system in MetaTrader 5 takes about sixty seconds, but understanding what you are looking at takes longer. There is no single built-in Elder-Ray indicator in MT5 — you need to add three components manually.
First, add a 13-period EMA to your price chart. Go to Insert, Indicators, Trend, Moving Average. Set the period to 13, method to Exponential, and apply to Close. This line represents the market's consensus of fair value.
Second, add Bulls Power. Navigate to Insert, Indicators, Oscillators, Bulls Power. The default period is 13 — leave it. This histogram appears below your chart and measures High minus EMA(13).
Third, add Bears Power from the same oscillators menu. Same default period of 13. This second histogram also plots below the chart, measuring Low minus EMA(13).
You now have Elder's complete X-ray on screen. Here is how to read it.
Component 1: The 13-period EMA slope. This is your trend compass. If the EMA is rising, the trend favors buyers — you should only look for long entries. If it is falling, the trend favors sellers — look for shorts only. If it is flat, the market is in consolidation and Elder recommended staying on the sidelines. This directional filter is non-negotiable in Elder's system. Trading against the EMA slope is the single fastest way to lose money with Elder-Ray.
Component 2: Bull Power histogram. Normally positive. Each bar shows how far above the EMA the session high reached. Tall positive bars mean buyers are aggressively pushing prices above the consensus — strong bullish force. Declining positive bars mean buyers are still pushing above the EMA but with fading enthusiasm. When Bull Power drops to zero or goes negative, buyers failed to push the high above the consensus — they are in serious trouble.
Watch for divergence: if price makes a higher high but Bull Power makes a lower high, buyers pushed to a new price extreme with less force. That bearish divergence warns that the uptrend is running on fumes.
Component 3: Bear Power histogram. Normally negative. Each bar shows how far below the EMA the session low dropped. Deeply negative bars mean sellers are aggressively driving prices below the consensus. Rising (less negative) bars mean sellers are still present but weakening. When Bear Power crosses above zero, sellers could not even push the low beneath the EMA — they have effectively capitulated for that session.
Bullish divergence on Bear Power is one of the strongest signals in the entire system: price makes a lower low but Bear Power makes a higher low. Sellers pushed to a new price extreme with less force. The downtrend is losing momentum even though price still looks bearish.
Reading all three together — the diagnostic framework:
| EMA Slope | Bull Power | Bear Power | Interpretation |
|---|---|---|---|
| Rising | Positive and increasing | Negative but rising | Strong uptrend — bulls dominate |
| Rising | Positive but declining | Negative but rising | Uptrend weakening — watch for reversal |
| Rising | Positive | Negative and rising toward zero | Buy zone — bears weakening in uptrend |
| Falling | Positive but declining | Negative and deepening | Strong downtrend — bears dominate |
| Falling | Positive and declining toward zero | Negative | Sell zone — bulls weakening in downtrend |
| Flat | Mixed | Mixed | No trade — market is range-bound |
One detail that trips up beginners: the absolute values of Bull Power and Bear Power depend entirely on the instrument and its price level. On EUR/USD, typical readings might range from -0.0100 to +0.0100. On gold, the same indicator might show -15.00 to +15.00. On a stock trading at 200 dollars, readings could span -5.00 to +5.00. You cannot set universal thresholds — you must evaluate each instrument's readings relative to its own recent history.
The histogram bars themselves tell a story through their sequence. Three or four consecutive bars moving in the same direction represent sustained pressure. A single bar that reverses direction within an otherwise consistent sequence is just noise. Look for patterns of two or three bars confirming a directional shift before acting on the signal.
Elder emphasized repeatedly in his books that the three components must be read together, not in isolation. Bulls Power alone tells you about buying force but ignores selling force. Bear Power alone tells you about selling pressure but misses the buyers. The EMA alone gives you trend direction but no information about the forces driving it. The power of the system is in the intersection — when all three components align, the signal quality jumps significantly.

When bulls and bears team up with EMA - Elder's triple threat system revealed!
“Elder's buy conditions are counterintuitive at first glance.”
3Elder-Ray Buy Signals: When Bears Weaken in an Uptrend
Elder's buy conditions are counterintuitive at first glance. You are not buying when everything looks bullish. You are buying when the trend is up but sellers are still fighting — and losing. This is Elder the psychiatrist at work: he understood that the best entries come when the crowd is still scared, not when everyone is already celebrating.
The classic Elder-Ray buy signal requires two essential conditions and two optional enhancers:
Essential Condition 1: The 13-period EMA must be rising. This confirms that the broader trend favors buyers. Without a rising EMA, no buy signal is valid in Elder's framework — full stop. A flat or declining EMA means you wait, regardless of what Bull Power and Bear Power are doing.
Essential Condition 2: Bear Power must be negative but rising (moving toward zero). This is the key insight. Negative Bear Power means sellers are still active — they are pushing session lows below the EMA. But the rising trajectory means they are losing force with each passing bar. You are catching the moment where selling pressure is fading within an established uptrend. Think of it as buying during a pullback, but with a precise measurement of whether the pullback's momentum is genuinely weakening.
Optional Enhancer 1: The most recent Bull Power peak is higher than its previous peak. This means buyers are producing progressively stronger rallies — each upswing carries more force than the last. When combined with weakening Bear Power, you have a picture of increasing demand meeting decreasing supply.
Optional Enhancer 2: Bear Power is rising from a bullish divergence. Price made a lower low, but Bear Power printed a higher low. Sellers pushed deeper but with less force — classic exhaustion. When this divergence resolves while the EMA still slopes upward, it produces some of the highest-probability entries in Elder's entire system.
The step-by-step entry process:
- Confirm the 13-period EMA is clearly rising on your trading timeframe (H4 or D1 recommended)
- Wait for a pullback that pushes Bear Power into negative territory — this is the counter-trend dip you want to buy
- Watch for Bear Power to form a trough and begin rising back toward zero
- Enter long when Bear Power prints its second consecutive rising bar (moving toward zero)
- Place your stop-loss below the swing low formed during the pullback — the lowest point of the correction
- Target the previous swing high as a conservative exit, or use a 1.5:1 to 2:1 reward-to-risk ratio
Where this works best: H4 and D1 during established trends on major forex pairs and indices. On EUR/USD H4, this setup typically produces moves of 70 to 150 pips when the weekly trend also supports the direction. On D1, the moves are larger — 150 to 300 pips — but setups form less frequently, perhaps two to four per month on a single pair.
A real-world pattern to visualize: Picture a currency pair in a clear uptrend — the 13-period EMA slopes upward and price has been making higher highs. Then a news event or profit-taking triggers a pullback. Price drops, and Bear Power plunges into negative territory as sellers temporarily take control of intraday lows. Over the next three to five bars, the pullback loses steam. Bear Power is still negative but each bar shows a less negative reading. The bears tried their hardest and they are fading. Meanwhile, the EMA continues to slope upward because the broader trend has not changed. That convergence — rising EMA plus weakening Bear Power — is your entry window.
Common mistakes with Elder-Ray buy signals:
Buying when Bear Power is positive. Elder explicitly warned against this. When Bear Power is positive, sellers could not even push the low below the EMA. That sounds bullish, but it often marks an overextended rally. You are buying too late — the pullback-and-resumption opportunity has already passed, and you are chasing.
Ignoring the EMA slope. Traders sometimes spot beautiful Bear Power divergence or a clean rising pattern and ignore the fact that the EMA is flat or declining. Without a rising EMA, you are buying against the trend or into a range. Elder's rules exist precisely because discretionary traders tend to see what they want to see. The EMA acts as an objective filter.
Acting on a single rising bar. One bar of improvement in Bear Power can be noise. Wait for at least two consecutive bars showing rising values before committing. On H4, that means waiting an additional four to eight hours for confirmation — a small price to pay for significantly better signal quality.
Not checking the higher timeframe. Elder designed the Elder-Ray to work within his Triple Screen framework, where a higher timeframe confirms the trend direction. A D1 buy signal gains substantial weight when the weekly chart also shows a rising EMA. A standalone H4 signal without weekly confirmation still works, but at a lower hit rate.
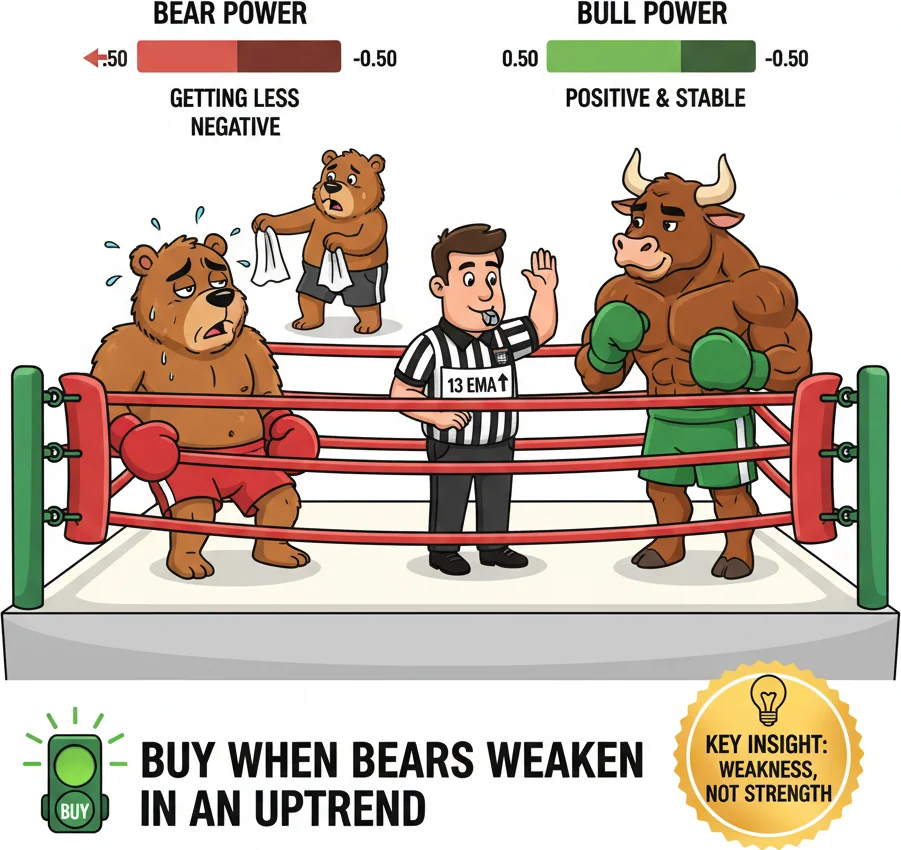
The buy signal is not about bulls being strong. It is about bears getting WEAKER while the EMA still points up.
4Elder-Ray Sell Signals: When Bulls Tire in a Downtrend
The Elder-Ray sell signal is the mirror image of the buy setup, and it catches one of the most profitable scenarios in trading: a counter-trend bounce that runs out of energy within a larger downtrend. You are not selling because everything looks bearish — you are selling because bulls tried to fight back and failed.
Essential Condition 1: The 13-period EMA must be falling. The broader trend is bearish. Without a declining EMA, no sell signal is valid.
Essential Condition 2: Bull Power must be positive but declining (moving toward zero). Buyers are still managing to push session highs above the EMA — they are fighting. But their force is diminishing bar by bar. They are running out of ammunition within a market controlled by sellers.
Optional Enhancer 1: The most recent Bear Power trough is lower than the previous one. Sellers are producing progressively deeper lows — each down-leg carries more force. Increasing selling pressure meeting decreasing buying resistance is a potent combination.
Optional Enhancer 2: Bull Power is falling from a bearish divergence. Price made a higher high, but Bull Power printed a lower high. Buyers reached a new price extreme with less force. The uptrend is exhausting itself even though price still looks like it is advancing.
Bearish divergence on Bull Power is the crown jewel of Elder-Ray sell signals. Elder identified it as one of the most reliable setups across all of his indicators. When price pushes to a new high but the force behind that push (measured by the gap between the high and the EMA) has diminished, you are seeing institutional smart money distributing positions while retail traders are still buying. The divergence quantifies that invisible shift.
The step-by-step short entry process:
- Confirm the 13-period EMA is clearly declining on H4 or D1
- Wait for a counter-trend bounce that pushes Bull Power above zero — buyers are temporarily driving highs above the EMA
- Watch for Bull Power to peak and begin declining back toward zero
- Enter short when Bull Power prints its second consecutive declining bar
- Place your stop-loss above the swing high formed during the bounce
- Target the previous swing low, or use a measured-move projection
Why this pattern captures excellent risk-to-reward: Counter-trend bounces within downtrends tend to be sharp but brief. Traders who bought the bounce get trapped when the primary trend reasserts itself. Their stop-loss exits add fuel to the resumption of the downtrend. By entering as Bull Power peaks and starts declining, you are positioned right before that cascade of trapped-trader liquidation hits. The stop is tight (just above the bounce high) while the potential move extends to the prior low or beyond.
Timeframe behavior:
| Timeframe | Signal Frequency | Typical Move | Hit Rate (with trend) |
|---|---|---|---|
| H1 | 3-5 per week per pair | 30-60 pips | ~50-55% |
| H4 | 1-2 per week per pair | 80-150 pips | ~55-65% |
| D1 | 2-4 per month per pair | 150-300 pips | ~60-70% |
H4 hits the sweet spot for most traders — enough signals to stay active, clean enough to maintain an edge, and large enough moves to justify the spread and slippage costs.
Critical nuance: when NOT to sell with Elder-Ray.
Do not short when Bull Power is negative. Negative Bull Power means buyers could not push the session high above the EMA — they have already given up. Shorting there means you are entering after the sellers have already done the work. The easy part of the move is over, and you risk catching the bottom where a snap-back rally materializes as exhausted sellers take profits.
Do not short when the EMA is flat or rising, even if Bull Power shows a perfect declining pattern. The EMA is your trend compass. If it is not pointing down, you do not have a downtrend, and selling into a range or an uptrend is a losing proposition over time.
Do not force the signal when Bull Power barely crosses above zero before declining. The best sell setups occur when Bull Power has a clear positive reading — showing genuine buying effort — that then rolls over. A signal where Bull Power ticks to +0.0002 and immediately falls back is not the same as one where it reaches +0.0040 before turning. The more energy buyers put into the bounce, the more meaningful it is when that energy dissipates.
Combining sell signals with support and resistance: Elder-Ray sell signals that align with known resistance levels — previous swing highs, round numbers, Fibonacci retracement zones — carry substantially more weight. The resistance level provides a structural reason for the bounce to fail, and the declining Bull Power provides the momentum confirmation that it is indeed failing. Either signal alone is useful; together they are significantly more reliable.
Exit management: Elder suggested trailing stops using the Elder-Ray components. As long as the EMA continues falling and Bear Power remains negative or deepening, the trend is intact — stay in the trade. When Bear Power begins rising sharply toward zero, sellers are losing force and it may be time to tighten your stop or take partial profits. If the EMA flattens, consider closing entirely. The same indicators that got you into the trade tell you when conditions are changing.

Bulls getting exhausted in downtrends - time to sell when they're overheating!
“Elder never intended the Elder-Ray Index to operate in a vacuum.”
5The Triple Screen Method: Elder-Ray in Context
Elder never intended the Elder-Ray Index to operate in a vacuum. He designed it as the second screen of his Triple Screen trading system — a multi-timeframe framework that remains one of the most respected methodologies in retail trading education. Understanding how Elder-Ray fits within Triple Screen transforms it from a standalone indicator into part of a complete trading process.
The Triple Screen system uses a nautical metaphor that Elder borrowed from his maritime background (remember, he defected from a ship). Markets move like the ocean: the tide sets the long-term direction, waves create intermediate swings within that direction, and ripples provide the fine-grained entry points. Each screen corresponds to one of these layers.
Screen 1 — The Tide (Higher Timeframe Trend)
The first screen identifies the dominant trend direction on a timeframe roughly five times longer than your trading timeframe. If you trade on D1, your first screen is the weekly chart. If you trade on H4, your first screen is the D1 chart.
Elder originally used the MACD histogram slope on the weekly chart to identify the tide. When the weekly MACD histogram rises from bar to bar, the tide is bullish — you only look for buy signals. When it falls bar to bar, the tide is bearish — you only look for sell signals. Some traders substitute a 26-week EMA slope or a weekly 13-period EMA for the MACD histogram. The exact tool matters less than the principle: establish the primary direction first, and never trade against it.
This screen alone eliminates roughly half of all potential trades. Every signal that goes against the weekly trend gets filtered out before you even look at your daily chart. It is a blunt filter, and that is the point — blunt filters remove the most dangerous trades.
Screen 2 — The Wave (Elder-Ray on Trading Timeframe)
This is where the Elder-Ray Index operates. On your trading timeframe (D1 if the first screen uses weekly, or H4 if the first screen uses D1), you apply the full Elder-Ray setup: the 13-period EMA, Bull Power, and Bear Power.
When the first screen shows a bullish tide, you use the second screen to identify pullbacks within that uptrend. Specifically, you watch for Bear Power to dip into negative territory and then begin rising — the classic Elder-Ray buy setup described earlier. You are buying a wave pullback within a bullish tide.
When the first screen shows a bearish tide, you watch for Bull Power to bounce into positive territory and then start declining. You are selling a wave bounce within a bearish tide.
The alignment between screens one and two is what gives the system its edge. A daily Elder-Ray buy signal is decent on its own. A daily Elder-Ray buy signal that also aligns with a bullish weekly trend is substantially stronger because institutional flows on the weekly timeframe support the daily entry. You are trading with the big current, not against it.
Screen 3 — The Ripple (Precise Entry Trigger)
The third screen drops to an even shorter timeframe — H4 if your second screen is D1, or H1 if your second screen is H4 — to find precise entry points. Elder originally recommended trailing buy stops and sell stops as the third screen entry method.
For a long entry after screens one and two align bullish: place a trailing buy stop one tick above the previous bar's high on the short timeframe. If price breaks higher, you are filled and riding the ripple in the direction of both the wave and the tide. If price drops instead, move the buy stop down to one tick above the new bar's high. You keep trailing it lower until either you are filled or the second screen signal expires (Bear Power turns negative again or the EMA slope changes).
For a short entry: use a trailing sell stop one tick below the previous bar's low. Trail it upward until filled or the signal expires.
This technique produces tight entries with small initial stops because you are buying breakouts on the shortest timeframe in alignment with both intermediate and long-term forces.
Practical Triple Screen configuration for forex:
| Your Style | Screen 1 (Tide) | Screen 2 (Wave) | Screen 3 (Ripple) |
|---|---|---|---|
| Swing trader | Weekly MACD histogram | D1 Elder-Ray | H4 trailing stops |
| Active day trader | D1 EMA slope | H4 Elder-Ray | H1 trailing stops |
| Aggressive intraday | H4 EMA slope | H1 Elder-Ray | M15 trailing stops |
How the Triple Screen eliminates common Elder-Ray weaknesses:
Elder-Ray's biggest vulnerability is ranging markets. When price consolidates, the EMA flattens, Bull Power and Bear Power produce choppy, meaningless readings, and you get whipsawed. The first screen catches this problem early: if the weekly MACD histogram is choppy and trendless, you do not trade. Period. The first screen acts as a circuit breaker that keeps you out of the market when conditions do not favor trend-following strategies.
Another weakness: Elder-Ray can produce buy and sell signals that look valid on a single timeframe but contradict the bigger picture. A beautiful D1 buy setup is worthless if the weekly trend is firmly bearish. Triple Screen prevents this by making the higher timeframe the gatekeeper. No signal passes without approval from the level above.
Elder's position sizing rule within Triple Screen: When all three screens align, Elder recommended trading your standard position size. When only two screens agree, he suggested reducing size or waiting. He explicitly cautioned against increasing size beyond your standard even when all three screens agree — overconfidence after a string of aligned signals was a psychological trap he saw repeatedly in his clinical practice with trader-patients.
The Triple Screen system is not perfect — no system is. It generates fewer trades than pure indicator-based approaches because the multi-screen alignment requirement is restrictive. On a single currency pair, you might find only two to four fully aligned setups per month. But the trades it does produce carry significantly better risk-reward profiles than single-timeframe signals, and the win rate improves meaningfully when all three screens agree.
The enduring popularity of Triple Screen, more than three decades after its publication, speaks to its practical value. The specific indicators can be swapped — some traders use RSI instead of Elder-Ray on the second screen, or ADX instead of MACD on the first screen. But the multi-timeframe principle Elder established — let the tide set direction, the wave set timing, and the ripple set execution — remains as sound today as it was when he first described it.
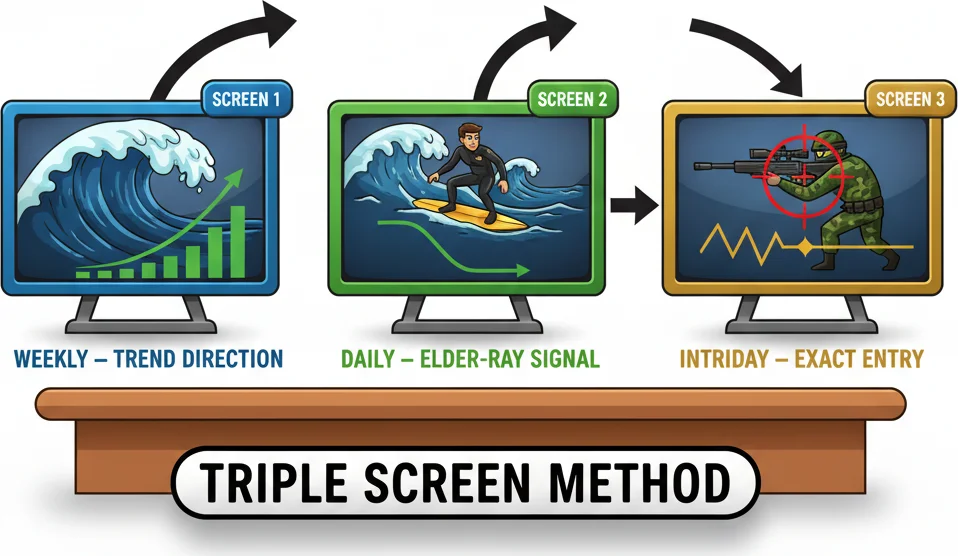
Elder never uses one timeframe. Screen 1 picks the tide, Screen 2 finds the wave, Screen 3 times the entry.
Frequently Asked Questions
Q1What is the Elder-Ray Index and how is it calculated?
The Elder-Ray Index is a three-component technical analysis system developed by Dr. Alexander Elder in 1989. It consists of a 13-period Exponential Moving Average (EMA) applied to closing prices, Bull Power calculated as the session High minus the 13-period EMA, and Bear Power calculated as the session Low minus the 13-period EMA. The EMA establishes the market's consensus of fair value, Bull Power measures how far above that consensus buyers managed to push price, and Bear Power measures how far below it sellers managed to push. In MetaTrader 5, you add Bulls Power and Bears Power separately from the Oscillators menu, plus a 13-period EMA on the price chart.
Q2What is the difference between Bull Power and Bear Power?
Bull Power (High minus EMA) measures buying force — how far above the average consensus buyers pushed the session high. Bear Power (Low minus EMA) measures selling force — how far below the consensus sellers dragged the session low. Bull Power is normally positive because highs usually sit above the EMA; Bear Power is normally negative because lows usually sit below it. When Bull Power turns negative, buyers are extremely weak. When Bear Power turns positive, sellers have lost control. The two indicators complement each other and Elder designed them to be read together, not in isolation.
Q3What are the best Elder-Ray buy and sell signal conditions?
For a buy signal, Elder requires two essential conditions: the 13-period EMA must be rising (uptrend confirmed) and Bear Power must be negative but increasing toward zero (sellers present but weakening). For a sell signal, the EMA must be falling and Bull Power must be positive but declining toward zero (buyers present but fading). Optional enhancers include divergence — Bear Power making higher lows while price makes lower lows for buy signals, or Bull Power making lower highs while price makes higher highs for sell signals. Elder specifically warned against buying when Bear Power is positive or selling when Bull Power is negative.
Q4How does Elder-Ray fit into the Triple Screen trading system?
Elder-Ray serves as the second screen in Elder's Triple Screen method. The first screen identifies the dominant trend on a higher timeframe (typically weekly MACD histogram for swing traders). The second screen applies Elder-Ray on the trading timeframe (daily or H4) to find pullback entries in the trend direction. The third screen uses trailing buy or sell stops on an even shorter timeframe for precise entries. This multi-timeframe approach eliminates Elder-Ray's biggest weakness — false signals in ranging markets — because the first screen filters out trendless conditions before you even look at Elder-Ray.
Q5Can I change the Elder-Ray default period from 13 to something else?
You can, but Elder chose 13 deliberately. On a daily chart, 13 periods covers roughly half a trading month — long enough to represent a meaningful price consensus while remaining responsive to genuine shifts. The exponential weighting ensures recent prices have more influence. Some traders experiment with 21 periods for smoother signals on volatile instruments or 8 periods for faster response on lower timeframes. However, Elder's buy and sell rules were designed around the 13-period setting, so changing it alters how the signal conditions behave. If you are following Elder's methodology, stick with 13.
Top Brokers
About the Author
Daniel Harrington
Senior Trading Analyst
Daniel Harrington is a Senior Trading Analyst with a MScF (Master of Science in Finance) specializing in quantitative asset and risk management. With over 12 years of experience in forex and derivatives markets, he covers MT5 platform optimization, algorithmic trading strategies, and practical insights for retail traders.
Use This Indicator
Risk Disclaimer
Trading financial instruments carries significant risk and may not be suitable for all investors. Past performance does not guarantee future results. This content is for educational purposes only and should not be considered investment advice. Always conduct your own research before trading.