Force Index Indicator: Alexander Elder’s Volume-Based Momentum Tool
Force Index combines price change, direction, and volume into a single oscillator to measure the power behind price movements.

Daniel Harrington
Senior Trading Analyst · MT5 Specialist
☕ 19 min read
Settings — FI
| Category | oscillator |
| Default Period | 13 |
| Best Timeframes | H1, H4, D1 |
Most momentum indicators ignore volume entirely. They measure how far or how fast price moved, but they never ask the follow-up question: did anyone actually show up for that move? Alexander Elder thought that was a serious oversight. His Force Index, introduced in the 1993 book Trading for a Living, combines price change with volume into a single number that measures not just direction, but conviction. A 50-pip rally on thin volume and a 50-pip rally on massive volume are very different events — and the Force Index treats them differently. The formula is almost laughably simple: take today's close minus yesterday's close, multiply by volume, smooth it with an EMA, and you have your reading. Positive means bulls are pushing with force. Negative means bears have the weight. Zero means nobody is winning. On MT5, the Force Index lives in the Navigator panel under Indicators > Oscillators > Force Index, defaulting to a 13-period EMA that works well on H1, H4, and D1 charts across forex, indices, and commodities.
Key Takeaways
- Alexander Elder built the Force Index around a physics analogy: force equals mass times acceleration. In market terms, t...
- Elder did not design the Force Index as a one-size-fits-all tool. He explicitly recommended using two different EMA peri...
- The zero line is to the Force Index what sea level is to an altimeter — it divides the world into two fundamentally diff...
1Elder’s Three Forces: Direction, Distance, and Volume
Alexander Elder built the Force Index around a physics analogy: force equals mass times acceleration. In market terms, the "mass" is volume and the "acceleration" is price change. The result is an indicator that captures three dimensions of every price bar — direction, distance, and participation — and collapses them into a single oscillating line.
The raw formula is deceptively simple:
Force Index (1-period) = (Close_today - Close_yesterday) x Volume
That one-period value is then smoothed:
Force Index (13) = 13-period EMA of Force Index (1)
Let's unpack what each component contributes.
Direction comes from the sign of the price change. If today's close is higher than yesterday's, the raw Force Index is positive. If lower, it is negative. This is the most basic piece — are buyers or sellers winning this bar?
Distance comes from the magnitude of the price change. A 30-pip move produces a larger raw Force Index than a 10-pip move, all else equal. This captures the idea that not all bullish bars are created equal. A bar that grinds up 5 pips is technically bullish, but it barely registers on the Force Index. A bar that rockets 80 pips lights the indicator up like a runway.
Volume acts as a multiplier — Elder's version of mass. A 30-pip move on 50,000 contracts produces a Force Index reading five times larger than the same 30-pip move on 10,000 contracts. This is where the Force Index separates itself from pure momentum oscillators like RSI or Momentum. Those indicators would see those two 30-pip moves as identical. The Force Index recognizes that one had five times more market participation behind it.
Why does participation matter? Because price can move on thin volume for many reasons — a stop hunt during the Asian session, a brief liquidity gap, a few large orders pushing through an empty book. Those moves look dramatic on the chart but lack the broad market conviction to sustain themselves. Conversely, when price moves on heavy volume, many participants are voting in the same direction. That kind of consensus tends to follow through.
Elder described this in Trading for a Living with a practical example: imagine two identical price rallies on a stock. In the first, volume is average. In the second, volume is three times the average. The second rally has three times the force behind it — three times as many traders committed capital to that directional move. The Force Index captures that distinction numerically.
The 13-period EMA smoothing serves a critical purpose. The raw 1-period Force Index is extremely jagged — it swings wildly from bar to bar because volume itself is noisy. A single high-volume candle followed by a low-volume candle creates a spike-then-collapse pattern that is nearly impossible to trade. The EMA smooths those spikes into a readable oscillating line that crosses above and below zero in a more orderly fashion.
| Component | What It Measures | Effect on FI |
|---|---|---|
| Price direction | Bullish vs bearish close | Positive or negative sign |
| Price distance | Magnitude of move | Scales the reading proportionally |
| Volume | Market participation | Multiplies the reading |
| EMA smoothing | Reduces noise | Reveals sustained trends in force |
One subtlety that trips up beginners: the Force Index is unbounded. Unlike RSI (which ranges 0-100) or Stochastic (0-100), the Force Index can theoretically reach any positive or negative value. This means there is no universal overbought or oversold level. You cannot say Force Index above 500 is overbought because 500 might be extreme for EUR/USD on H1 but perfectly normal for a volatile stock on the daily chart. Instead, you evaluate each reading relative to the indicator's own recent history on that specific instrument and timeframe.
This lack of fixed boundaries is both a strength and a limitation. It is a strength because it means the indicator never clips or distorts extreme readings the way RSI does when it parks at 70 or 30 for weeks during a strong trend. It is a limitation because it forces you to develop contextual judgment — there is no lazy threshold to lean on.
On MT5, when you apply the Force Index, you will see a single line oscillating around a zero line. The default period is 13, the default method is Exponential, and the default price is Close. Leave these settings as they are for standard analysis. The one setting worth considering is the volume type — MT5 offers both Tick Volume and Real Volume. For forex pairs, Tick Volume is your only option since there is no centralized exchange reporting real volume. We will address this distinction in detail in the final section.
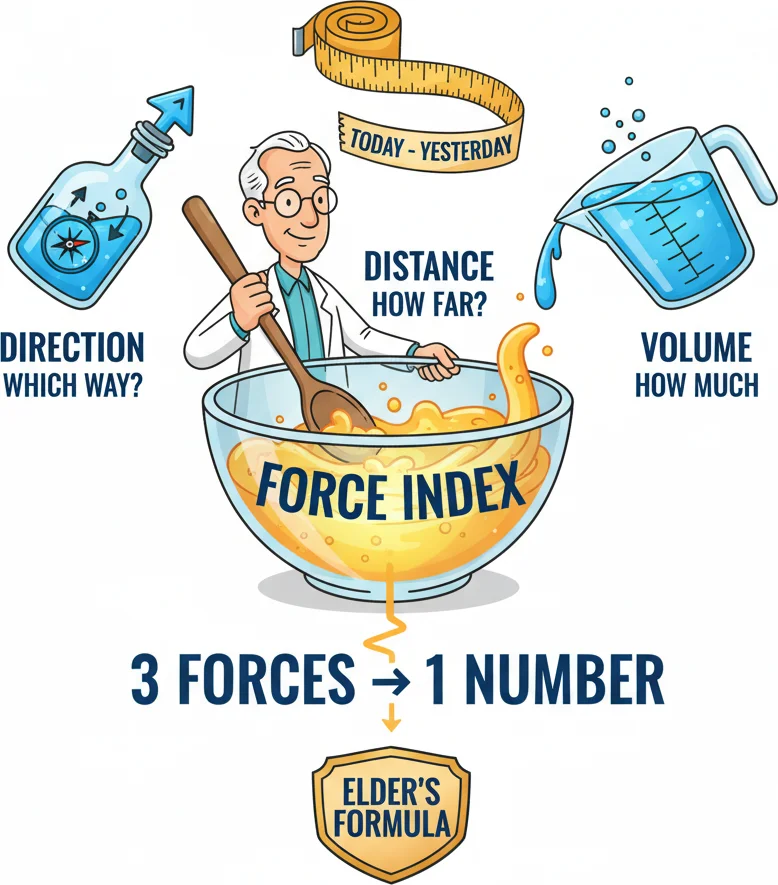
Every price bar tells three stories: which way, how far, and how much participation. Force Index captures all three.
22-Period vs 13-Period Force Index: Short-Term vs Trend
Elder did not design the Force Index as a one-size-fits-all tool. He explicitly recommended using two different EMA periods for two different purposes — and understanding the distinction is arguably more important than memorizing the formula.
The 2-period Force Index is a short-term timing tool. It reacts fast, swings above and below zero frequently, and is designed to catch brief pullbacks within an established trend. Elder's original strategy paired the 2-period Force Index with a 22-day EMA of price for trend direction. When the 22-day EMA is rising (uptrend), you watch for the 2-period Force Index to dip below zero — this indicates a temporary pullback where sellers briefly gained the upper hand within a bullish context. That dip below zero is your buying opportunity. When the 2-period Force Index turns positive again, the pullback is likely over and the uptrend is resuming.
The mirror applies in downtrends: when the 22-day EMA is falling, you watch for the 2-period Force Index to spike above zero (a brief rally within a bearish trend) and then fall back below zero — that is your selling opportunity.
This is essentially a mean-reversion entry within a trending framework. The 2-period Force Index oscillates so quickly that it crosses zero multiple times per week on most timeframes. On H1 charts, you might see three to five zero-line crosses in a single day. That frequency is intentional — Elder designed it to catch every minor ebb and flow within the larger tide.
The practical problem with the 2-period version is obvious: it generates a lot of signals. Many of those pullbacks are so shallow they barely qualify as entries, and the noise-to-signal ratio can be frustrating for newer traders. Elder himself acknowledged this, which is why he paired it with the 22-day EMA filter and recommended it primarily for experienced traders who can quickly assess whether a dip below zero represents a genuine pullback worth buying or just noise.
The 13-period Force Index is a different animal entirely. It smooths out the daily noise and reveals the medium-term balance of power between buyers and sellers. When the 13-period Force Index is above zero, bulls have controlled the market over the past roughly two and a half weeks. When it is below zero, bears have had the upper hand.
The 13-period version crosses zero much less frequently — perhaps once or twice a month on daily charts, or once every few days on H4. Each crossover is therefore more significant. A move from negative to positive territory on the 13-period Force Index suggests a genuine shift in medium-term momentum, not just a one-bar hiccup.
| Feature | 2-Period FI | 13-Period FI |
|---|---|---|
| Purpose | Entry timing within trend | Trend confirmation |
| Sensitivity | Very high | Moderate |
| Zero-line crosses | Frequent (multiple/week) | Infrequent (few/month) |
| Signal type | Pullback entries | Trend direction shifts |
| Best paired with | 22-day EMA trend filter | Support/resistance levels |
| Ideal timeframe | H1, H4 | H4, D1 |
| Noise level | High | Low |
How to use them together: Elder's recommended approach was a dual-timeframe setup. Use the 13-period Force Index on a higher timeframe (D1) to establish the trend direction. Then drop to a lower timeframe (H4 or H1) and use the 2-period Force Index to time entries within that trend. For example: if the daily 13-period Force Index is positive and rising, the trend is bullish. Switch to H4, wait for the 2-period Force Index to dip below zero (a counter-trend pullback), and buy when it turns positive again.
This dual-period approach is one of the things that makes the Force Index unique among oscillators. Most indicators give you one period to optimize and leave it at that. Elder built the Force Index with two specific use cases baked into the design — the 2-period for tactical entries and the 13-period for strategic trend assessment. You are not guessing at settings or optimizing blindly. The inventor told you which periods to use and why.
One word of caution: traders occasionally try periods like 5, 8, or 21, hoping to find a middle ground. There is nothing technically wrong with this, but you lose the specific framework Elder designed. The 2-period and 13-period versions have well-documented trading strategies behind them. Custom periods do not. If you want to experiment, do it in a demo account and keep the original periods on your live charts.
On MT5, switching between the two is straightforward — just change the Period parameter in the indicator settings. Some traders add both to the same chart in separate sub-windows, with the 13-period version in one panel for trend context and the 2-period in another for entry timing. This setup gives you Elder's complete Force Index framework at a glance.

13-period Force Index: like choosing the tortoise over the hare in trend confirmation.
“The zero line is to the Force Index what sea level is to an altimeter — it divides the world into two fundamentally different territories.”
3Force Index Zero-Line Crossovers for Trend Trading
The zero line is to the Force Index what sea level is to an altimeter — it divides the world into two fundamentally different territories. Above zero, buyers are exerting more force than sellers. Below zero, sellers dominate. And the moment the indicator crosses from one side to the other, the balance of power has shifted.
Zero-line crossovers on the 13-period Force Index are the indicator's most straightforward trend-following signal. Unlike the 2-period version (which crosses zero too frequently to be meaningful as a standalone signal), the 13-period version produces crossovers that carry real weight. Each one represents a sustained shift in volume-weighted momentum over roughly two weeks of price action.
Bullish crossover: The 13-period Force Index moves from below zero to above zero. This means that, on average, the volume-weighted price changes over the last 13 periods have shifted from bearish to bullish. The market is not just moving up — it is moving up with participation.
Bearish crossover: The 13-period Force Index moves from above zero to below zero. The bears have taken over, and they have volume behind them.
The basic trading approach is simple:
- Buy when the 13-period Force Index crosses above zero
- Sell (or close longs) when it crosses below zero
- Short when it crosses below zero
- Cover (or close shorts) when it crosses above zero
This mechanical approach works reasonably well in trending markets. On EUR/USD daily charts, zero-line crossovers on the 13-period Force Index have historically captured the bulk of sustained trends while avoiding the worst of sideways chop — because volume tends to dry up during consolidation, keeping the Force Index near zero without producing clean crossovers.
But here is where it gets interesting. The Force Index zero-line crossover is not just a momentum signal — it is a volume-confirmed momentum signal. Compare it to a simple moving average crossover: when a 5-period MA crosses above a 13-period MA, you know momentum has shifted, but you have no idea whether that shift occurred on heavy or light volume. The Force Index bakes volume into the calculation. A crossover that happens during a high-volume breakout produces a sharper, more decisive move through zero than one that drifts across on thin holiday trading.
Filtering crossovers for quality:
Not all zero-line crosses are created equal. Here are practical filters that separate high-quality signals from noise:
Filter 1 — Slope at the crossover. A Force Index that rockets through zero at a steep angle suggests strong conviction. One that meanders sideways and barely crosses is less convincing. Look at how quickly the indicator moves away from zero after the cross. If it crosses and then immediately flattens, the signal is weak.
Filter 2 — Price structure alignment. A bullish zero-line cross that occurs as price breaks above a consolidation range or retests a support level is far more reliable than one that happens in the middle of nowhere. Always check: does the price chart agree with the Force Index signal?
Filter 3 — Trend confirmation from a moving average. Elder recommended pairing Force Index crossovers with a 22-day or 50-day EMA of price. If the EMA is rising and the Force Index crosses above zero, you have trend alignment — both the price trend and volume-weighted momentum point in the same direction. If the EMA is flat or declining while the Force Index crosses above zero, the signal is more ambiguous.
| Signal Quality | FI Behavior | Price Behavior | Confidence |
|---|---|---|---|
| High | Sharp cross, steep slope | Breakout or trend continuation | Strong — trade it |
| Medium | Clean cross, moderate slope | No clear price trigger | Moderate — add confirmation |
| Low | Slow drift across zero | Choppy, no structure | Weak — usually skip |
The whipsaw problem: In ranging markets, the 13-period Force Index can oscillate near zero, producing multiple crossovers that go nowhere. This is the classic oscillator trap — the indicator is designed for trending conditions, and when the market is not trending, it chops. The moving average filter mentioned above is your best defense. If the 50-day EMA is flat, treat Force Index crossovers with heavy skepticism regardless of how clean they look.
Practical application on H4: For swing traders working the H4 chart, a 13-period Force Index zero-line crossover combined with a 50-period EMA trend filter produces a manageable number of signals — typically two to four per month per major pair. That frequency is low enough to be selective but high enough to stay engaged.
One clever technique: use the zero-line crossover as a regime filter rather than a direct entry trigger. When the 13-period Force Index is above zero, only look for long setups using your preferred entry method (price action, support bounces, whatever you trust). When it is below zero, only look for shorts. This approach uses the Force Index as a directional bias tool rather than asking it to provide exact entry timing — a role the 2-period version handles better.
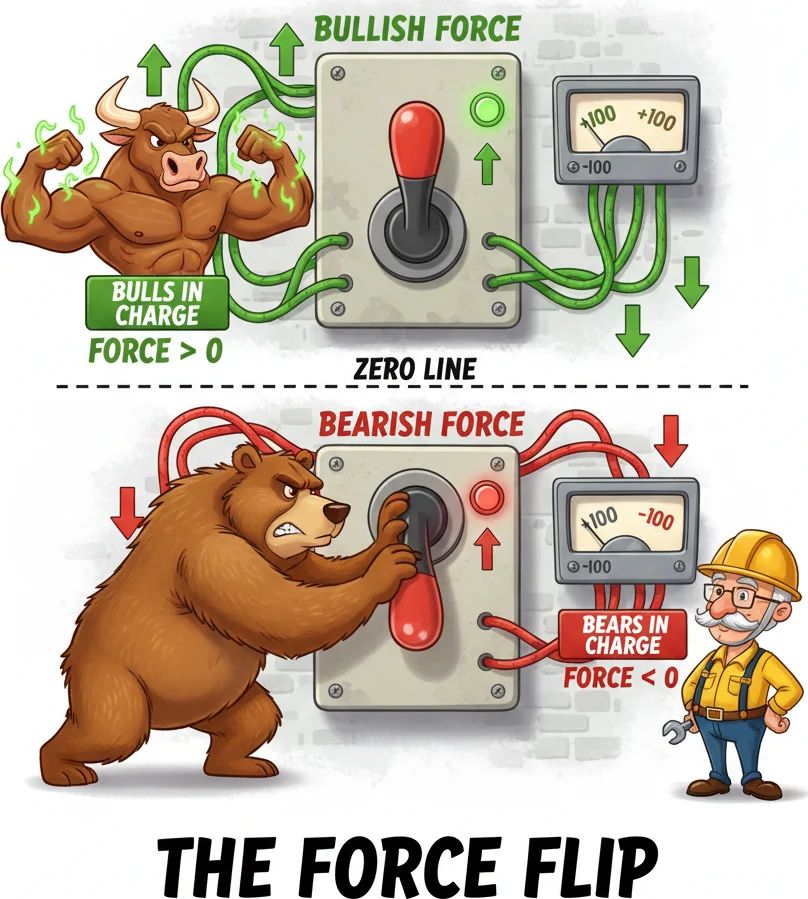
Above zero, every move has bullish force behind it. Below zero, bears are driving. The crossover is the pivot moment.
4Force Index Divergence: Volume Confirming or Denying Price
Divergence is a concept that works with nearly every oscillator, but with the Force Index, it carries an extra layer of meaning. When RSI diverges from price, it tells you that momentum is weakening. When the Force Index diverges from price, it tells you that volume-weighted momentum is weakening — which means not only is the move losing speed, but the participation behind it is fading too. That is a stronger warning sign.
Bullish divergence occurs when price makes a lower low but the Force Index makes a higher low. Translation: yes, price dropped to a new low, but it did so with less force than the previous decline. Fewer traders (or less volume) participated in the second push down. The sellers are losing their grip, and the stage is set for a bounce or reversal.
Bearish divergence occurs when price makes a higher high but the Force Index makes a lower high. Price reached new territory, but it got there with less conviction. The rally is running on fumes — volume is not confirming the move higher. Smart money may already be stepping back while retail chasers push price to one last high.
This is where the Force Index's volume component becomes genuinely valuable. With a pure price-based oscillator like MACD, divergence tells you that the rate of price change is slowing. With the Force Index, divergence tells you that the rate of price change multiplied by volume is slowing. That additional dimension makes Force Index divergence somewhat more reliable because it is harder for price to keep trending when both speed and participation are declining.
How to trade Force Index divergence step by step:
-
Identify the divergence. On the 13-period Force Index, look for two swing highs in the indicator (for bearish divergence) or two swing lows (for bullish divergence) where the second extreme is weaker than the first while price moves the opposite way.
-
Wait for confirmation. Divergence alone is a warning, not a trigger. The confirmation comes when the Force Index crosses the zero line in the direction of the expected reversal. For bullish divergence, wait for the Force Index to cross above zero. For bearish divergence, wait for it to cross below zero. This combination — divergence plus zero-line cross — is one of the strongest signals the Force Index produces.
-
Check price structure. The best divergence setups occur at meaningful support or resistance levels. Bullish divergence forming at a known demand zone or the bottom of a price channel is far more compelling than divergence in the middle of a trend with no structural context.
-
Enter on the confirmation bar. Once the Force Index crosses zero in the divergence direction and a confirming candle closes, enter the trade. Stop-loss goes beyond the price extreme that formed the divergence (below the lower low for bullish divergence, above the higher high for bearish).
-
Target the next structural level. Because divergence signals tend to catch reversals rather than continuations, your target should be the next significant support or resistance level — not an open-ended trend ride.
Volume confirmation vs. volume denial — the broader concept:
Beyond formal divergence patterns, the Force Index provides ongoing volume confirmation (or denial) of price action. When price is trending up and the Force Index is positive and rising, volume is confirming the trend — participants are actively pushing price higher. When price is trending up but the Force Index is positive and declining (even though it has not crossed zero yet), you have early volume denial. The trend is intact in price terms, but the conviction behind it is eroding.
This pre-divergence weakening is a subtlety that many traders miss. You do not need a formal two-peak divergence pattern to extract useful information. Simply watching whether the Force Index is expanding or contracting alongside a price trend gives you a real-time read on participation.
| Scenario | Price Action | Force Index Behavior | Interpretation |
|---|---|---|---|
| Trend confirmed | Higher highs | Positive and rising | Strong trend, hold positions |
| Early warning | Higher highs | Positive but declining | Conviction fading, tighten stops |
| Formal divergence | Higher high | Lower high | Reversal likely, prepare exit |
| Reversal confirmed | Higher high | Crosses below zero | Exit longs, consider shorts |
Common divergence mistakes with the Force Index:
-
Looking for divergence on the 2-period Force Index. The 2-period version is too noisy for reliable divergence. It produces what appear to be divergence patterns every few days, most of which mean nothing. Stick to the 13-period version for divergence analysis.
-
Forcing divergence where it does not exist. The two swing points you compare should be clear, distinct extremes — not minor wiggles in the indicator line. If you have to squint and draw creative trendlines to see the divergence, it probably is not there.
-
Acting on divergence without confirmation. Divergence can persist for a long time before price actually reverses. A market can produce three, four, even five consecutive divergence signals while the trend continues. The zero-line cross confirmation step is not optional — it is what separates theoretical divergence from actionable divergence.

When price makes new highs but Force Index says 'actually, no volume behind this move.'
“Here is the elephant in the room.”
5Force Index on Forex: The Tick Volume Consideration
Here is the elephant in the room. Alexander Elder designed the Force Index for stocks and futures — markets with centralized exchanges that report real trading volume. Every share traded on a stock exchange gets counted. Every futures contract executed on the CME gets recorded. The volume in the Force Index formula is actual volume, and the indicator works exactly as intended.
Forex is different. The foreign exchange market is decentralized — there is no single exchange, no central order book, and no authority collecting total volume data. Trillions of dollars flow through a fragmented network of banks, brokers, ECNs, and dark pools every day, and no one entity sees the complete picture. When you look at the volume on your MT5 forex chart, you are not seeing real traded volume. You are seeing tick volume.
What is tick volume? Tick volume counts the number of price changes (ticks) during each candle. Every time the bid or ask price updates, the tick counter increments by one. A candle with 500 ticks had 500 price changes during its formation. A candle with 2,000 ticks had 2,000.
What tick volume does not tell you: The size of the trades behind those price changes. One tick might represent a $100 retail order or a $50 million institutional block. Both register as a single tick. This is a fundamental limitation — the Force Index formula multiplies price change by volume, and if that volume does not reflect actual trade size, the multiplication is somewhat arbitrary.
The good news: Research has consistently shown a strong correlation — typically above 90% — between tick volume and actual traded volume in forex markets. The logic is intuitive: when real volume is high, many participants are sending orders, and prices update rapidly. When real volume is low, fewer orders flow and price ticks less frequently. Tick volume may not measure the exact dollars traded, but it serves as a reliable proxy for market activity levels.
This means the Force Index on forex is not useless — it is an approximation. The indicator still correctly identifies periods of high activity versus low activity, which is the core insight it is designed to capture. A 50-pip move on 3,000 ticks (high activity) genuinely does represent more market conviction than the same 50-pip move on 300 ticks (low activity). The relative readings are meaningful even if the absolute numbers are not.
Practical adjustments for forex traders using the Force Index:
1. Treat it as a secondary tool, not a primary signal. On stocks and futures, where real volume data exists, the Force Index can be a primary trading tool. On forex, use it as confirmation for signals generated by price action, support/resistance, or other non-volume indicators. It adds a useful dimension but should not be the sole basis for a trade.
2. Be aware of broker-dependent differences. Your tick volume data comes from your specific broker's liquidity feed. Two different brokers will show different tick volumes for the same candle on the same pair because they receive data from different liquidity providers. The Force Index readings on broker A and broker B will differ slightly. This is not a fatal problem — the general trends and crossovers will be similar — but it means you should not compare absolute Force Index values across different platforms.
3. Watch for low-liquidity distortions. During off-peak hours (late New York to early Tokyo overlap), around major holidays, and during Friday afternoons, forex tick volume drops significantly. The Force Index can produce misleading readings during these periods because a few trades can move price substantially on thin ticks. A spike in the Force Index at 3 AM EST might just be a single institutional order sweeping through a thin book — not a genuine shift in market conviction.
| Forex Session | Typical Tick Volume | Force Index Reliability |
|---|---|---|
| London-New York overlap | Highest | Most reliable |
| London session | High | Reliable |
| New York session | Moderate-High | Reliable |
| Tokyo session | Moderate | Decent, watch for low-liquidity spikes |
| Sydney/late NY | Low | Least reliable, use with caution |
4. The Force Index works better on higher timeframes in forex. On H4 and D1, tick volume accumulates over enough time that broker differences and low-liquidity noise average out. On M5 or M15, individual candles may contain so few ticks that the Force Index readings become erratic. Stick to H1 at minimum, and ideally H4 or D1 for the most stable readings.
5. Consider pairing with CFD indices or futures for volume validation. If you trade index CFDs alongside forex pairs, those indices track underlying futures markets with real volume data. The Force Index is more reliable on these instruments. Some traders use the Force Index on a correlated index to validate signals on forex pairs — for instance, checking the Force Index on the Dollar Index futures before acting on a EUR/USD Force Index signal.
Bottom line: The Force Index on forex is like using a kitchen scale that measures in rough increments instead of precise grams. It will tell you whether something is heavy or light, but it will not give you the exact weight. For the indicator's purpose — distinguishing between high-conviction moves and low-conviction moves — that rough measurement is usually enough. Just do not build your entire strategy around it the way you might on an exchange-traded instrument with real volume. Use it as one voice in a committee of indicators, and let price action have the final say.

Force Index was built for stocks with real volume. On forex you use tick volume — it is not perfect but it is the best we have.
Frequently Asked Questions
Q1What is the Force Index and how is it calculated?
The Force Index is a momentum oscillator created by Alexander Elder that measures the force behind price moves by combining three elements: direction, distance, and volume. The raw 1-period formula is Force Index = (Current Close - Previous Close) x Volume. This value is then smoothed with an exponential moving average, typically 13 periods. Positive readings indicate buying force, negative readings indicate selling force, and the magnitude reflects both the size of the price move and the volume behind it.
Q2Should I use the 2-period or 13-period Force Index?
It depends on your goal. The 2-period Force Index is a short-term timing tool designed to catch brief pullbacks within an existing trend — Elder recommended pairing it with a 22-day EMA to identify dips worth buying in uptrends and bounces worth selling in downtrends. The 13-period version is a trend confirmation tool that reveals medium-term shifts in volume-weighted momentum. Many traders use both: the 13-period on a higher timeframe for direction and the 2-period on a lower timeframe for entry timing.
Q3Does the Force Index work on forex without real volume data?
It works as an approximation, not a precise measurement. Forex charts use tick volume (number of price changes) instead of real traded volume. Research shows tick volume correlates above 90% with actual volume in forex, so the Force Index still correctly identifies high-activity versus low-activity periods. However, treat it as a secondary confirmation tool rather than a primary signal generator on forex. It is most reliable during high-liquidity sessions like the London-New York overlap and on higher timeframes (H4, D1) where tick volume noise averages out.
Q4What is the difference between the Force Index and RSI?
The Force Index incorporates volume into its calculation, while RSI measures only the speed and magnitude of price changes. RSI is bounded between 0 and 100 with defined overbought and oversold zones. The Force Index is unbounded — it can reach any positive or negative value — and oscillates around a zero line instead of between fixed boundaries. This means the Force Index never clips extreme readings the way RSI does during strong trends, but it also lacks convenient fixed thresholds for overbought and oversold conditions.
Q5How do I spot Force Index divergence and when should I act on it?
Bullish divergence occurs when price makes a lower low but the 13-period Force Index makes a higher low, suggesting selling force is weakening. Bearish divergence is the reverse: price makes a higher high while the Force Index makes a lower high. Never act on divergence alone — it is a warning, not a trigger. Wait for confirmation: ideally a zero-line crossover in the direction of the expected reversal combined with a price break of a support or resistance level. Divergence signals on the 2-period Force Index are too noisy to be reliable; stick to the 13-period version.
Top Brokers
About the Author
Daniel Harrington
Senior Trading Analyst
Daniel Harrington is a Senior Trading Analyst with a MScF (Master of Science in Finance) specializing in quantitative asset and risk management. With over 12 years of experience in forex and derivatives markets, he covers MT5 platform optimization, algorithmic trading strategies, and practical insights for retail traders.
Use This Indicator
Risk Disclaimer
Trading financial instruments carries significant risk and may not be suitable for all investors. Past performance does not guarantee future results. This content is for educational purposes only and should not be considered investment advice. Always conduct your own research before trading.