Guppy Multiple Moving Average (GMMA): Reading Retail vs Institutional Sentiment
GMMA plots two groups of EMAs (short-term and long-term) to reveal the interaction between traders and investors, identifying trend changes and breakout strength.

Daniel Harrington
Senior Trading Analyst · MT5 Specialist
☕ 14 min read
Settings — GMMA
| Category | trend |
| Default Period | null |
| Best Timeframes | H1, H4, D1 |
Most moving average systems give you a line and wish you luck. The Guppy Multiple Moving Average throws twelve lines at you instead — and somehow, that chaos tells a clearer story than any single MA ever could. Developed by Australian trader and columnist Daryl Guppy in the 1990s, the GMMA splits those twelve exponential moving averages into two distinct groups: one tracking the fast-money crowd (short-term traders), the other tracking the slow-money crowd (long-term investors and institutions). The interaction between these two groups — how they compress, separate, and cross — reveals trend strength, breakout potential, and reversal warnings that a simple golden cross could never capture.
Key Takeaways
- Daryl Guppy didn't invent exponential moving averages. What he did was ask a question nobody else had bothered with: can...
- The GMMA indicator plots twelve exponential moving averages divided into two color-coded ribbons. Getting the setup righ...
- The GMMA doesn't generate signals through a single crossover like a MACD histogram flip. Instead, it communicates throug...
1Daryl Guppy's Insight: Short-Term Traders vs Long-Term Investors
Daryl Guppy didn't invent exponential moving averages. What he did was ask a question nobody else had bothered with: can we separate the footprint of short-term speculators from that of long-term investors using the same chart? His answer, published in his 2001 book Trend Trading, was elegantly simple — plot two groups of EMAs and watch how they interact.
The insight rests on a behavioral observation. Short-term traders react to news, to candle patterns, to yesterday's close. They move in and out of positions within days or weeks. Long-term investors — pension funds, hedge funds building core positions, retail traders with multi-month holding periods — move on structural conviction. They don't flinch at a single bearish engulfing candle. When both groups agree on direction, trends run hard. When they disagree, the market stalls or reverses.
Guppy argued that traditional moving average crossover systems (the 50/200 golden cross, for example) lumped both groups together and lost this behavioral information in the process. A single crossover tells you the average changed direction. GMMA tells you who changed direction and how confident they are about it.
Why This Matters Practically
Imagine EUR/USD rallying for three weeks. A single 50-period EMA points upward — bullish, right? But within a GMMA framework, you might see the short-term group (the six fast EMAs) starting to compress and curl downward while the long-term group remains fanned wide and ascending. That tells you traders are taking profits, but investors haven't flinched. The likely outcome? A pullback within a continuing uptrend — a buy-the-dip opportunity, not a reversal signal.
Without GMMA, that same setup would look like a standard moving average flattening, giving you no clarity on whether the trend is pausing or dying. That distinction is where Guppy's contribution sits: not a new formula, but a new way to read market participants through overlapping EMAs.
Guppy's Background
Daryl Guppy is an Australian financial columnist, author, and international speaker who has written extensively on technical analysis for Asian and Australian markets. He developed GMMA specifically for the Australian stock market but the logic — separating fast-money behavior from slow-money behavior — translates directly to forex, commodities, and crypto. He has consistently emphasized that GMMA is not a mechanical system but a framework for understanding trend relationships. His original EMA settings have remained unchanged since publication because, as he's noted in interviews, attempts to 'optimize' them typically just curve-fit to past data without improving forward performance.
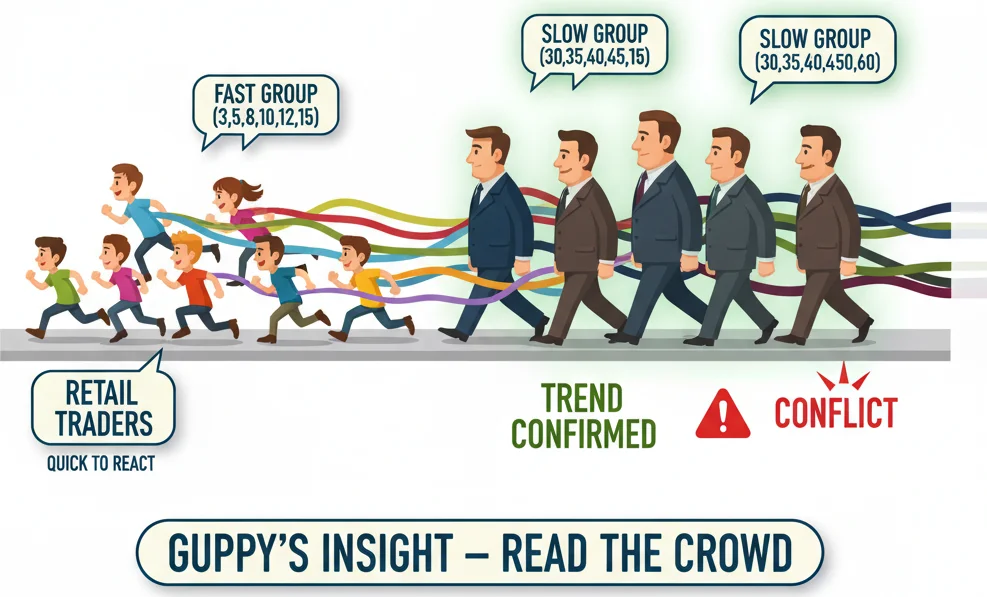
The fast group shows what retail traders are doing. The slow group reveals what the big money thinks. When they agree, follow.
2The Two Groups: 6 Fast EMAs and 6 Slow EMAs
The GMMA indicator plots twelve exponential moving averages divided into two color-coded ribbons. Getting the setup right takes about two minutes on MetaTrader 5, but understanding what each group represents is what separates signal from noise.
Short-Term Group (The Traders)
| EMA Period | Role | Reactivity |
|---|---|---|
| 3 | Ultra-fast noise filter | Reacts within 1-2 candles |
| 5 | Short-term momentum | Captures 3-5 candle swings |
| 8 | Near-term trend pulse | Standard scalping reference |
| 10 | Intraday bias line | Moderate sensitivity |
| 12 | Short swing midpoint | Balances noise vs signal |
| 15 | Trader group anchor | Slowest of the fast group |
These six EMAs form the fast ribbon. When they're tightly packed and sloping in one direction, short-term traders agree on the trend. When they spread apart, short-term conviction is strong — traders are piling in. When they compress and go flat, short-term participants are confused or sitting on the sidelines.
Long-Term Group (The Investors)
| EMA Period | Role | Reactivity |
|---|---|---|
| 30 | Institutional entry zone | 2-3 week perspective |
| 35 | Medium positioning line | Moderate institutional lag |
| 40 | Core trend indicator | Monthly trend reference |
| 45 | Deep trend structure | Filters weekly noise |
| 50 | Major trend anchor | Classic institutional MA |
| 60 | Strategic direction | Slowest, most stable line |
The long-term ribbon moves like a supertanker — slow to accelerate, slow to turn, but impossible to ignore once it commits to a direction. Wide separation within this group means institutional conviction is high. Compression means big players are uncertain or repositioning.
Setup on MetaTrader 5
Add twelve EMA indicators manually, assigning periods 3, 5, 8, 10, 12, 15 (color them green or blue) and 30, 35, 40, 45, 50, 60 (color them red or orange). Apply all to Close price. Some MT5 templates and custom indicators bundle all twelve into a single overlay — search for 'GMMA' in the MetaTrader marketplace or the MQL5 community.
Using Pulsar Terminal on MetaTrader 5, you can color-code each group for instant visual separation and set alerts when the two groups begin to converge — catching compression setups before they resolve into breakouts.
Why These Specific Periods?
Guppy chose periods where the step between consecutive EMAs is 2-3 for the short group and 5-10 for the long group. This creates even visual spacing within each ribbon without redundancy. The short-term group covers roughly 1-3 weeks of price action on daily charts; the long-term group covers 6-12 weeks. That gap between 15 and 30 — the 'no man's land' — is intentional. It creates visible separation between the two groups so you can instantly see whether they're converging, diverging, or crossed.

Six fast EMAs plus six slow EMAs - like building a layered cake of market sentiment!
“The GMMA doesn't generate signals through a single crossover like a MACD histogram flip.”
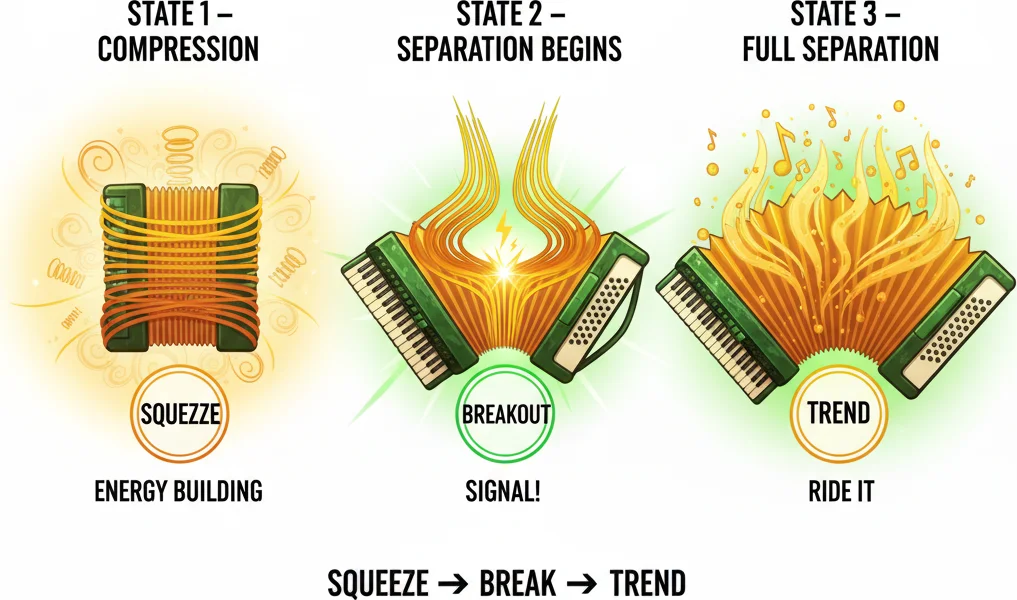
3Compression and Separation: The GMMA Buy/Sell Framework
The GMMA doesn't generate signals through a single crossover like a MACD histogram flip. Instead, it communicates through visual states — and the two most important states are compression and separation. Learning to read these is the core skill of GMMA trading.
State 1: Separation (Trending)
When the short-term group sits clearly above the long-term group with visible space between them, the trend is bullish. Flip it for bearish. The width of that gap directly correlates with trend strength — a gap of 60-80 pips between the groups on EUR/USD H4 indicates a strong, confident trend where both traders and investors agree on direction.
During separation, pullback entries are the highest-probability trades. Wait for the short-term group to compress (its six EMAs squeeze together) and dip toward the long-term group, then watch for the fast EMAs to fan out again in the trend direction. That fan-out is your entry signal — it means short-term traders are rejoining the trend after a pause.
State 2: Compression (Pre-Breakout)
When both groups squeeze together and the twelve EMAs become almost indistinguishable, the market is in a state of maximum indecision. Neither traders nor investors have directional conviction. This is the setup that breakout traders live for, because compression almost always resolves into expansion.
State 3: Crossover (Trend Change)
The short-term group crossing through the long-term group signals a potential trend reversal. But here's the nuance most guides miss: the quality of the crossover matters enormously.
| Crossover Quality | Long-Term Group Behavior | Signal Strength | Action |
|---|---|---|---|
| Strong bullish | Long-term group beginning to fan upward | High | Enter long with confidence |
| Moderate bullish | Long-term group flat, not yet turning | Medium | Enter with reduced size |
| Weak bullish | Long-term group still angled downward | Low | Wait for confirmation |
| False signal | Long-term group wide and trending opposite | Very low | Avoid — likely a pullback, not reversal |
The Buy Signal Checklist
- Both groups were previously compressed or the short-term group was below the long-term group
- The short-term group crosses above the long-term group
- The long-term group begins to flatten or turn upward (not still descending steeply)
- The short-term group fans out after the cross — individual EMAs spread apart
- Price closes above both groups on the signal candle
Reverse all five conditions for a sell signal.
The Sell/Exit Signal
Exit a long position when the short-term group compresses and crosses back below the long-term group, or when the long-term group itself begins to compress after a prolonged trend. That long-term compression is the early warning — it often appears 10-20 candles before the actual crossover, giving you time to tighten stops or take partial profits.
Practical Example: GBP/USD H4
Consider a scenario where GBP/USD has been trending upward on H4 for two weeks. The short-term group (green) sits 50 pips above the long-term group (red), both fanned wide. Then price pulls back — the green ribbon compresses and dips to within 10 pips of the red ribbon. The red ribbon stays fanned and ascending. On the next bullish candle, the green ribbon fans out upward again. This is a textbook pullback entry in a confirmed uptrend — risk defined by the top of the long-term group as your stop zone, with the trend structure fully intact.
Contrast this with a scenario where the red ribbon is also compressing during the pullback. That changes everything — now institutional conviction is fading, and the pullback might become a reversal. Same price action, completely different GMMA context.
When all 12 lines compress into a tight bundle, a big move is loading. When they fan out wide, the trend is in full swing.
4GMMA for Breakout Trading: Catching the Squeeze
If GMMA has a killer application, it's breakout detection. The compression-to-expansion cycle is visually obvious on the chart and gives traders a structural edge that single moving averages simply cannot provide.
The Compression Breakout Setup
A compression breakout occurs when all twelve EMAs converge into a tight cluster — sometimes within a range of just 10-20 pips on H4 — and then rapidly expand as price breaks out of the consolidation range. The power of this setup lies in the information it provides: when twelve moving averages covering periods from 3 to 60 all agree on approximately the same price level, the market has reached a point of absolute equilibrium. That equilibrium is unstable by nature — something has to give.
Step-by-Step Breakout Strategy
| Step | Action | What to Look For |
|---|---|---|
| 1 | Identify compression | All 12 EMAs within a narrow band, both groups intertwined |
| 2 | Wait for the candle | A strong candle that closes above (bullish) or below (bearish) the entire EMA cluster |
| 3 | Confirm with expansion | The short-term group must begin fanning out in the breakout direction |
| 4 | Enter on the close | Enter at the close of the breakout candle or on a slight pullback to the EMA cluster |
| 5 | Place stop-loss | Stop just beyond the opposite side of the EMA cluster |
| 6 | Trail with long-term group | Move stop to track the top (short) or bottom (long) of the long-term EMA group |
Why GMMA Squeezes Work
Compression reflects a balance between buyers and sellers across multiple timeframes simultaneously. When the 3-period EMA and the 60-period EMA sit at the same level, it means the price averaged over the last 3 candles equals the price averaged over the last 60 candles. That's a remarkable alignment that rarely persists. The breakout from this alignment tends to be directional and sustained because the equilibrium has been building pressure — like a coiled spring.
Filtering False Breakouts
Not every compression resolves cleanly. Approximately 30-40% of GMMA compressions on H4 forex charts produce false breakouts — the price breaks one direction, reverses, and breaks the other. Three filters help reduce false signals:
- Volume confirmation — If your broker provides tick volume, look for a volume spike on the breakout candle. A breakout without volume participation is suspect.
- Support/resistance alignment — If the compression occurs at a known daily support or resistance level, breakouts through that level carry more weight.
- ADX confirmation — An ADX reading below 20 during compression that begins rising above 20 during the breakout confirms that a new trend is emerging, not just a noise spike.
Timeframe Considerations for Breakout Trading
| Timeframe | Compression Duration | Typical Breakout Move | Stop Width |
|---|---|---|---|
| H1 | 8-20 candles | 30-60 pips (EUR/USD) | 15-25 pips |
| H4 | 5-15 candles | 80-200 pips (EUR/USD) | 30-50 pips |
| D1 | 5-20 candles | 200-500+ pips (EUR/USD) | 50-100 pips |
H4 is the sweet spot for most retail traders — the compression is visible enough to plan around, the breakout moves are large enough to justify the spread cost, and the false breakout rate is lower than on H1. On D1, GMMA compressions can take weeks to develop, but the resulting moves can define trading for an entire quarter.
Pulsar Terminal's alert system on MetaTrader 5 lets you set notifications when the distance between the fastest EMA (3) and the slowest EMA (60) drops below a threshold — effectively automating the compression detection so you don't have to watch paint dry waiting for the squeeze to form.
A Word of Caution
GMMA breakouts are not meant for choppy, range-bound markets where price oscillates within a 50-pip range for weeks. In those conditions, you'll see repeated compressions that resolve into tiny moves before compressing again. If the market has produced two or more false breakouts from GMMA compression within the same range, step aside until a higher-timeframe catalyst (economic event, central bank decision) provides the energy to break the range for real.

When GMMA ribbons squeeze together, breakout traders get ready to pounce!
“Traders who see twelve EMAs on a GMMA chart often compare it to the Ichimoku Cloud — another multi-line system that turns charts into something resembling abstract art.”
5GMMA vs Ichimoku: Two Multi-Line Systems Compared
Traders who see twelve EMAs on a GMMA chart often compare it to the Ichimoku Cloud — another multi-line system that turns charts into something resembling abstract art. Both tools aim to visualize trend structure at a glance, but they approach the problem from fundamentally different angles. Here's where they overlap, where they diverge, and when to use each.
Structural Comparison
| Feature | GMMA | Ichimoku Kinko Hyo |
|---|---|---|
| Number of lines | 12 EMAs | 5 components |
| Line type | All exponential moving averages | Moving average variants + displaced projections |
| Forward projection | None — purely reactive | Yes — Kumo cloud projects 26 periods ahead |
| Support/resistance | Dynamic (long-term EMA ribbon acts as zone) | Explicit (Kumo cloud defines S/R zones) |
| Participant insight | Separates traders from investors | No explicit participant segmentation |
| Momentum signals | Ribbon expansion/compression | Tenkan/Kijun cross, Chikou Span position |
| Default parameters | 12 fixed EMA periods | 9, 26, 52 (Tenkan, Kijun, Senkou B) |
| Visual complexity | Moderate (two colored ribbons) | High (cloud shading, displaced lines) |
| Learning curve | Low-medium | Medium-high |
Where GMMA Wins
GMMA excels at answering one specific question: who is driving this trend, and how committed are they? The separation between the two EMA groups gives an immediate, intuitive read on whether short-term speculation or long-term positioning dominates current price action. This is something Ichimoku simply doesn't address — its Tenkan/Kijun lines are both calculated from price extremes over fixed periods, without distinguishing participant behavior.
GMMA is also faster to learn. If you understand moving averages and can distinguish two color groups, you can read a GMMA chart in an afternoon. Ichimoku's five components, the displacement mechanics of the Kumo, and the lagging Chikou Span require significantly more study before they become intuitive.
Where Ichimoku Wins
Ichimoku's forward-projected cloud gives traders something GMMA cannot: a visual map of future support and resistance levels. The Kumo cloud projected 26 periods ahead shows where equilibrium will sit based on current data — useful for planning entries and exits at levels that don't yet exist on a purely reactive system like GMMA.
Ichimoku also provides clearer support and resistance zones through the cloud thickness. A thick Kumo indicates strong support or resistance; a thin Kumo signals vulnerability. GMMA's long-term ribbon acts as a dynamic support/resistance zone, but it doesn't project forward — you're always reacting, never anticipating.
When to Use Each
| Scenario | Better Tool | Why |
|---|---|---|
| Identifying who's driving the trend | GMMA | Two-group design separates trader vs investor behavior |
| Planning entries at future S/R levels | Ichimoku | Kumo cloud projects forward |
| Breakout trading from compression | GMMA | 12-EMA compression is a cleaner breakout signal |
| Multi-signal confirmation (trend + momentum + S/R) | Ichimoku | Five components give five independent signals |
| Quick trend assessment on any timeframe | GMMA | Two ribbons = instant read |
| Daily/weekly strategic positioning | Ichimoku | Originally designed for D1/W1 analysis |
Can You Combine Them?
Yes, but with caution. Running both simultaneously turns your chart into a 17-line spectacle that will make your eyes water — not exactly the 'equilibrium at a glance' that Hosoda intended when he named his system Ichimoku Kinko Hyo (literally, 'one glance equilibrium chart'). A more practical approach: use Ichimoku on the daily chart for strategic direction and Kumo-based support/resistance levels, then switch to GMMA on H4 for tactical entries based on ribbon compression and crossover signals. That gives you the forward-projection benefit of Ichimoku without cluttering your execution chart.
The Bottom Line
GMMA is a behavioral tool — it answers who is doing what. Ichimoku is a structural tool — it maps where price equilibrium sits now and where it will be. Neither replaces the other. If you trade primarily on momentum and trend-following, GMMA will feel more natural. If you build strategies around support/resistance and multi-timeframe confirmation, Ichimoku gives you more to work with. And if you can't decide, there's always the option of twelve EMAs, a cloud, and a very wide monitor.

Both use multiple lines to read the market. GMMA focuses on crowd behavior. Ichimoku focuses on equilibrium and time.
Frequently Asked Questions
Q1What are the default GMMA EMA settings?
The GMMA uses twelve EMAs in two groups. The short-term group uses periods 3, 5, 8, 10, 12, and 15. The long-term group uses periods 30, 35, 40, 45, 50, and 60. All are applied to the close price. Daryl Guppy has maintained these settings since the indicator's creation, and backtesting has consistently shown they perform as well as or better than 'optimized' alternatives.
Q2What is the best timeframe for GMMA trading?
H4 is the most practical timeframe for most retail forex traders using GMMA. Crossover signals are meaningful without being excessively rare, trend separation is visually clear, and breakout moves from compression setups are large enough to justify transaction costs. D1 is better for position traders who want to capture multi-week trends, while H1 works as a trend filter but generates too many crossover signals for reliable standalone use.
Q3How do I identify a GMMA buy signal?
A GMMA buy signal occurs when three conditions align: the short-term EMA group (3-15) crosses above the long-term EMA group (30-60), the long-term group is flat or beginning to turn upward (not still falling steeply), and the short-term group fans out after the cross, with its individual EMAs spreading apart. A crossover where the long-term group remains compressed and descending is a weak signal that often fails.
Q4Does GMMA work in ranging or sideways markets?
No, and this is its primary limitation. In sideways markets, the two EMA groups repeatedly cross each other and intertwine, generating false signals. If both groups are flat and tangled, the market lacks a trend and GMMA cannot help you. Wait for a clean compression-to-expansion setup or use a range-trading indicator like RSI or Bollinger Bands until a trend re-establishes itself.
Q5Can GMMA be used with other indicators for confirmation?
Yes, and it should be. GMMA is a trend-identification tool, not a complete trading system. Common pairings include ADX (to confirm trend strength during breakouts, with ADX above 20-25 validating the move), RSI (to avoid entering overbought or oversold conditions within a GMMA-confirmed trend), and volume indicators (to verify that breakouts from compression have real participation behind them). Support and resistance levels from daily charts also improve entry timing significantly.
Top Brokers
About the Author
Daniel Harrington
Senior Trading Analyst
Daniel Harrington is a Senior Trading Analyst with a MScF (Master of Science in Finance) specializing in quantitative asset and risk management. With over 12 years of experience in forex and derivatives markets, he covers MT5 platform optimization, algorithmic trading strategies, and practical insights for retail traders.
Use This Indicator
Risk Disclaimer
Trading financial instruments carries significant risk and may not be suitable for all investors. Past performance does not guarantee future results. This content is for educational purposes only and should not be considered investment advice. Always conduct your own research before trading.