Historical Volatility (HV) Indicator: Measuring Past Price Swings for Future Trades
Historical Volatility calculates the annualized standard deviation of logarithmic returns, providing a statistical measure of past price dispersion for risk assessment.

Daniel Harrington
Senior Trading Analyst · MT5 Specialist
☕ 18 min read
Settings — HV
| Category | volatility |
| Default Period | 20 |
| Best Timeframes | H4, D1, W1 |
Every price chart tells a story about direction. But direction is only half the picture — the other half is intensity. Historical Volatility (HV) quantifies that intensity by measuring how violently (or calmly) price has been moving over a defined lookback period. It doesn't care whether price went up or down. It only cares how far and how fast things swung. That makes HV the market's pulse monitor: a flat line means a sleepy, range-bound instrument that's barely twitching, while a spiking reading screams that something big just happened — or is about to. For forex traders on MetaTrader 5, HV is especially useful for calibrating stop-loss distances, filtering breakout trades, and understanding whether current market conditions call for trend-following or mean-reversion tactics. If your trading plan doesn't account for volatility regime, you're essentially driving without checking the weather forecast.
Key Takeaways
- Let's start with a misconception that trips up a surprising number of traders: Historical Volatility does not measure di...
- If the word "logarithm" makes you want to close this tab, hang tight — the math is actually friendlier than it sounds. H...
- Here's the problem with raw HV numbers: 15% annualized volatility on EUR/USD is high. The same 15% on Bitcoin is practic...
1What Historical Volatility Actually Measures (And What It Doesn't)
Let's start with a misconception that trips up a surprising number of traders: Historical Volatility does not measure direction. A stock that rallied 15% in a straight line and a stock that crashed 15% in a straight line can produce identical HV readings. HV is purely about the magnitude of price fluctuations — how wide the swings are, regardless of whether they're swings up or swings down.
Technically, HV measures the dispersion of returns around their average over a specified period. The standard lookback is 20 periods (roughly one trading month on daily charts), though you'll see traders use 10, 30, 50, or even 100 depending on their timeframe and strategy. The output is expressed as an annualized percentage — so when you see HV reading 25%, it means the instrument has been fluctuating at a pace that, if sustained for a full year, would produce a standard deviation of 25% in price.
Here's what HV tells you at a practical level:
| HV Reading | Market Behavior | Trading Implication |
|---|---|---|
| Low (below 10%) | Quiet, compressed ranges | Expect a breakout eventually; tighten stops |
| Moderate (10-20%) | Normal trading conditions | Standard strategy parameters work |
| High (20-40%) | Active, wide-swinging market | Widen stops, reduce position size |
| Extreme (40%+) | Crisis or event-driven chaos | Consider stepping aside or hedging |
These ranges are approximate and vary by instrument. EUR/USD typically hovers around 6-10% HV in calm periods and might spike to 15-20% during central bank surprises. Gold tends to run hotter, with baseline HV around 12-18%. Bitcoin? Don't even ask — its "calm" HV reading would be a panic signal on most forex pairs.
What HV does NOT tell you:
- Direction. HV can be elevated during a rally or a crash equally. A rising HV doesn't mean bearish, and a falling HV doesn't mean bullish.
- Future volatility. HV is entirely backward-looking. It tells you what already happened. It's a rearview mirror, not a crystal ball. (That's where implied volatility enters the picture — more on that in Section 5.)
- Specific price levels. HV gives you a statistical range, not precise support and resistance. A 20% annualized HV suggests roughly a 1.25% daily standard deviation, but it won't tell you whether the next swing hits 1.0850 or 1.0870.
- Cause. HV spikes after the fact. By the time you see HV rising, the event (earnings, NFP, rate decision) has usually already occurred. HV confirms volatility; it doesn't predict the catalyst.
Why does this matter for your actual trading? Because HV is a calibration tool, not a signal generator. You don't buy or sell because HV hit a certain number. Instead, you use HV to adjust your existing strategy: wider stops when HV is elevated, tighter stops when it's compressed, larger position sizes in low-volatility environments (where risk per pip is smaller), and smaller sizes when things get wild.
One more thing worth understanding: HV is instrument-specific. Comparing HV readings across different assets is perfectly valid and actually very useful. If you're scanning your watchlist and see EUR/USD at 7% HV while GBP/JPY sits at 14%, you immediately know which pair offers more movement potential — and which one demands more respect in your risk management. Think of HV as a speedometer. It doesn't tell you where the car is going, but it tells you how fast it's traveling. And driving 120 km/h requires a different approach than cruising at 40.
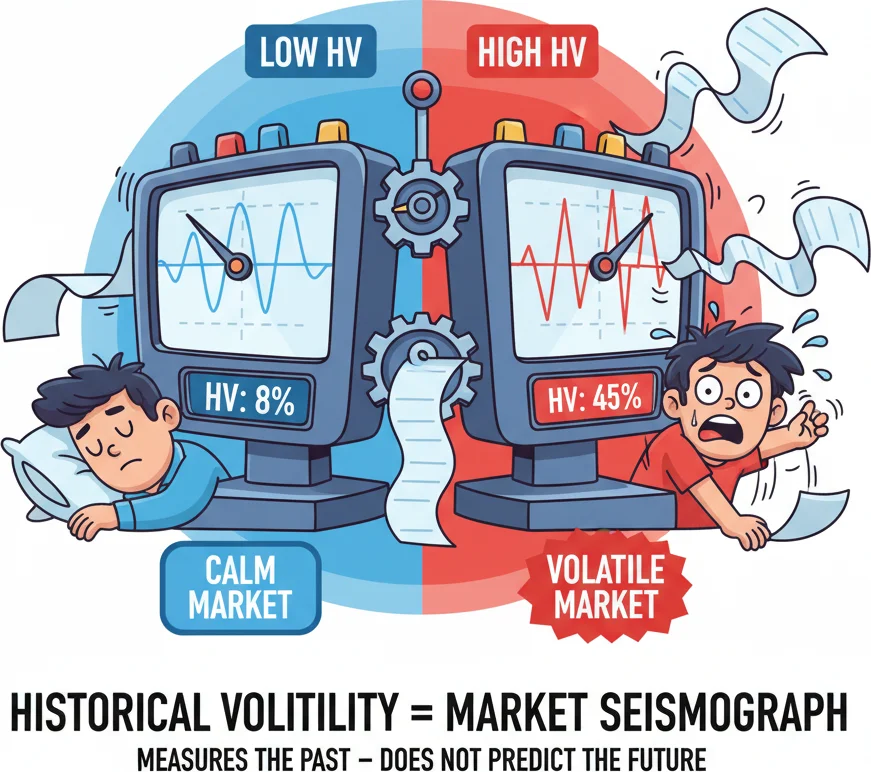
HV is a seismograph for the market — it measures how violently price has been shaking over the last N days.
2The HV Formula: Standard Deviation of Log Returns, Annualized
If the word "logarithm" makes you want to close this tab, hang tight — the math is actually friendlier than it sounds. Historical Volatility uses logarithmic returns instead of simple percentage returns for a specific mathematical reason, and the entire calculation boils down to three steps.
Step 1: Calculate daily log returns.
For each day (or candle), compute the natural logarithm of the ratio between today's close and yesterday's close:
R = ln(Close_today / Close_yesterday)
Why logarithms instead of simple percentage change? Two reasons. First, log returns are symmetric — a move from 100 to 110 and back to 100 produces log returns that perfectly cancel out, while simple returns don't (10% up, then 9.09% down). Second, log returns are additive across time, which makes the annualization step mathematically clean. It's a technical preference, but it's the industry standard for volatility calculations.
For a concrete example: if EUR/USD closes at 1.0850 today and closed at 1.0820 yesterday, the log return is ln(1.0850 / 1.0820) = ln(1.002773) = 0.002769, or about 0.277%.
Step 2: Calculate the standard deviation of those log returns.
Take the last N log returns (where N is your lookback period, typically 20) and compute their sample standard deviation. This gives you the period volatility — how much daily returns have been dispersing around their mean.
The standard deviation formula is the familiar one: square root of the average squared deviations from the mean. Most platforms compute this automatically, so you'll rarely need to do it by hand. But for reference:
sigma = sqrt( (1/(N-1)) x SUM( (Ri - R_mean)^2 ) )
Note the (N-1) denominator — that's the sample standard deviation (Bessel's correction), which is what virtually every platform uses.
Step 3: Annualize.
Multiply the daily standard deviation by the square root of 252 (the typical number of trading days per year for stocks and forex):
HV = sigma_daily x sqrt(252)
The square root of 252 is approximately 15.87, which many traders round to 16 — hence the famous "Rule of 16." If you know the daily standard deviation, just multiply by 16 to get a rough annualized volatility. Conversely, if someone quotes a 16% annualized volatility, you know daily moves average about 1% (16 / 16).
| Step | Formula | Example (EUR/USD, 20-day) |
|---|---|---|
| 1. Log returns | R = ln(Close_t / Close_t-1) | 20 daily values like +0.28%, -0.15%, +0.41%... |
| 2. Standard deviation | sigma = stdev(R1...R20) | 0.0042 (0.42% daily) |
| 3. Annualize | HV = sigma x sqrt(252) | 0.0042 x 15.87 = 6.67% annualized |
Period adjustments for different timeframes:
The sqrt(252) multiplier assumes daily data. If you're computing HV on weekly candles, use sqrt(52). For monthly candles, sqrt(12). For crypto markets that trade 365 days a year, use sqrt(365) instead of sqrt(252). Getting this multiplier wrong is one of the most common mistakes — it inflates or deflates your HV reading and throws off every decision downstream.
| Data Frequency | Annualization Factor | Approximate Value |
|---|---|---|
| Daily (stocks/forex) | sqrt(252) | 15.87 |
| Daily (crypto, 24/7) | sqrt(365) | 19.10 |
| Weekly | sqrt(52) | 7.21 |
| Monthly | sqrt(12) | 3.46 |
Lookback period selection:
The default 20-period HV measures roughly one month of trading activity on daily charts. This is the most commonly used setting and the one most platforms default to. But different lookback periods serve different purposes:
- 10-day HV captures very recent volatility. It's reactive and spiky — useful for short-term traders who need to know what's happening right now, but it's noisy.
- 20-day HV (default) balances responsiveness with stability. This is the workhorse setting for most forex traders.
- 50-day HV smooths out short-term spikes and gives you a better read on the prevailing volatility regime.
- 100-day HV is a long-term baseline. Comparing 20-day HV to 100-day HV tells you whether current volatility is above or below its longer-term norm — essentially a volatility mean-reversion setup.
On MetaTrader 5, the built-in Standard Deviation indicator computes step 2 for you. Some custom indicators on the MQL5 marketplace package the full HV calculation (log returns + annualization) into a single indicator. On TradingView, search for "Historical Volatility" and you'll find several well-maintained open-source versions that handle the complete formula.
A practical sanity check: if your HV indicator is showing EUR/USD at 45% annualized, something is wrong — either the annualization factor is incorrect, the data includes gaps, or the period is set to something unusual. EUR/USD hasn't sustained 45% HV outside of the 2008 financial crisis. Knowing the typical HV range for your instrument helps you catch configuration errors before they affect your trading decisions.
When you realize HV involves natural logarithms and square roots - it's not just price changes!
“Here's the problem with raw HV numbers: 15% annualized volatility on EUR/USD is high.”
3HV Percentile Ranking: Is Current Volatility High or Low?
Here's the problem with raw HV numbers: 15% annualized volatility on EUR/USD is high. The same 15% on Bitcoin is practically a nap. And 15% on a small-cap stock might be completely average. Raw HV values are only meaningful in context, which is why smart traders convert HV into a percentile ranking before making decisions.
The HV Percentile answers one simple question: over the past year, what percentage of days had lower HV than today's reading? If the HV Percentile is 85%, it means current volatility is higher than 85% of all readings over the past 252 trading days. If it's 12%, volatility is near its annual floor.
The calculation is straightforward:
HV Percentile = (Number of days in the past year with HV lower than today's HV) / 252 x 100
So if today's 20-day HV is 8.5% and only 30 out of the last 252 daily HV readings were below 8.5%, the percentile is 30/252 = 11.9%. That tells you current volatility is very low by this instrument's own standards.
| HV Percentile | Interpretation | Typical Market State |
|---|---|---|
| 0-20% | Extremely low volatility | Deep compression, pre-breakout |
| 20-40% | Below average | Quiet trending or consolidation |
| 40-60% | Normal | Balanced conditions |
| 60-80% | Above average | Active market, event aftermath |
| 80-100% | Extremely high volatility | Crisis, major event, or trend climax |
Why is this more useful than raw HV? Because it's self-calibrating. A 10% HV reading might be extreme for EUR/CHF but completely normal for GBP/JPY. The percentile normalizes everything to a 0-100 scale relative to each instrument's own behavior. Now you can compare volatility states across your entire watchlist on equal footing.
HV Percentile vs HV Rank — a distinction worth knowing:
These two terms get confused constantly, even in professional circles. They measure different things:
- HV Percentile counts what percentage of past readings fall below the current one. It answers: "How often was volatility lower than this?"
- HV Rank measures where today's HV falls between the 52-week high and low. Formula: (Current HV - 52-week Low HV) / (52-week High HV - 52-week Low HV) x 100. It answers: "Where is current HV relative to its range?"
| Metric | What It Measures | Sensitive To |
|---|---|---|
| HV Percentile | Frequency of lower readings | Distribution of all past readings |
| HV Rank | Position within min-max range | Only the extreme high and low values |
The practical difference: HV Rank can be distorted by a single outlier spike. If there was one day in the past year where HV spiked to 40% during a flash crash, HV Rank will compress all normal readings into the bottom of the scale, making everything look "low rank" even when volatility is moderately elevated. HV Percentile is more robust because it considers the full distribution, not just the extremes. Most options traders prefer percentile over rank for this reason, and the same logic applies to forex volatility analysis.
Practical application — scanning for opportunities:
HV Percentile becomes a powerful scanning filter when you're looking for the next big move. Markets oscillate between periods of compression (low HV Percentile) and expansion (high HV Percentile) with remarkable regularity. The cycle goes: low volatility breeds complacency, ranges tighten, and then a catalyst triggers an explosive breakout. After the explosion, volatility peaks, exhaustion sets in, and the market gradually returns to compression. Rinse, repeat.
A weekly scan of your watchlist sorted by HV Percentile reveals instruments that are primed for regime change. Pairs sitting below the 15th percentile have been unusually quiet for an unusually long time — these are compression candidates where a breakout trade makes the most sense. Pairs above the 85th percentile are in volatility spikes that historically don't sustain — these are mean-reversion candidates where fading extremes becomes viable.
On TradingView, you can build this scan using Pine Script or use one of the community indicators that calculate HV Percentile automatically. On MetaTrader 5, you'll likely need a custom indicator from the MQL5 marketplace — the built-in tools don't natively compute percentile rankings. Either way, adding a single HV Percentile column to your watchlist is one of the highest-value improvements you can make to your market analysis workflow.
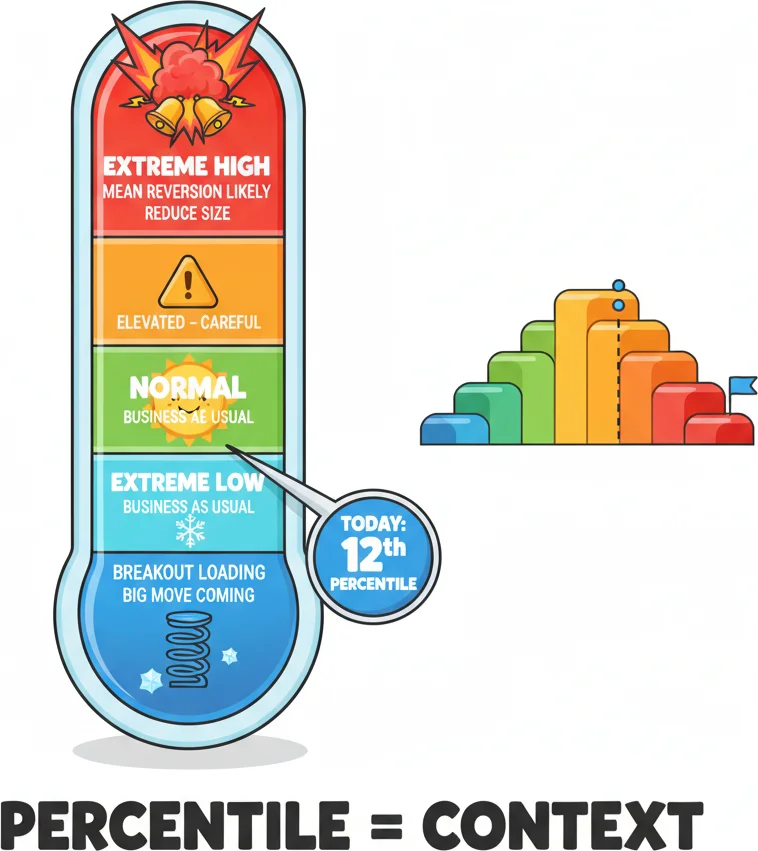
HV of 15% means nothing alone. HV at the 5th percentile of its 1-year range? That means a storm is coming.
4Trading the Volatility Cycle: Low HV → Breakout, High HV → Mean Reversion
Volatility is cyclical. Not in the neat, predictable way that sunrise and sunset are cyclical, but in a statistical pattern that shows up across every liquid market, every timeframe, and every decade of data you care to examine. The pattern: volatility clusters and mean-reverts. Periods of low volatility tend to be followed by explosions. Periods of high volatility tend to be followed by contractions. This is one of the most well-documented phenomena in quantitative finance, and it's the backbone of how institutional traders use HV.
The volatility cycle has four phases:
| Phase | HV Behavior | Price Behavior | Strategy |
|---|---|---|---|
| 1. Compression | HV falling, near 52-week lows | Tight range, declining ATR | Prepare breakout entries |
| 2. Expansion | HV rising sharply | Breakout underway, wide candles | Ride the trend, trail stops |
| 3. Peak | HV at extreme highs | Climax moves, exhaustion bars | Begin scaling out |
| 4. Contraction | HV falling from peak | Ranges narrowing, pullbacks | Mean reversion, range strategies |
Phase 1 — Compression: the setup.
When HV drops into the lowest quintile of its annual range (below the 20th percentile), the market is telling you it has been unusually quiet. On the daily chart, you'll see this as narrowing Bollinger Bands, declining ATR, and small-bodied candles clustering together. This is boring to watch — like waiting for water to boil. It's also the highest-opportunity phase for breakout traders.
The compression-to-breakout trade is simple in concept: identify an instrument with extremely low HV, define the range boundaries (the consolidation high and low), and place entries just outside those boundaries. When the breakout happens — and statistically, it will — the initial move tends to be violent because the low-volatility period compressed price like a spring.
Consider a scenario: a major pair consolidates in a 250-pip range for several weeks on the daily chart. 20-day HV drops to around 6%, well below its 12-month average of 11%. This compression signals that a breakout is loading — though it gives no hint about direction. When the catalyst arrives (central bank surprise, geopolitical shock), the pair explodes through the range boundary and runs 300+ pips in days. Traders who had breakout orders positioned at the range edges caught the move. Those who waited for HV to actually rise missed the first leg.
The key: enter during compression, not after expansion has already started. HV confirms the breakout after the fact. You want to be positioned before it.
Phase 2 — Expansion: ride it.
Once HV starts rising from compressed levels, you're in the expansion phase. This is where trends develop their strongest momentum. The correct approach here is to stay with your breakout position and use trailing stops to capture the move. Don't try to predict where the expansion will stop — volatility expansions regularly overshoot what seems reasonable.
A practical trailing method during volatility expansion: trail your stop at 2x the current ATR below the most recent swing low (for longs). As ATR expands, your stop automatically gives the trade more breathing room. This prevents getting shaken out by the wider candles that naturally accompany higher volatility.
Phase 3 — Peak: prepare the exit.
When HV reaches extreme highs (above the 80th percentile), the expansion is mature. This doesn't mean the trend is over — trends can persist through peak volatility — but it means the easy part is done. New entries at this stage carry higher risk because: stop distances are wide (expensive to be wrong), reversals when they come are equally violent, and the volatility itself tends to mean-revert, which can stall a trend.
Scale out of existing positions during peak HV. Take partial profits and move stops to breakeven on the remainder. If you're a swing trader, this is not the time to be initiating fresh directional trades unless you have an extremely compelling setup with tight risk.
Phase 4 — Contraction: mean reversion territory.
After HV peaks, it contracts. This is where mean-reversion strategies shine. The market is transitioning from trending to ranging, and the wide swings from the expansion phase are narrowing back toward the mean.
Mean reversion during contraction works like this: after a major volatility spike pushes price far from its moving averages, bet on a return toward the average as volatility normalizes. Use Bollinger Bands (which are built on standard deviation — closely related to HV) to identify stretch levels. When price is 2+ standard deviations from the 20 SMA and HV is declining from a peak, fading the extreme becomes a high-probability trade.
Combining HV with Bollinger Bands — a natural pairing:
Bollinger Bands literally plot standard deviations around a moving average, so they're a visual representation of volatility on the price chart itself. When HV is low, bands are narrow. When HV is high, bands are wide. You can use HV as a filter and Bollinger Bands as the entry trigger:
- Low HV + Bollinger squeeze: Prepare for breakout. Enter when price closes outside the bands with expanding volume.
- High HV + price touching outer band: Prepare for mean reversion. Enter when price reverses from the outer band with declining HV.
This isn't a Holy Grail — no volatility strategy is. But aligning your strategy type with the current volatility regime is one of the simplest ways to improve your win rate. A breakout strategy in a compression environment and a mean-reversion strategy in a peak environment give you the statistical wind at your back.

High volatility traders moving fast into mean reversion setups before the cycle shifts again.
“If you trade forex and have never touched an options contract, you might wonder why you should care about implied volatility.”
5Historical Volatility vs Implied Volatility: The Options Connection
If you trade forex and have never touched an options contract, you might wonder why you should care about implied volatility. The short answer: because the difference between Historical Volatility and Implied Volatility is one of the most tradeable relationships in all of finance — and it affects spot forex markets too, not just options.
Historical Volatility (HV) looks backward. It tells you how much price actually moved over the past N periods. It's realized, observable, and factual.
Implied Volatility (IV) looks forward. It's derived from the current price of options contracts and represents the market's collective expectation of how much price will move in the future. IV is not calculated from price data — it's extracted from option prices using models like Black-Scholes. Think of it as reverse-engineering the volatility number that would justify the current option premium.
| Feature | Historical Volatility (HV) | Implied Volatility (IV) |
|---|---|---|
| Time direction | Backward-looking | Forward-looking |
| Based on | Actual price movements | Option market prices |
| Calculation | Standard deviation of log returns | Derived from option pricing models |
| Tells you | What happened | What the market expects |
| Changes when | Past data window shifts | Trader sentiment shifts |
The HV-IV spread: where the edge lives.
The difference between IV and HV (called the volatility risk premium) is one of the most studied metrics in quantitative finance. Here's the general pattern: IV tends to overestimate future realized volatility. Options are usually priced slightly too expensive relative to what actually happens. This is because traders pay a premium for protection against uncertainty, similar to how insurance premiums are always higher than expected losses.
This creates a persistent signal for all traders:
- IV much higher than HV: The market is pricing in more volatility than recent history justifies. Options are "expensive." If you're an options trader, this favors selling premium (short strangles, iron condors). If you're a spot trader, it suggests the market expects a big move that hasn't materialized yet — a potential catalyst (NFP, FOMC, earnings) is likely approaching.
- IV much lower than HV: The market expects calmer conditions than what recently occurred. Options are "cheap." For spot traders, this can signal complacency — the market may be underpricing upcoming risk.
- IV approximately equal to HV: Fair pricing. No particular edge from the volatility spread.
Why spot forex traders should care:
Even if you never trade options, the HV-IV relationship affects you. When IV spikes ahead of events like Non-Farm Payrolls or central bank rate decisions, it tells you the market is bracing for a significant move. If IV is elevated but HV is still low, the move hasn't happened yet — you're in the pre-event compression phase we discussed in Section 4. This is actionable intelligence for positioning breakout trades.
Conversely, after a major event, IV typically collapses (the famous "volatility crush") while HV may still be elevated from the actual price swing. This divergence signals that the market considers the event resolved and expects calmer conditions ahead — useful context for switching to mean-reversion strategies.
The VIX — the most famous IV gauge:
The CBOE Volatility Index (VIX) is implied volatility applied to S&P 500 options. When financial media references "the fear gauge," they're talking about IV on equity options. Forex doesn't have a single equivalent, but JPMorgan's G7 Volatility Index serves a similar purpose for major currency pairs. On a practical level, you can access currency-specific IV data through your broker's options chain or through services that publish forex IV curves.
A practical framework for combining HV and IV:
- Check HV Percentile to understand the current volatility regime (Section 3).
- Compare current IV to current HV. If IV exceeds HV by a significant margin, the market is pricing in an upcoming event.
- If HV is low AND IV is spiking, prepare for a breakout — the market expects something to happen.
- If HV is high AND IV is dropping, the event has passed — transition to mean-reversion mode.
- If both HV and IV are low, conditions are calm and may stay calm. Range-bound strategies are appropriate.
This HV-IV framework doesn't replace your technical analysis — it adds a dimension of market expectation that pure price charts can't provide. You're combining what has happened (HV) with what the market thinks will happen (IV) to make better-informed decisions about strategy selection, position sizing, and risk management.
One final thought: in a market where everyone has access to the same indicators, the same support and resistance levels, and the same chart patterns, understanding volatility regime and the HV-IV relationship is a genuine differentiator. Most retail traders never look beyond price and a few momentum oscillators. Adding volatility analysis to your toolkit puts you closer to how institutional desks think about markets — and that's never a bad neighborhood to move into.
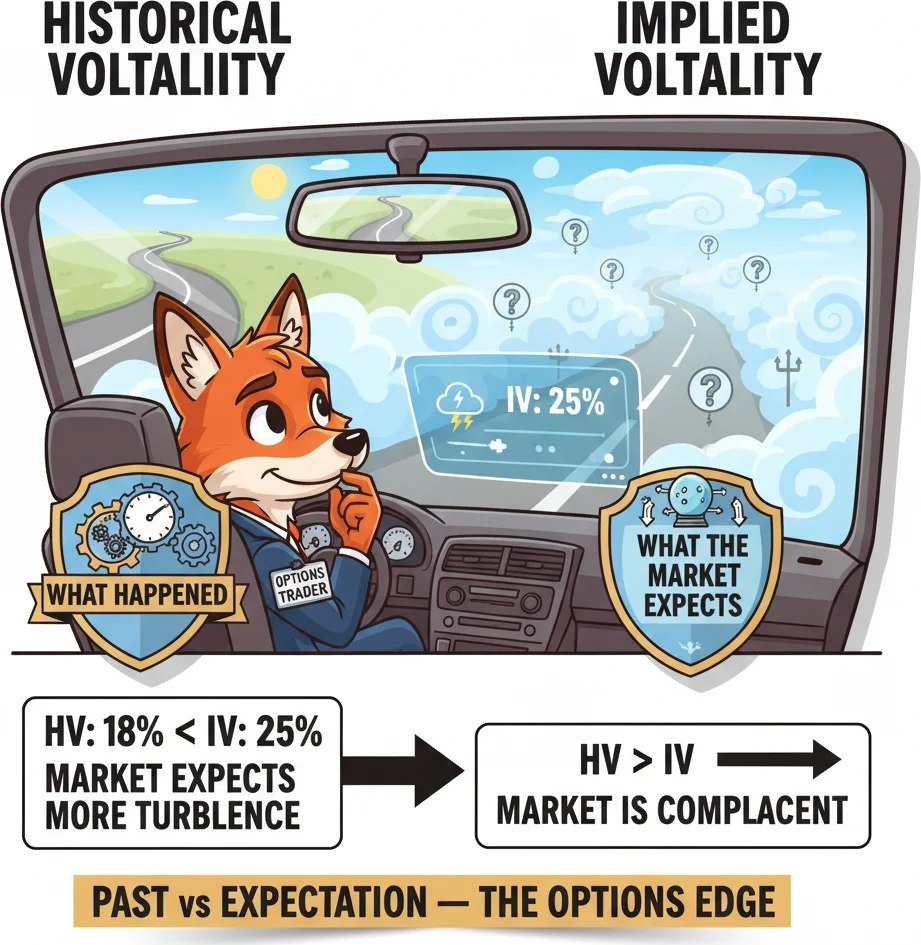
HV looks in the rearview mirror. IV looks through the windshield. Options traders compare both to find edge.
Frequently Asked Questions
Q1What is a good default period setting for Historical Volatility?
The standard default is 20 periods on a daily chart, which covers roughly one trading month. This setting balances responsiveness with stability and is the most widely used across professional and retail platforms. For shorter-term analysis on H4 or H1 charts, some traders reduce the period to 10. For longer-term regime analysis, 50 or 100 periods provide a smoother baseline. Whatever period you choose, keep it consistent — switching periods constantly makes it impossible to build intuition about what normal readings look like for your instruments.
Q2Why does Historical Volatility use logarithmic returns instead of simple percentage returns?
Logarithmic returns have two mathematical properties that make them ideal for volatility calculations. First, they're symmetric: a move from 100 to 110 and back to 100 produces log returns that cancel out perfectly, while simple returns don't (10% up, then 9.09% down). Second, log returns are additive across time periods, which makes the annualization step (multiplying by the square root of time) mathematically valid. For typical forex movements (fractions of a percent daily), the difference between log and simple returns is negligible, but the convention exists for mathematical correctness.
Q3Can I use Historical Volatility to set stop-loss and take-profit distances?
Yes, and this is one of HV's most practical applications. If 20-day HV is 10% annualized, the expected daily standard deviation is roughly 10% divided by 16 (the Rule of 16), which gives about 0.625%. For EUR/USD at 1.0850, that translates to about 68 pips per day as one standard deviation of movement. Setting your stop-loss at 1.5 to 2 times this daily range gives your trade room to breathe within normal market noise. When HV rises, widen stops and reduce position size. When HV drops, tighten stops and potentially increase size.
Q4What is the difference between Historical Volatility and Average True Range (ATR)?
Both measure volatility, but they use different methods. HV calculates the standard deviation of logarithmic returns — a statistical measure of dispersion expressed as an annualized percentage. ATR averages the true range (the largest of high-low, high-previous close, and low-previous close) over N periods — producing a value in absolute price units (pips for forex). ATR is simpler and more intuitive for setting stop distances. HV is better for comparing volatility across instruments, understanding volatility regimes, and interfacing with the options market. Many traders use both: ATR for tactical trade management and HV for strategic market analysis.
Q5Does high Historical Volatility mean the market is about to crash?
No. High HV simply means price has been making large moves recently — those moves can be up, down, or both. A strong uptrend with large daily gains produces high HV just as a selloff does. That said, extremely high HV readings (above the 90th percentile) do tend to cluster around market stress events, because fear drives wider swings than greed in most markets. The practical takeaway is not to panic when HV spikes, but to adjust your position sizing downward and widen your stops to accommodate the larger swings. High HV also tends to mean-revert, so it's often a poor time to initiate new trend-following positions.
Top Brokers
About the Author
Daniel Harrington
Senior Trading Analyst
Daniel Harrington is a Senior Trading Analyst with a MScF (Master of Science in Finance) specializing in quantitative asset and risk management. With over 12 years of experience in forex and derivatives markets, he covers MT5 platform optimization, algorithmic trading strategies, and practical insights for retail traders.
Use This Indicator
Risk Disclaimer
Trading financial instruments carries significant risk and may not be suitable for all investors. Past performance does not guarantee future results. This content is for educational purposes only and should not be considered investment advice. Always conduct your own research before trading.