Kagi Charts: Master This Japanese Filtering System for Cleaner Trades
Kagi charts use a series of vertical lines that change direction and thickness based on price reversals, filtering noise to reveal underlying supply and demand dynamics.

Daniel Harrington
Senior Trading Analyst · MT5 Specialist
☕ 10 min read
Settings — Kagi
| Category | custom |
| Default Period | null |
| Best Timeframes | H4, D1 |
While most traders stare at candlesticks cluttered with every price wiggle, Japanese rice merchants 150 years ago invented something far more elegant: Kagi charts that only show you what actually matters. These unique charts ignore time completely and only draw new lines when price moves by your specified reversal amount, creating a crystal-clear picture of supply and demand battles. Think of Kagi as your market's noise-canceling headphones—suddenly you can hear the real trend music underneath all that chaotic static.
Key Takeaways
- Kagi charts operate on a beautifully simple principle that makes candlestick analysis look unnecessarily complicated. In...
- The reversal amount is your Kagi chart's heartbeat—set it wrong, and you'll either get overwhelmed with noise or miss im...
- Now for the practical stuff—specific setups that consistently produce profitable trades when you combine Kagi signals wi...
1The Ancient Art of Yang and Yin Lines
Kagi charts operate on a beautifully simple principle that makes candlestick analysis look unnecessarily complicated. Instead of plotting every tick within a time period, Kagi only cares about significant price movements—specifically, moves that exceed your chosen reversal amount.
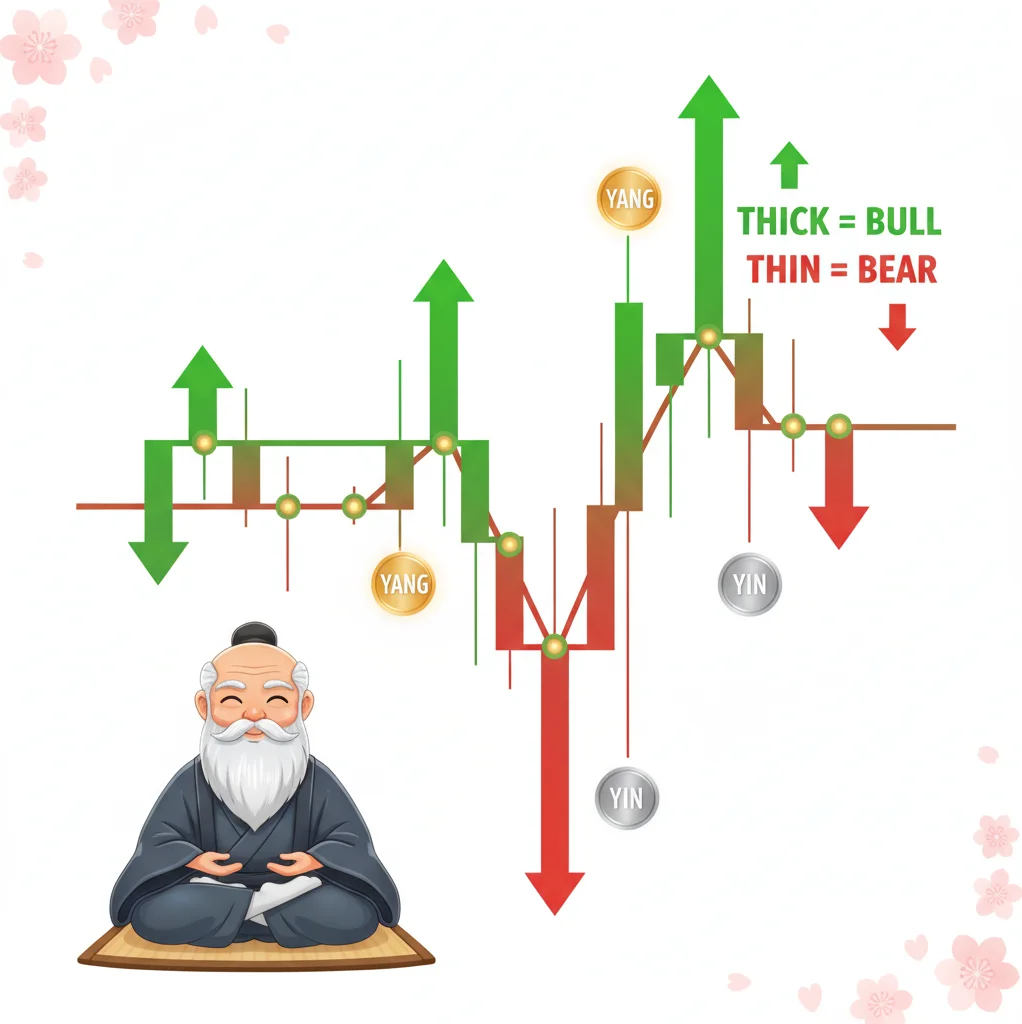
Here's how the magic works: When price moves in the current direction, the Kagi line extends in that same direction. But when price reverses by your specified amount (say 20 pips on EUR/USD), the chart draws a new line in the opposite direction. These lines come in two flavors that sound like a martial arts lesson: Yang lines (thick, usually green) represent upward price movement, while Yin lines (thin, usually red) show downward movement.
The real beauty emerges in the transitions. When a Yin line breaks above the previous Yang line's high, it transforms into a Yang line—this is called a "Yang conversion" and signals potential bullish momentum. Conversely, when a Yang line drops below the previous Yin line's low, it becomes a Yin line in a "Yin conversion," suggesting bearish pressure.
Let's say you're trading GBP/USD with a 25-pip reversal amount. Price climbs from 1.2500 to 1.2580 (Yang line), then pulls back to 1.2555 (still Yang since it hasn't reversed 25 pips), then surges to 1.2620 (Yang extends). Only when price drops to 1.2595 or lower would you see a Yin conversion, creating that crucial shift in the chart's structure.
This filtering effect removes the emotional whipsaws that plague traditional time-based charts. No more getting stopped out by 5-minute noise or second-guessing every small pullback. Kagi forces you to think in terms of significant price swings, naturally aligning your mindset with the market's actual rhythm rather than arbitrary time intervals.
2Mastering Reversal Amounts for Different Currency Pairs
The reversal amount is your Kagi chart's heartbeat—set it wrong, and you'll either get overwhelmed with noise or miss important moves entirely. This isn't a one-size-fits-all game; each currency pair demands its own calibration based on average daily ranges and volatility characteristics.
For major pairs like EUR/USD and GBP/USD, start with reversal amounts between 15-30 pips for intraday trading. EUR/USD's typically lower volatility means 15-20 pips often works well, while GBP/USD's wider swings might require 25-30 pips to filter out noise effectively. Here's a practical approach: Calculate your pair's average hourly range over the past 20 days, then use 20-25% of that figure as your starting reversal amount.
| Currency Pair | Suggested Reversal Amount | Reasoning |
|---|---|---|
| EUR/USD | 15-20 pips | Lower volatility, tight spreads |
| GBP/USD | 25-30 pips | Higher volatility, wider daily ranges |
| USD/JPY | 20-25 pips | Moderate volatility, trending tendency |
| AUD/USD | 20-30 pips | Commodity-driven volatility |
| USD/CAD | 25-35 pips | Oil correlation creates wider swings |
For exotic pairs, you'll need larger reversal amounts—sometimes 50-100 pips—to account for their naturally wider spreads and volatile nature. The key is testing: if your Kagi chart looks like a hyperactive seismograph, increase the reversal amount. If it barely moves during active market sessions, decrease it.
Timeframe considerations matter too. Scalpers might use 5-10 pip reversals on majors, while swing traders could employ 50-100 pip reversals to capture longer-term directional moves. The beautiful part about Kagi is that once you find the right reversal amount for your trading style, the charts become remarkably consistent in their behavior patterns.
Don't forget to adjust for market conditions. During high-impact news events or unusual volatility periods, temporarily increasing your reversal amount can prevent false signals from temporary market chaos.
Fine-tuning your reversal amounts is like tuning a radio - get it just right for crystal clear signals.
“Now for the practical stuff—specific setups that consistently produce profitable trades when you combine Kagi signals with proper risk management.”
3Three High-Probability Kagi Trading Setups
Now for the practical stuff—specific setups that consistently produce profitable trades when you combine Kagi signals with proper risk management. These aren't theoretical concepts; they're battle-tested patterns that work across different market conditions.
Setup 1: The Yang Conversion Breakout This occurs when a Yin line breaks above the previous Yang line's high, converting to Yang status. It's essentially Kagi's version of a breakout signal. On EUR/USD with a 20-pip reversal, you might see price drop from 1.0850 to 1.0800 (creating a Yin line), then reverse and break above 1.0850. The moment it hits 1.0851, you have a Yang conversion—time to consider a long position.
Entry: 2-3 pips above the conversion level Stop Loss: Below the recent Yin line's low Target: Next significant resistance or 2:1 risk-reward ratio
Setup 2: The Multiple Shoulder Pattern Kagi charts create "shoulders" when lines change direction at similar price levels. When you see three or more shoulders forming at roughly the same level, you're looking at a significant support or resistance zone. This is particularly powerful on GBP/USD during London session.
For instance, if Kagi lines keep reversing around 1.2650 level three times over several sessions, that's your shoulder pattern. Trade the fourth test: if price approaches from below, go long with stops below the shoulder level. If approaching from above, short with stops above.
Setup 3: The Yin-Yang Acceleration This pattern emerges when Yang and Yin conversions happen in quick succession with increasing line lengths, indicating accelerating momentum. You'll often see this during trend continuation phases or after major news releases.
Watch for a series where each new line extends further than the previous one in the same direction. For example, on USD/JPY: Yang line extends 40 pips, converts to Yin for 25 pips, then Yang conversion extends 60 pips. This acceleration often precedes strong directional moves.
The key with all Kagi setups is confirmation. Never trade a conversion signal alone—combine it with support/resistance levels, market session timing, or complementary indicators. And remember, Kagi works best in trending markets; during choppy, sideways conditions, reduce position sizes or step aside entirely.
4Common Kagi Mistakes That Kill Trading Accounts
Even experienced traders stumble when first using Kagi charts, usually because they bring candlestick thinking to a completely different analytical framework. Let's address the most account-damaging mistakes so you can sidestep these expensive learning experiences.
Mistake 1: Treating Every Conversion as a Trade Signal This is the big one. New Kagi users see a Yang or Yin conversion and immediately hit the buy/sell button, thinking they've found some magical entry system. Reality check: conversions are directional hints, not trade triggers. During choppy markets, you can get multiple false conversions that whipsaw your account into oblivion.
Solution: Use conversions as alerts, not signals. Combine them with other confluence factors like key support/resistance levels, market session timing, or momentum indicators. A Yang conversion at previous resistance carries much more weight than one happening in the middle of nowhere.
Mistake 2: Using the Same Reversal Amount Across All Market Conditions Markets aren't static, but many traders set their Kagi reversal amount once and forget about it. During low-volatility Asian sessions, your usual 25-pip EUR/USD reversal might barely register any movement. During NFP releases, it might create a confusing mess of rapid conversions.
Solution: Develop multiple Kagi templates. Use smaller reversals (10-15 pips) during quiet periods and larger ones (35-50 pips) during high-impact news or volatile sessions. Think of it like changing camera lenses—wide angle for the big picture, zoom for the details.
Mistake 3: Ignoring Time Context Completely While Kagi charts filter out time-based noise, completely ignoring session times and market hours is trading suicide. A Yang conversion during thin Friday afternoon trading means something entirely different than one during Tuesday London open.
| Trading Session | Kagi Reliability | Key Considerations |
|---|---|---|
| Asian Session | Lower | Smaller ranges, fewer conversions |
| London Open | High | Strong directional moves |
| NY-London Overlap | Highest | Best conversion signals |
| NY Close | Moderate | Watch for position adjustments |
Mistake 4: Overcomplicating with Multiple Indicators Kagi's beauty lies in its simplicity, but traders love to complicate things. Adding RSI, MACD, Bollinger Bands, and three moving averages to a Kagi chart defeats the entire purpose of noise filtering.
Solution: Keep it simple. If you must add indicators, limit yourself to one or two at most. Support/resistance levels and volume work well with Kagi. Everything else is usually overkill.
Mistake 5: Wrong Position Sizing for Kagi Signals Kagi signals often have wider stop losses than traditional setups because you're trading significant price moves, not quick scalps. Using the same position size you'd use for a 10-pip stop on a 40-pip Kagi stop is a recipe for blown accounts.
Adjust your position sizing to maintain consistent dollar risk, regardless of stop distance. If your normal EUR/USD trade risks $100 with a 20-pip stop, a Kagi setup with a 40-pip stop should use half the position size to maintain that same $100 risk.

When you ignore Kagi's filtering wisdom and overtrade every tiny reversal - boom goes your account.
“Once you've mastered basic Kagi concepts and avoided the common pitfalls, these advanced techniques can give you the edge that separates consistently profitable traders from the crowd.”
5Advanced Kagi Techniques for Professional Edge
Once you've mastered basic Kagi concepts and avoided the common pitfalls, these advanced techniques can give you the edge that separates consistently profitable traders from the crowd. These aren't beginner strategies—they require solid understanding of market dynamics and disciplined execution.
Multi-Timeframe Kagi Analysis This technique involves running multiple Kagi charts with different reversal amounts simultaneously to capture both micro and macro market structure. Set up three Kagi charts: short-term (10-15 pip reversals), medium-term (25-30 pips), and long-term (50-75 pips).
The magic happens when all three timeframes align. For instance, on GBP/USD: your long-term Kagi shows a Yang line trending higher, medium-term just converted to Yang, and short-term is approaching a Yang conversion. This triple alignment often precedes strong directional moves lasting several hours or days.
Conversely, when your timeframes conflict—long-term Yang but short-term stuck in Yin—it suggests consolidation or potential reversal. Use these conflicts to reduce position sizes or avoid new entries entirely.
Kagi Momentum Divergence This advanced pattern occurs when price makes new highs/lows but the Kagi line extensions become progressively shorter, indicating weakening momentum. Unlike traditional divergence with oscillators, Kagi momentum divergence is purely price-based and often more reliable.
Look for this pattern: EUR/USD makes a new high at 1.0950 with a 45-pip Yang extension, then another high at 1.0980 but only a 25-pip Yang extension, followed by 1.0990 with just a 15-pip extension. Despite higher prices, the weakening Kagi momentum suggests an impending reversal.
Volume-Weighted Kagi Reversals For platforms that support it, adjusting your Kagi reversal amounts based on volume can dramatically improve signal quality. During high-volume periods (London open, major news), increase your reversal amount by 25-50% to avoid false signals from temporary volatility spikes.
| Volume Condition | Reversal Adjustment | Reasoning |
|---|---|---|
| High Volume (>150% avg) | +40% reversal amount | Filter volatility noise |
| Normal Volume (75-150% avg) | Standard reversal | Optimal signal generation |
| Low Volume (<75% avg) | -25% reversal amount | Capture subtle moves |
Kagi Support/Resistance Zones Advanced traders use Kagi shoulder levels to create dynamic support and resistance zones rather than static lines. When multiple Kagi lines reverse at similar price levels over time, these become high-probability zones for future price reactions.
Create a "Kagi heat map" by marking every reversal level over the past 50-100 Kagi lines. Areas with three or more reversals within 10-15 pips become your key zones. These zones often prove more reliable than traditional horizontal support/resistance because they're based on actual market turning points, not just visual chart patterns.
The Kagi Breakout Confirmation System This technique uses Kagi conversions to confirm traditional breakout setups on regular candlestick charts. When you spot a potential breakout on your main chart, switch to Kagi view with a 20-30 pip reversal. Only take the breakout trade if Kagi confirms with a clean conversion in the breakout direction.
For example, USD/JPY breaks above 145.00 resistance on your candlestick chart. Before entering, check your Kagi chart—if it shows a clean Yang conversion above the breakout level with no immediate reversals, your breakout has much higher probability of success.
These advanced techniques require practice and patience to master, but they can significantly improve your trading edge once incorporated systematically into your approach.
Frequently Asked Questions
Q1What's the best reversal amount setting for EUR/USD day trading?
For EUR/USD day trading, start with 15-20 pip reversal amounts during normal market conditions. This typically filters out minor noise while capturing meaningful price moves. During high-impact news events, consider increasing to 25-30 pips to avoid false signals from temporary volatility spikes. Test your chosen setting for at least two weeks before making adjustments, as Kagi charts need time to reveal their true pattern effectiveness.
Q2How do Kagi charts compare to Renko charts for forex trading?
Both Kagi and Renko filter time-based noise, but they work differently. Renko creates uniform brick sizes and only moves when price closes beyond the brick, while Kagi uses variable line lengths and responds to intraday price movements exceeding your reversal amount. Kagi tends to be more sensitive to market momentum changes, making it better for trend-following strategies. Renko provides clearer support/resistance levels but may lag during rapid market moves. Many traders find Kagi superior for volatile pairs like GBP/USD, while Renko works well for steadier pairs like EUR/CHF.
Q3Can I use Kagi charts for scalping strategies?
Yes, but with important modifications. Use smaller reversal amounts (5-10 pips for majors) and focus on Yang/Yin conversions during high-volume sessions like London open or NY-London overlap. The key is matching your reversal amount to typical scalping profit targets—if you're targeting 8-pip profits, don't use 15-pip reversals. However, remember that Kagi's strength lies in filtering noise, which somewhat contradicts scalping's quick-trigger nature. Most successful Kagi scalpers use it as a directional filter rather than a primary entry signal.
Q4Why does my Kagi chart sometimes show no movement for hours?
This happens when your reversal amount is too large for current market conditions, or when you're trading during low-volatility sessions like Asian afternoon hours. If EUR/USD is only moving 20 pips total during Asian session and you've set a 25-pip reversal, the Kagi chart won't update until price moves significantly. This isn't a bug—it's a feature showing that no meaningful directional moves are occurring. Consider using smaller reversal amounts during quiet sessions or simply wait for more active trading periods when your current settings will be more responsive.
Q5How do I handle Kagi signals during major news releases?
Major news creates unique challenges for Kagi charts due to rapid price swings and potential gap movements. Temporarily increase your reversal amount by 50-100% during high-impact events like NFP, FOMC, or ECB announcements to avoid false conversions from initial volatility spikes. Wait for the first 15-30 minutes after the news release before trusting Kagi signals, as this allows the market to digest the information and establish a clearer direction. Many successful Kagi traders simply avoid trading for 30 minutes post-news, then resume with normal reversal settings once volatility stabilizes.
Top Brokers
About the Author
Daniel Harrington
Senior Trading Analyst
Daniel Harrington is a Senior Trading Analyst with a MScF (Master of Science in Finance) specializing in quantitative asset and risk management. With over 12 years of experience in forex and derivatives markets, he covers MT5 platform optimization, algorithmic trading strategies, and practical insights for retail traders.
Use This Indicator
Risk Disclaimer
Trading financial instruments carries significant risk and may not be suitable for all investors. Past performance does not guarantee future results. This content is for educational purposes only and should not be considered investment advice. Always conduct your own research before trading.