Simple Moving Average (SMA) Indicator: Settings, Signals & Trading Strategy
SMA calculates the arithmetic mean of closing prices over a specified period, smoothing price data to identify the direction of a trend.

Daniel Harrington
Senior Trading Analyst · MT5 Specialist
☕ 15 min read
Settings — SMA
| Category | trend |
| Default Period | 20 |
| Best Timeframes | H1, H4, D1 |
Here's something that should bother every trader obsessed with the latest AI-powered indicator: the Simple Moving Average — a tool you could calculate with a pencil and napkin — still sits on more institutional trading desks than any machine-learning algorithm ever built. Charles Dow was sketching moving averages in the early 1900s, and over a century later, the 200-day SMA remains the single most watched line in global finance. That kind of staying power isn't luck. It's the market telling you something worth listening to.
Key Takeaways
- The Simple Moving Average has a biography most indicators would envy. Its roots trace back to 18th-century mathematician...
- If you've ever watched financial news during a market selloff, you've probably heard an anchor say the words "death cros...
- Every trading forum has this debate on repeat: should you use the SMA or the EMA? The Exponential Moving Average weights...
1Why the SMA Still Matters After 100 Years
The Simple Moving Average has a biography most indicators would envy. Its roots trace back to 18th-century mathematicians analyzing population data, but it entered the financial world through Charles Dow himself — the man whose name still adorns the most famous stock index on the planet. Dow used moving averages to filter the noise from stock price movements in the early 1900s, and the basic idea hasn't changed since: add up a set of closing prices, divide by the number of periods, and you get a smoothed line that reveals the underlying trend.
The formula is almost embarrassingly simple: SMA = (P1 + P2 + ... + Pn) / n. With a 20-period SMA, you sum the last 20 closing prices and divide by 20. Every time a new candle closes, the oldest price drops out and the newest one enters. That rolling window is what creates the smooth curve on your chart.
So why hasn't something better replaced it? Three reasons.
First, simplicity breeds universality. Because the SMA is so easy to understand, everyone uses it — from a retail trader in Jakarta to a quant desk in London. When millions of participants watch the same 200-day SMA on the S&P 500, that line becomes a self-fulfilling prophecy. Price bounces off the 200 SMA not because of some mystical force, but because enough traders place orders around it.
Second, equal weighting is actually a feature, not a bug. The SMA gives the same importance to a price from 19 days ago as it does to yesterday's close. Critics call this "lag." Experienced traders call it "noise filtering." In a market full of false breakouts and stop hunts, a line that doesn't flinch at every spike has genuine value. A study published in the Journal of Financial Economics found that SMA crossover rules generated statistically significant returns in forex markets over multi-decade samples — a finding that launched decades of academic debate.
Third, institutional muscle. The 50-day and 200-day SMAs aren't just retail favorites. Hedge funds, pension funds, and central bank analysts reference them in official reports. When the Federal Reserve publishes financial stability assessments, the language around equity markets often implicitly references price behavior relative to long-term moving averages. Bloomberg terminals display SMAs by default. That institutional adoption creates a feedback loop: the more participants watch a level, the more significant it becomes.
The SMA also serves as the backbone of other indicators. Bollinger Bands use a 20-period SMA as their center line. The MACD, while based on EMAs, owes its conceptual framework to SMA crossover logic. Even modern algorithmic systems frequently incorporate SMA filters as baseline trend validators before applying more complex models.
Is the SMA perfect? Not remotely. It lags, it's slow to react to reversals, and it generates painful whipsaw signals in ranging markets. But perfection was never the point. The SMA's job is to answer one question with reasonable reliability: which direction is the trend moving? After a century of trying, nobody has found a dramatically better answer to that question using a single line on a chart.
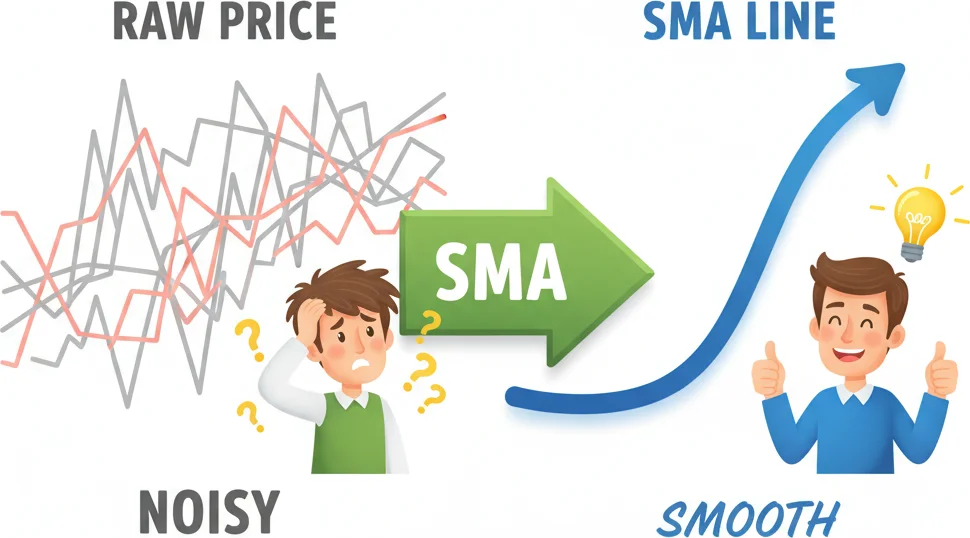
The SMA takes chaotic price action and reveals the hidden trend underneath — like noise-cancelling headphones for your chart.
2The Golden Cross and Death Cross: Signals That Move Markets
If you've ever watched financial news during a market selloff, you've probably heard an anchor say the words "death cross" in the same ominous tone usually reserved for natural disasters. The Golden Cross and Death Cross are the SMA's most famous signals — and arguably the most widely reported technical patterns in all of finance.
The setup is straightforward. A Golden Cross occurs when the 50-day SMA crosses above the 200-day SMA. A Death Cross is the reverse — the 50-day crosses below the 200-day. That's it. No complex formula, no adjustable parameters. Just two lines crossing.
But the market impact is real. When the S&P 500 formed a Golden Cross in March 2023, it preceded a rally of over 15% in the following six months. When a Death Cross appeared on Bitcoin's daily chart in January 2022, the asset went on to lose more than 50% of its value over the next ten months. These aren't cherry-picked examples — they're the patterns that make headlines precisely because institutional money pays attention to them.
How reliable are these signals statistically? Research from Schaeffer's Investment Research covering 1970 to 2009 found that Golden Crosses had a success rate of approximately 64% in predicting further upside. Death Crosses performed slightly better at predicting continued declines, with success rates around 71%. A separate analysis by VectorVest found more conservative numbers — roughly 61% for Golden Crosses and 62% for Death Crosses. Either way, the edge is real but modest.
The more interesting data point: according to analysis by Quantifiable Edges, strategies based on the 50/200-day SMA crossover averaged gains of 7.43% over 40 trading days following a signal. That's a meaningful edge when applied consistently across hundreds of trades.
Here's the catch that every new trader needs to understand: these signals lag. By the time the 50-day SMA crosses the 200-day, a significant portion of the move has already happened. The Golden Cross doesn't predict the bottom — it confirms that a new uptrend is underway. The Death Cross doesn't call the top — it confirms that momentum has shifted decisively bearish.
This lag creates the classic dilemma. If you wait for confirmation, you miss the first chunk of the move. If you act before the cross completes, you're gambling on a pattern that hasn't fully formed. The practical solution most professional traders use: treat the cross as a directional bias filter, not an entry signal.
Here's how that works on EUR/USD. Suppose the daily chart shows a Golden Cross forming — the 50 SMA is approaching the 200 SMA from below, and both are starting to slope upward. Rather than buying the moment the lines cross, you drop to H4 or H1 and look for pullback entries in the direction of the cross. A bounce off the 20-period SMA on H1, combined with a bullish candlestick pattern, gives you a precise entry within the broader Golden Cross context.
Volume matters too. Signals accompanied by above-average volume are substantially more trustworthy than those forming during thin trading sessions. A Golden Cross during London-New York overlap carries more weight than one completing during the Asian session lull.
False signals occur roughly 35% of the time, which means blind trading of every cross will bleed your account through whipsaws. The fix is confirmation: wait for the cross, then wait for price to respect the new trend direction on a lower timeframe before committing capital.
| Signal | Setup | Historical Win Rate | Typical Lag |
|---|---|---|---|
| Golden Cross | 50 SMA crosses above 200 SMA | 61-64% | 2-4 weeks after trend start |
| Death Cross | 50 SMA crosses below 200 SMA | 62-71% | 2-4 weeks after trend start |
| False Signal Rate | Either direction | ~35% | — |

When the Golden Cross hits and suddenly everyone's a trend following genius.
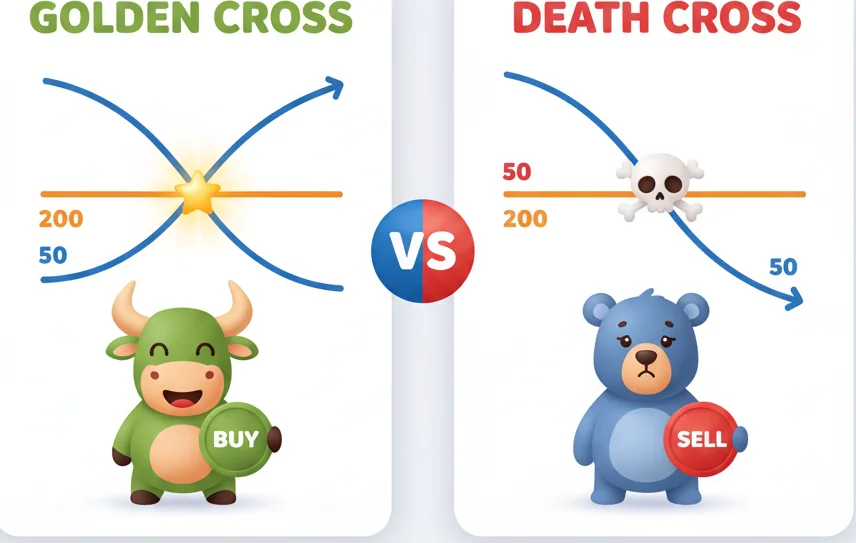
The Golden Cross and Death Cross are the two most famous signals in all of technical analysis — when the 50-day SMA crosses the 200-day, the market pays attention.
“Every trading forum has this debate on repeat: should you use the SMA or the EMA? The Exponential Moving Average weights recent prices more heavily, making it react faster to new information.”
3SMA vs EMA: When Slow Beats Fast
Every trading forum has this debate on repeat: should you use the SMA or the EMA? The Exponential Moving Average weights recent prices more heavily, making it react faster to new information. The SMA treats all prices equally, making it smoother but slower. On paper, faster sounds better. In practice, it depends entirely on what you're trying to do.
The core mechanical difference comes down to one thing: how each handles old data. In a 20-period SMA, a price from 19 bars ago has exactly the same influence as yesterday's close — each contributes 5% to the average. In a 20-period EMA, yesterday's close contributes about 9.5%, while older prices decay exponentially. After 20 periods, a single price event carries less than 13% of its original weight in the EMA versus a flat 5% in the SMA.
This means the EMA catches trend changes 30-40% faster than an equivalent SMA in trending markets. That sounds like a clear win — until you consider what happens in choppy, sideways conditions. The EMA's sensitivity becomes a liability. It whips back and forth with every minor price fluctuation, generating false signals that the SMA's equal weighting calmly ignores.
Here's the scenario where slow beats fast. Imagine GBP/JPY on the H4 chart, grinding sideways in a 200-pip range for three weeks. During that consolidation, a 50-period EMA will cross above and below its own signal line multiple times, generating at least 4-6 false crossover signals. A 50-period SMA during the same period stays relatively flat, giving you zero misleading crosses. When the actual breakout finally arrives, the SMA confirms it with a clean, decisive move — a single signal worth trading, instead of a dozen that weren't.
The data backs this up. Research from multiple backtesting studies shows that EMA-based crossover signals produced approximately 35-45% more false signals than SMA-based crossovers during range-bound market conditions. In trending conditions, the EMA's speed advantage translates to roughly 2.5% higher annual returns on average. The question is whether those extra returns survive the additional losses from whipsaws.
| Factor | SMA | EMA |
|---|---|---|
| Weighting | Equal for all periods | Heavier on recent prices |
| Lag | Higher | Lower |
| False signals (ranging) | Fewer | More (35-45% more) |
| Trend detection speed | Slower | Faster (30-40%) |
| Best for | Swing/position trading, D1/H4 | Scalping/day trading, M15/H1 |
| Noise filtering | Superior | Moderate |
| Institutional use | 50/200 SMA standard | MACD, short-term systems |
So when should you specifically choose the SMA over the EMA?
Use the SMA when you're trading higher timeframes (H4 and Daily). The daily chart already filters out intraday noise, so the EMA's speed advantage shrinks while its whipsaw problem persists. The 50-day and 200-day SMAs are the institutional standard for a reason — they provide clean, widely-watched levels that function as genuine support and resistance.
Use the SMA when your strategy relies on moving averages as support/resistance levels rather than crossover signals. The SMA's smoother line creates a more reliable "floor" or "ceiling" for price bounces. On EUR/USD daily charts, the 200-period SMA has acted as support or resistance in roughly 70% of retests over the past five years.
Use the SMA when you want fewer, higher-quality signals. If you'd rather miss the first 20% of a move and catch the remaining 80% with higher confidence, the SMA's lag is working for you, not against you.
Use the EMA when speed genuinely matters — scalping on M15, catching intraday momentum shifts on H1, or when your system explicitly needs fast reaction (like MACD-based strategies).
The smartest approach? Use both. Apply a long-period SMA (50 or 200) on your higher timeframe to define the macro trend, then use a shorter EMA (9 or 20) on your entry timeframe to time precise entries. The SMA tells you where to look. The EMA tells you when to act. Together, they cover each other's weaknesses.

The SMA is the tortoise — it filters noise and catches the big moves. The EMA is the hare — fast but prone to false signals in choppy markets.
4The Best SMA Settings Nobody Talks About
Ask ten traders for the "best" SMA setting and you'll get ten different answers — usually 20, 50, or 200. Those are fine defaults. But the settings that actually give you an edge are more nuanced than a single number, and they depend heavily on your timeframe.
Let's start with something most guides skip: why certain numbers work has nothing to do with mathematics and everything to do with crowd behavior. The 200-day SMA works because everyone watches it. The 50-day SMA works because it's the institutional medium-term benchmark. The 21-period SMA works on daily charts because there are approximately 21 trading days in a month — it's literally calculating your monthly average price. These aren't magic numbers. They're consensus numbers, and consensus creates liquidity around those levels.
Here's the timeframe breakdown with settings that actually matter in practice:
Daily Charts (D1) — The Institutional Playground
The trio to watch: 21, 50, and 200-period SMAs. The 21 SMA tracks monthly trend momentum. The 50 SMA is the swing trader's compass — widely watched by institutional desks and cited in broker research notes. The 200 SMA is the line in the sand. When EUR/USD trades above its 200-day SMA, the broad consensus is bullish. Below it, bearish. Simple as that.
The setting nobody talks about on D1: the 100-period SMA. It sits perfectly between the 50 and 200, catching intermediate trend shifts that the 50 misses and the 200 is too slow to register. On GBP/USD during 2023-2024, the 100-day SMA provided cleaner bounce entries than either the 50 or the 200 during extended pullbacks within the broader uptrend.
H4 Charts — The Swing Trader's Sweet Spot
The default 20-period SMA on H4 represents approximately 3.3 trading days — a useful short-term momentum gauge. But the real workhorse on H4 is the 50-period SMA, which covers roughly 8 trading days and captures the weekly trend direction. Pair it with the 200-period SMA on H4 (about 33 trading days) for a complete picture.
The overlooked H4 setting: 84 periods. Why 84? Because 84 H4 candles equal 21 daily candles — one trading month. This cross-timeframe alignment means your H4 SMA is tracking the same information as the 21-day SMA on the daily chart, giving you monthly trend context without switching timeframes.
H1 Charts — Intraday Precision
On H1, the 20-period SMA tracks intraday momentum across roughly one trading session. The 50-period H1 SMA covers about two days of price action and serves as a reliable dynamic support/resistance level. The 200-period SMA on H1 captures roughly 8 trading days — effectively your weekly trend filter.
The H1 trick: use a 48-period SMA. That's 48 hours of trading — exactly two full 24-hour forex sessions. It captures the two-day cycle that many currency pairs exhibit around major economic releases and gives you a cleaner trend filter than the standard 50.
Quick Reference Table
| Timeframe | Fast SMA | Medium SMA | Slow SMA | Hidden Gem |
|---|---|---|---|---|
| D1 | 21 (monthly) | 50 (institutional) | 200 (macro trend) | 100 (intermediate) |
| H4 | 20 (3.3 days) | 50 (8 days) | 200 (33 days) | 84 (= 21 daily) |
| H1 | 20 (1 session) | 50 (2 days) | 200 (8 days) | 48 (2 full sessions) |
Pair-Specific Adjustments
Volatile pairs like GBP/JPY or GBP/NZD benefit from slightly longer SMA periods — try 25 instead of 20, or 55 instead of 50. The extra smoothing reduces false signals caused by wider candle ranges. Quieter pairs like EUR/CHF or USD/CHF can use standard or even slightly shorter periods since there's less noise to filter.
Here's the uncomfortable truth about SMA optimization: the difference between a 20 and a 21-period SMA is statistically negligible across any meaningful sample size. The difference between having a clear system and not having one is enormous. Pick settings that make logical sense for your timeframe, understand what time horizon each period represents, and then stop tweaking. The edge comes from consistent application, not from finding the perfect number.

Finding the perfect SMA settings is like tuning a radio - small adjustments, big results.
“After watching hundreds of trading journals and forum posts, the same three SMA mistakes come up with predictable regularity.”
5Three Common SMA Mistakes (and How to Avoid Them)
After watching hundreds of trading journals and forum posts, the same three SMA mistakes come up with predictable regularity. They're not complicated errors — which is exactly why they're so persistent. Simple tools invite simple misuse.
Mistake 1: Using the SMA in Ranging Markets
This is the big one. The SMA is a trend-following indicator. It answers the question "which direction is price generally moving?" When price isn't moving in any direction — which, inconveniently, describes roughly 60-70% of total market time across major forex pairs — the SMA becomes actively misleading.
Here's what happens. EUR/USD enters a 100-pip consolidation range on H1. The 20-period SMA flattens out and starts weaving through the middle of the range. Price crosses above the SMA, you go long. Price immediately reverses, crosses below the SMA, you go short. Price reverses again. You're now two losses deep and the SMA has told you nothing useful — because there was nothing to tell. No trend means no trend signal.
The fix: before acting on any SMA signal, confirm that a trend actually exists. The simplest method is visual — is the SMA sloping clearly up or down, or is it flat? If it's flat, step away. For a more systematic approach, add the ADX indicator. An ADX reading above 25 generally confirms enough trend strength for SMA signals to carry meaningful statistical validity. Below 20, you're in chop territory and the SMA is generating noise.
Mistake 2: Placing Stop-Losses Directly on the SMA Line
New traders learn that the 50-period SMA acts as support in an uptrend. So they go long on a bounce and place their stop-loss one pip below the SMA. Then they watch in disbelief as price wicks 15 pips through the SMA, triggers their stop, and immediately bounces back in their intended direction. This happens so often it has a name in trading circles: a "stop hunt."
The SMA is a zone, not a line. On any given candle, price routinely penetrates 10-20 pips beyond the SMA on major pairs before respecting the level. Placing your stop directly on the SMA is like parking your car exactly on the edge of a cliff and being surprised when it falls.
The fix: give your stop-loss breathing room. A practical approach is to place the stop 1-1.5x the Average True Range (ATR) below the SMA for long trades, or above it for shorts. On EUR/USD H1, where the 14-period ATR typically reads 15-25 pips, that means your stop sits 20-35 pips away from the SMA — far enough to survive normal wick penetration while still invalidating the setup if the level genuinely breaks.
Here's a concrete example. You're trading GBP/USD on H4 and the price pulls back to the 50-period SMA at 1.2650. The 14-period ATR on H4 reads 40 pips. You enter long at 1.2650 with a stop-loss at 1.2600 (50 pips below — 1.25x ATR below the SMA). Your target is the previous swing high at 1.2780, giving you a 1:2.6 risk-reward ratio. The price wicks down to 1.2625 — 25 pips through the SMA — then reverses and hits your target. Without the ATR buffer, you'd have been stopped out.
Mistake 3: Using Too Many SMAs at Once
There's a specific stage in every trader's development where the chart looks like a bowl of spaghetti. Five moving averages in different colors, each with a slightly different period, all generating conflicting signals. The 20 SMA says buy, the 30 SMA says sell, the 50 SMA is flat, and the trader is paralyzed.
More lines don't equal more information. After two or three SMAs on a single timeframe, each additional line adds redundancy, not clarity. The 20-period and 25-period SMAs will almost always agree. The 50-period and 55-period will almost always agree. Stacking similar periods together creates the illusion of confirmation when you're really just reading the same data five times.
The fix: limit yourself to a maximum of three SMAs per chart, and make sure each one serves a distinct purpose. A clean, effective setup:
- Fast SMA (20): Identifies short-term momentum and entry timing
- Medium SMA (50): Defines the intermediate trend direction
- Slow SMA (200): Establishes the macro trend bias
If all three are aligned — sloping the same direction, stacked in order (20 above 50 above 200 for uptrends) — you have a strong trend. If they're tangled together, the market is telling you it doesn't have a clear direction, and the best trade is no trade.
The meta-lesson across all three mistakes is the same: the SMA works when you respect what it is — a lagging trend filter — and stop asking it to be something it's not. It won't predict reversals. It won't protect you from whipsaws in ranging markets. And it won't replace proper risk management. But as a tool for identifying and riding established trends, nothing simpler has ever done the job better.
Frequently Asked Questions
Q1What is the best SMA period for forex trading?
There is no single best period — it depends on your timeframe and style. For daily charts, the 50-period SMA is the institutional standard for swing trading, while the 200-period SMA defines the long-term trend. On H1, a 20-period SMA tracks intraday momentum effectively. The most important thing is choosing periods that align with your trading horizon and sticking with them consistently.
Q2Is the SMA better than the EMA?
Neither is universally better. The SMA filters noise more effectively and produces fewer false signals in ranging markets, making it ideal for higher timeframes (H4, Daily) and swing trading. The EMA reacts 30-40% faster to price changes, making it better for scalping and intraday momentum strategies. Many traders use both — an SMA for trend direction on higher timeframes and an EMA for entry timing on lower timeframes.
Q3How reliable is the Golden Cross signal?
Historical studies show the Golden Cross (50-day SMA crossing above 200-day SMA) has a success rate of approximately 61-64% in predicting continued upside. The Death Cross has been slightly more reliable at 62-71%. However, false signals occur about 35% of the time, so the cross works best as a directional bias filter combined with volume confirmation and lower-timeframe entry triggers — not as a standalone buy/sell signal.
Q4Why do traders use the 200-day SMA specifically?
The 200-day SMA represents roughly 10 months of trading data and has become the universal benchmark for long-term trend direction. Its power comes from widespread adoption — hedge funds, pension funds, algorithmic systems, and retail traders all watch it. When millions of participants make decisions around the same level, it becomes a self-fulfilling support or resistance zone. Bloomberg terminals display it by default, and financial media regularly references price behavior relative to the 200-day SMA.
Q5Can you use the SMA for scalping on M5 or M15?
You can, but it's not ideal. The SMA's lag becomes a significant disadvantage on very short timeframes where speed matters most. On M5 and M15, the EMA is generally the better choice for primary signal generation. That said, a 200-period SMA on M15 (covering roughly one full trading day) can serve as a useful trend filter — only take scalp entries in the direction of the 200 SMA slope, and you'll avoid many counter-trend losses.
Top Brokers
About the Author
Daniel Harrington
Senior Trading Analyst
Daniel Harrington is a Senior Trading Analyst with a MScF (Master of Science in Finance) specializing in quantitative asset and risk management. With over 12 years of experience in forex and derivatives markets, he covers MT5 platform optimization, algorithmic trading strategies, and practical insights for retail traders.
Use This Indicator
Risk Disclaimer
Trading financial instruments carries significant risk and may not be suitable for all investors. Past performance does not guarantee future results. This content is for educational purposes only and should not be considered investment advice. Always conduct your own research before trading.