Volume Profile Indicator: Trading with POC, Value Area & High Volume Nodes
Volume Profile displays volume traded at each price level as a horizontal histogram, revealing high-volume nodes (support/resistance) and low-volume areas (breakout zones).

Daniel Harrington
Senior Trading Analyst · MT5 Specialist
☕ 21 min read
Settings — VP
| Category | volume |
| Default Period | null |
| Best Timeframes | H1, H4, D1 |
Most traders stare at volume bars at the bottom of their chart and think they understand where the action is. They don't — they're looking at when activity happened, not where. Volume Profile flips the entire concept sideways (literally) by mapping traded volume horizontally across price levels instead of time periods. The result is a histogram that reveals the market's real architecture: which prices attracted massive institutional interest, which prices were rejected so fast that nobody bothered trading there, and where the next explosive move is quietly building pressure. If traditional volume bars are a timestamp, Volume Profile is a GPS coordinate. And once you see the market through this lens, going back to plain volume bars feels like navigating London with a sundial.
Key Takeaways
- Let's start by understanding what makes Volume Profile fundamentally different from the volume bars you've been staring ...
- Volume Profile produces a histogram, but four specific features within that histogram generate nearly all actionable tra...
- If there's one Volume Profile strategy that belongs in every trader's toolkit, it's Value Area rotation trading. The con...
1Volume Profile vs Volume Bars: A Completely Different Way to See Activity
Let's start by understanding what makes Volume Profile fundamentally different from the volume bars you've been staring at since day one. It's not a minor tweak — it's an entirely different way of looking at market participation.
Traditional volume bars sit underneath your candlestick chart and answer one question: how much was traded during this time period? Each bar corresponds to a candle. Big bar means lots of activity during that 1-hour or 4-hour window. Small bar means the market was napping. Useful? Sure. But limited, because it tells you nothing about which prices within that candle attracted the most interest.
Consider a 4-hour candle that ranges from 1.0800 to 1.0860 with massive volume. Standard volume bars tell you: "lots of trading happened in these four hours." Volume Profile tells you: "80% of that trading happened between 1.0830 and 1.0845, almost nothing happened at 1.0800 or 1.0860." See the difference? One gives you a time stamp. The other gives you a structural map.
Volume Profile works by dividing the visible price range into horizontal rows (sometimes called price buckets or bins). Each row collects the total volume traded at that price level across the selected time period. The output is a horizontal histogram extending from the right side of your chart — wide bars where volume was concentrated, thin bars where price zipped through without much participation.
| Feature | Traditional Volume Bars | Volume Profile |
|---|---|---|
| Axis | Time (horizontal) | Price (vertical) |
| Question answered | How much was traded during this period? | How much was traded at this price? |
| Visual output | Vertical bars below candles | Horizontal histogram beside price |
| Reveals | Session activity levels | Structural support/resistance from actual trading |
| Best for | Confirming breakout momentum | Identifying key price levels and zones |
The histogram immediately reveals something that no other indicator can show you: the difference between prices that were merely visited and prices that were genuinely accepted by the market. Price can spike to 1.0900 on a thin liquidity sweep and immediately collapse — traditional volume bars might still show decent total volume for that candle. But Volume Profile would show a thin, anemic bar at 1.0900 and a fat, dominant bar at 1.0850 where all the real trading actually occurred.
This distinction matters because price levels with genuine volume acceptance tend to act as magnets. When price moves away from a heavy-volume level and then pulls back, it frequently stalls right at that level because buyers and sellers both remember it as a "fair" price. Thin-volume levels do the opposite — price tends to accelerate through them because there's no memory of significant trading, no cluster of orders waiting to interact.
Three types of Volume Profile dominate practical usage. Session Volume Profile resets daily (or weekly), building a fresh histogram for each trading session — ideal for day traders and intraday analysis. Fixed Range Volume Profile lets you manually select a specific price range and time period to analyze, perfect for studying a particular consolidation zone or trend leg. Visible Range Volume Profile automatically analyzes whatever is currently visible on your chart, adjusting as you zoom in and out.
For beginners, start with Session Volume Profile on the H1 or H4 chart. It resets each day, giving you a clean structural picture of where the market did its business during the previous session. Those levels then become your reference points for the current session. Think of it as the market leaving footprints — Volume Profile shows you exactly where those footprints are deepest.
The indicator is available natively on TradingView (search "Volume Profile" in the indicators panel and you'll find Session Volume, Visible Range, and Fixed Range variants). On MetaTrader 5, Volume Profile isn't built-in, but several excellent versions exist on the MQL5 marketplace. Some use tick volume as a proxy since MT5 forex data doesn't include true exchange volume — a reasonable approximation on major pairs during liquid sessions.
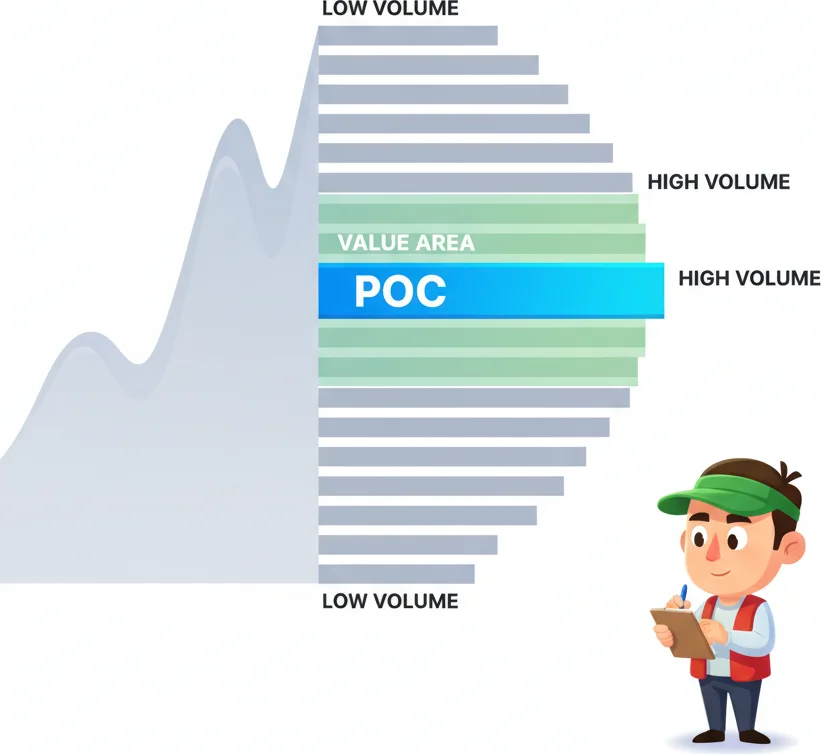
2POC, Value Area, HVN and LVN: The Key Levels Explained
Volume Profile produces a histogram, but four specific features within that histogram generate nearly all actionable trading signals. Master these four concepts and you've mastered 90% of Volume Profile analysis.
Point of Control (POC)
The POC is the single price level where the most volume was traded during the selected period. On the histogram, it's the longest horizontal bar — the peak of the mountain. Think of the POC as the market's "fairest" price: the level where the maximum number of buyers and sellers agreed to transact. Neither side felt they were getting a particularly good or bad deal at this price, so business just kept flowing.
The POC acts as a gravitational center. In balanced, range-bound markets, price tends to orbit around the POC, getting pulled back toward it whenever it drifts too far away. When the market transitions from balance to trend, the POC becomes a reference level that often acts as support or resistance on retests.
One important nuance: a developing POC (one that's still being built during the current session) can shift. If heavy volume suddenly hits a new price level mid-session, the POC can migrate — and when it does, it's a significant signal that market consensus is changing in real time. A migrating POC during a session often foreshadows a trend day.
Value Area (VA): VAH and VAL
The Value Area encompasses the price range containing approximately 70% of all traded volume in the profile. It's bounded by two levels: the Value Area High (VAH) at the top and the Value Area Low (VAL) at the bottom.
Why 70%? The number is borrowed from statistics — in a normal distribution, one standard deviation covers about 68.2% of all data points. The trading community rounded to 70% for simplicity. The Value Area represents the zone where the vast majority of trading participants agreed on value. Prices outside the Value Area — above VAH or below VAL — represent outlier levels where the market considered prices too expensive or too cheap for sustained trading.
| Level | Definition | Typical Behavior |
|---|---|---|
| VAH | Upper boundary of the 70% volume zone | Acts as resistance — price above VAH is "expensive" |
| POC | Price level with the highest traded volume | Acts as a magnet and equilibrium point |
| VAL | Lower boundary of the 70% volume zone | Acts as support — price below VAL is "cheap" |
The relationship between current price and the previous session's Value Area is one of the most powerful setups in Volume Profile trading. If today's session opens inside yesterday's Value Area, expect rotational behavior — the market is continuing yesterday's conversation. If today's session opens outside yesterday's Value Area, the market has rejected yesterday's fair value and is searching for a new one — trend potential is higher.
High Volume Nodes (HVN)
HVNs are price levels with significantly above-average volume on the histogram — the fat clusters where business was brisk. While the POC is the single highest-volume row, HVNs are broader zones of concentrated activity.
Think of HVNs as thick mud for price. When price enters an HVN, it tends to slow down, chop around, and consolidate. Why? Because HVNs represent zones where large numbers of traders have positions. Those traders become defenders of that price level — buyers who entered at the HVN will place stops below it and look to add on dips back to it; sellers will defend from above. All that order flow creates friction.
Practical implications: HVNs make excellent support and resistance levels with genuine structural backing. They're also natural profit target zones because price decelerates when it enters them. If you're in a trending trade, expect to take some heat when price reaches the next HVN — that's where the opposing team has their orders stacked.
Low Volume Nodes (LVN)
LVNs are the valleys in the histogram — price levels where almost no trading occurred. These represent zones of rejection and imbalance where price moved so quickly that neither buyers nor sellers wanted to participate.
Think of LVNs as open highway. Price tends to accelerate through them because there's no meaningful order flow to create friction. A breakout into an LVN often produces fast, directional moves — sometimes surprisingly so — because there are no resting orders to absorb momentum.
LVNs between two HVNs create a characteristic "shelf" pattern: fat cluster, thin valley, fat cluster. This structure is the bread and butter of Volume Profile trading. Price bounces between HVNs and zips through LVNs. Identifying these shelves gives you a roadmap of where price is likely to stall and where it's likely to fly.
The Profile Shape Tells a Story
Beyond individual levels, the overall shape of the Volume Profile conveys market sentiment:
- D-shaped (bell curve): Balanced market, healthy distribution. Expect mean reversion to the POC.
- P-shaped (volume concentrated at the top): Bullish auction. Buyers drove price up and held it. Support exists at the base of the P.
- b-shaped (volume concentrated at the bottom): Bearish auction. Sellers drove price down and it was accepted there. Resistance at the top of the b.
- Thin/elongated profile: Strong trend day. Price moved aggressively in one direction without building significant volume at any single level. The next session may see a reversion to fill in those thin zones.
Recognizing these shapes at a glance tells you within seconds whether yesterday was a ranging day, a trend day, or a failed auction — and that context dramatically changes how you approach today's trading.

When you're tracking POC and Value Area like a trading detective.
“If there's one Volume Profile strategy that belongs in every trader's toolkit, it's Value Area rotation trading.”
3Trading the Value Area: Mean Reversion Between VAH and VAL
If there's one Volume Profile strategy that belongs in every trader's toolkit, it's Value Area rotation trading. The concept is elegantly simple: when price is inside the Value Area, it tends to bounce between VAH and VAL like a tennis ball in a hallway. The POC sits in the middle as the equilibrium point. Your job is to buy low (near VAL), sell high (near VAH), and pocket the difference.
This works because the Value Area represents established consensus. 70% of the previous session's volume traded within this zone, which means an enormous number of market participants have positions clustered in this range. Those participants defend their positions: buyers near VAL become aggressive when price dips to their entries, and sellers near VAH step in when price rallies to their exit levels. The result is a self-reinforcing rotation until something breaks the pattern.
The Basic Value Area Rotation Setup
- Mark yesterday's VAH, VAL, and POC on your chart (most Volume Profile indicators display these automatically).
- If today's session opens inside yesterday's Value Area, the rotation setup is active.
- Buy when price pulls back to VAL with a bullish rejection signal (pin bar, engulfing candle, or a simple strong bounce). Stop loss below VAL by a small buffer. First target: POC. Extended target: VAH.
- Sell when price rallies to VAH with a bearish rejection signal. Stop loss above VAH. First target: POC. Extended target: VAL.
| Entry | Signal | Stop Loss | Target 1 | Target 2 |
|---|---|---|---|---|
| Long at VAL | Bullish rejection candle | Below VAL (10-15 pip buffer) | POC | VAH |
| Short at VAH | Bearish rejection candle | Above VAH (10-15 pip buffer) | POC | VAL |
The beauty of this approach is its repeatability. In balanced markets, you can potentially trade multiple rotations per day. Price reaches VAH, you short to POC, take profit, wait for the pullback to VAL, go long to POC, take profit again. It's the closest thing to a "rinse and repeat" strategy that Volume Profile offers.
The 80% Rule: A High-Probability Variant
There's a well-known guideline among Volume Profile traders: if the market opens outside the previous session's Value Area and then re-enters it (by crossing through VAH from above, or VAL from below) within the first two 30-minute candles, there's roughly an 80% probability that price will traverse the entire Value Area and reach the opposite boundary.
The logic: when price opens outside value and re-enters, it's signaling rejection of the outlier zone and acceptance back into the previous fair value range. Once inside, the path of least resistance runs to the opposite side because there's heavy volume (and thus liquidity) throughout the Value Area, creating a natural highway.
Practical application:
- Price opens above yesterday's VAH, then drops back below VAH within the first hour.
- Enter short just below VAH.
- Target: VAL (the opposite boundary).
- Stop: back above the session high.
This setup has excellent risk-to-reward because the distance from VAH to VAL is often 2-3 times the distance from VAH to your stop loss. Not every instance works — the 80% figure is a guideline, not gospel — but the structural logic is sound.
When Value Area Rotation Fails (And What That Tells You)
The rotation strategy breaks down when the market transitions from balance to trend. Several signals warn you that the Value Area is about to lose its grip:
Expanding Value Area. If today's developing Value Area is significantly wider than yesterday's, the market is exploring new territory. The boundaries of yesterday's VA become less relevant as new consensus forms.
POC Migration. If the developing POC moves sharply away from yesterday's POC, institutional order flow is shifting. The old equilibrium is being abandoned.
Volume Profile shape change. Yesterday produced a nice D-shaped (balanced) profile. Today's developing profile looks P-shaped or b-shaped. The market is transitioning from rotation to directional movement.
Aggressive rejection of VAL or VAH. If price slams through VAL with heavy volume and closes well below it — no hesitation, no wick, just raw momentum — the rotation thesis is dead. Stop out immediately and switch to a breakout mindset.
The key discipline: Value Area rotation is a range-trading strategy. It only works in balanced, rotational environments. When the character of the market changes, you must adapt — and the Volume Profile itself will tell you when that shift is happening if you're paying attention.
Combining Value Area with Other Indicators
Value Area rotation becomes even more reliable when you add confluence:
- RSI at 30 near VAL confirms oversold conditions at structural support — high-probability long entry.
- RSI at 70 near VAH confirms overbought conditions at structural resistance — high-probability short entry.
- VWAP sitting near the POC creates a double-reinforced equilibrium level. If session VWAP and yesterday's POC align within a few pips, that level becomes a fortress.
- Fibonacci retracements overlapping with VAH or VAL add another layer of structural significance.
One final tip: track the previous three to five sessions' Value Areas, not just yesterday's. When multiple sessions' VAH levels cluster at a similar price, that zone becomes a major structural resistance level. Same for VAL. These multi-session confluences are where Volume Profile analysis transitions from a day-trading tool to a swing-trading weapon.
4Volume Profile for Breakout Trading: Low Volume Nodes as Acceleration Zones
Mean reversion inside the Value Area is the bread — breakout trading through LVNs is the butter. And occasionally, the fireworks.
Here's the core insight: Low Volume Nodes represent price levels where the market rejected spending time. Price blew through these zones so quickly during their formation that minimal volume accumulated. When price returns to an LVN, it behaves exactly the same way — it accelerates. Why? Because there are no resting limit orders, no significant stop clusters, and no institutional position defenders at that price. It's a vacuum.
This vacuum effect makes LVNs the ideal terrain for breakout trades. When price breaks out of a consolidation zone and enters an LVN, the lack of opposing order flow means the move can extend farther and faster than it would through an HVN. If you've ever watched a breakout stall inexplicably at a random price level and wondered why, the answer was probably an HVN sitting there that you didn't see. And if you've watched a breakout explode with violent momentum, an LVN was likely the runway.
The LVN Breakout Setup
- Identify a consolidation zone on the H1 or H4 chart. The consolidation should have a clear Value Area with defined VAH and VAL.
- Locate the nearest LVN beyond VAH (for a bullish breakout) or below VAL (for a bearish breakout). This is your acceleration zone.
- Wait for price to break out of the Value Area with conviction — a strong candle close beyond VAH/VAL with above-average volume.
- Enter on the breakout or on the first pullback to the broken boundary (VAH becomes support for longs, VAL becomes resistance for shorts).
- Profit target: the next HVN beyond the LVN. This is where price is most likely to slow down and consolidate again.
- Stop loss: back inside the Value Area, below VAH for longs or above VAL for shorts.
| Setup Element | Bullish Breakout | Bearish Breakout |
|---|---|---|
| Consolidation boundary | Break above VAH | Break below VAL |
| Acceleration zone | LVN above VAH | LVN below VAL |
| Entry | Close above VAH or pullback to VAH | Close below VAL or pullback to VAL |
| Profit target | Next HVN above LVN | Next HVN below LVN |
| Stop loss | Back inside Value Area | Back inside Value Area |
The risk-to-reward on these setups is often exceptional. The distance through the LVN to the next HVN can be 3-5 times the width of your stop loss. And because LVNs offer minimal resistance, the move tends to happen quickly — you're not sitting in a trade for days waiting for your target. Price either accelerates through the LVN as expected, or it fails at the boundary and you get stopped out with a small loss.
The "Shelf" Pattern: HVN-LVN-HVN
The most reliable LVN breakout structure looks like a shelf on the Volume Profile: two fat HVN clusters separated by a thin LVN valley. Price is consolidating at the first HVN (building energy), and if it breaks toward the LVN, it's likely to travel all the way to the second HVN before finding resistance.
Think of it like a ball on a shelf. The ball sits on the upper shelf (HVN), and between the shelves is a gap (LVN). Once the ball rolls off the edge, it falls through the gap quickly and lands on the lower shelf. The same physics applies in reverse for bullish breakouts — price launches from the lower HVN, rockets through the LVN, and parks at the upper HVN.
This pattern is visible across all timeframes. On the D1 chart, the LVN gap between monthly HVNs can be 100-200 pips on EUR/USD — creating swing trade opportunities with serious profit potential. On the H1 chart, the LVN might only be 20-30 pips, but the acceleration is just as reliable on a proportional basis.
Volume Confirmation: The Missing Filter Most Traders Skip
Not every breakout through an LVN succeeds. The ones that fail typically share one characteristic: low volume on the breakout candle itself. If price enters an LVN but does so on declining volume, it suggests the move lacks institutional backing. The breakout might stall in the middle of the LVN and reverse — an ugly outcome for a trader expecting acceleration.
The filter is simple: demand above-average volume on the breakout candle. Specifically:
- The candle that breaks through VAH or VAL should have volume at least 1.5x the 20-period average.
- Ideally, the next candle (the one entering the LVN) also shows strong volume, confirming follow-through.
- If the breakout candle has below-average volume, skip the trade. It's likely a false breakout or a liquidity sweep.
Combining LVN Breakouts with Trend Context
LVN breakouts in the direction of the higher-timeframe trend are significantly more reliable than counter-trend attempts. Before taking an LVN breakout trade, check the D1 trend:
- If the D1 trend is bullish and you're seeing a bullish LVN breakout on H1 — high conviction.
- If the D1 trend is bearish and you're seeing a bullish LVN breakout on H1 — lower conviction. Consider reducing position size or skipping entirely.
This alignment filter doesn't guarantee success, but it tilts the odds meaningfully. Trend-aligned LVN breakouts are the highest-probability setups in Volume Profile trading. They combine structural vacuum (the LVN), momentum (the breakout), and directional bias (the trend) into a single, cohesive trade thesis.
Real-World Application
Here's how this plays out in practice. On a daily EUR/USD Volume Profile, you notice the monthly profile shows a massive HVN at 1.0850 (where the pair has been consolidating for two weeks), a thin LVN between 1.0880 and 1.0920, and another HVN at 1.0950. The pair finally breaks above 1.0880 on a strong H4 candle with above-average volume. You enter long targeting 1.0950 (the upper HVN), with a stop at 1.0845 (just below the lower HVN). The LVN offers 40 pips of runway with minimal resistance. The risk is 35 pips. If the target hits, you collect 100 pips on 35 pips of risk — nearly 3:1 reward-to-risk from a setup grounded entirely in actual market structure.

Low Volume Nodes: where prices move fast because nobody's home.
“Everything we've discussed so far works beautifully on stocks and futures, where there's a clear opening bell, a closing bell, and actual exchange-reported volume data.”
5Volume Profile on Forex: Session Profiles and the 24-Hour Challenge
Everything we've discussed so far works beautifully on stocks and futures, where there's a clear opening bell, a closing bell, and actual exchange-reported volume data. Forex... is a different animal. And if you're going to use Volume Profile on currency pairs, you need to understand the unique challenges and how to work around them.
The Volume Problem
Forex is an over-the-counter (OTC) market. There's no central exchange. When you trade EUR/USD, your order goes to your broker's liquidity providers — different banks, different pools, different volumes. No single source captures total global forex volume. This is a genuine limitation.
What your MetaTrader 5 or TradingView platform shows instead is tick volume — the number of price changes per period. Each tick represents at least one transaction, so more ticks generally correlate with more actual volume. Research has shown that tick volume correlates reasonably well with real volume data from CME forex futures during liquid sessions. The correlation is strongest during the London-New York overlap (13:00-17:00 GMT) and weakest during the late Asian session (03:00-06:00 GMT) when liquidity is thin.
Is tick volume good enough for Volume Profile? For most practical purposes, yes — especially on major pairs (EUR/USD, GBP/USD, USD/JPY, AUD/USD) during active sessions. The POC, Value Area, and HVN/LVN levels generated from tick volume line up closely with those generated from futures volume. Just be cautious with the indicator during low-liquidity hours, where thin tick data can produce misleading profiles.
If you want pure, exchange-reported volume, consider using CME forex futures for your Volume Profile analysis (6E for EUR/USD, 6B for GBP/USD, 6J for USD/JPY). Many professional forex traders do exactly this — analyze the futures chart for structure and execute on the spot market. It's an extra step, but it removes the tick volume question entirely.
The Session Reset Problem
Volume Profile on a stock chart resets naturally at market open. NYSE opens at 9:30 AM EST, the profile starts building, market closes at 4:00 PM, done. Clean, simple, universal.
Forex trades nearly 24 hours a day from Sunday evening to Friday afternoon. When should the Volume Profile reset? There's no universal answer, and this is where forex traders need to make deliberate choices rather than trusting platform defaults.
| Platform | Default VWAP/VP Reset | Potential Issue |
|---|---|---|
| TradingView | Exchange midnight (varies by symbol) | May fall during quiet Asian session |
| MT5 (GMT+2 broker) | 00:00 server time | Includes NY close activity in the "next" session |
| MT5 (GMT+0 broker) | 00:00 GMT | Splits the Asian session |
If your profile resets at midnight GMT, you're starting the new session right in the middle of the Asian session — when volume is typically lightest. The first few hours of your "daily" profile will be dominated by thin, low-conviction volume from Tokyo, which can skew the entire day's POC and Value Area.
Solution: Session-Based Volume Profiles
Instead of running one awkward 24-hour profile, experienced forex traders run separate profiles for each major trading session:
-
London Profile (08:00-16:00 GMT): The most important session for EUR, GBP, and CHF pairs. London accounts for roughly 35-40% of daily forex volume, making its Volume Profile the most structurally significant. The London session POC and Value Area are the levels most likely to attract institutional interest.
-
New York Profile (13:00-21:00 GMT): Critical for USD pairs. The London-New York overlap (13:00-16:00 GMT) is the highest-volume window of the entire forex day — profiles built during this period carry the most structural weight.
-
Asian Profile (00:00-08:00 GMT): Important for JPY, AUD, and NZD pairs. Volume is lower overall, so the profiles tend to be narrower with less structural significance for European and USD pairs. However, for AUD/JPY or NZD/JPY, the Asian profile is your primary reference.
On TradingView, you can configure Session Volume Profile with custom session times. On MT5, several marketplace indicators allow custom session boundaries. The key is being intentional about which session you're analyzing rather than accepting a random midnight reset.
The Previous Session's Value Area: Your Daily Roadmap
The most practical workflow for forex Volume Profile traders:
- Before the London open, mark the previous London session's VAH, VAL, and POC on your chart.
- Note where the Asian session's price action sits relative to those levels.
- When London opens, observe whether price opens inside or outside the previous London Value Area.
- If inside: prepare for rotation trades (buy VAL, sell VAH).
- If outside: prepare for trend or breakout trades, and watch for the 80% rule if price re-enters the VA.
This simple framework gives you a structured game plan before each trading session. You're not guessing — you're letting the previous session's actual volume distribution tell you where the key levels are.
Composite Profiles: The Multi-Day View
For swing traders, a single session's Volume Profile is too narrow. This is where composite profiles shine — they aggregate volume data across multiple sessions to reveal macro structure.
A weekly composite profile shows the POC and Value Area for the entire trading week. Monthly composites reveal the structural levels that persisted across all sessions in a calendar month. These macro POCs and Value Areas become powerful reference levels for H4 and D1 traders.
The weekly composite POC, in particular, is worth tracking. In trending markets, price often retests the prior week's composite POC before continuing in the trend direction. It's like a weekly mean-reversion magnet that institutional flow respects.
Practical Tips for Forex Volume Profile Users
- Stick to major pairs. EUR/USD, GBP/USD, USD/JPY have the highest tick volume, which produces the most reliable profiles. Exotic pairs with thin volume generate noisy, unreliable profiles.
- Focus on London and NY sessions. Volume Profile data from the Asian session is less structurally significant for major pairs because volume is lower. Use Asian profiles mainly for JPY and AUD crosses.
- Compare tick volume profiles with futures. If you have access to CME futures data, periodically overlay the two profiles to verify that your tick-based levels are in the right ballpark.
- Use Fixed Range VP for event analysis. Anchor a Fixed Range Volume Profile to the start of a major move (post-NFP, post-ECB decision) to identify the structural levels created by that event. These event-driven profiles often persist for weeks.
- Don't overcomplicate it. Start with yesterday's London session POC, VAH, and VAL. Trade the rotation or the breakout. Add composite profiles once the basic workflow is second nature.
Volume Profile on forex isn't perfect — tick volume limitations and the session reset question are real challenges. But the structural insight it provides is unmatched by any other indicator. Price levels derived from actual trading activity are simply more reliable than arbitrary lines drawn on a chart. Even with tick volume as a proxy, the POC and Value Area levels hold up remarkably well on major pairs during active sessions. That's not magic — it's the footprint of millions of transactions creating structure that future price action respects.
Frequently Asked Questions
Q1What is the Point of Control (POC) in Volume Profile?
The POC is the single price level where the most volume was traded within the selected profile period. It represents the market's strongest consensus price — the level where buyers and sellers transacted most aggressively. In balanced markets, the POC acts as a gravitational center that price tends to orbit around. When the market transitions to a trend, the POC becomes a key support or resistance level on retests. If the developing POC migrates significantly during a session, it signals that institutional consensus is shifting in real time.
Q2Does Volume Profile work on forex since there's no centralized exchange volume?
Yes, but with caveats. Forex platforms provide tick volume (number of price changes per period) instead of true exchange volume. Research shows tick volume correlates well with actual volume on major pairs during liquid sessions, particularly the London-New York overlap. The POC and Value Area levels generated from tick volume align closely with those from CME forex futures data. For the most accurate profiles, stick to major pairs during active sessions and consider using CME futures charts (6E, 6B, 6J) for analysis if precision is critical.
Q3What timeframe should I use for Volume Profile?
It depends on your trading style. Day traders typically use Session Volume Profile on H1 charts, resetting each session to identify intraday POC and Value Area levels. Swing traders benefit from weekly composite profiles on H4 charts, where the weekly POC acts as a multi-day mean reversion target. Position traders should look at monthly composite profiles on D1 charts for macro structural levels. A powerful approach is running all three simultaneously — session profile for precision entries, weekly for context, and monthly for directional bias.
Q4How do I differentiate between a genuine breakout and a false breakout using Volume Profile?
Genuine breakouts through Value Area boundaries (VAH or VAL) typically show above-average volume on the breakout candle — at least 1.5 times the 20-period average. The next candle should confirm with follow-through volume and price closing further beyond the boundary. False breakouts often feature below-average volume, long wicks back inside the Value Area, and occur during low-liquidity periods. Additionally, breakouts into Low Volume Nodes tend to have higher follow-through than breakouts into High Volume Nodes, since LVNs offer less structural resistance.
Q5Can I combine Volume Profile with other indicators?
Absolutely, and doing so improves reliability significantly. The strongest combinations include Volume Profile with VWAP (when session VWAP aligns with the POC, that level becomes extremely significant), RSI for overbought/oversold confirmation near VAH and VAL respectively, and moving averages for trend context on higher timeframes. Fibonacci retracements that overlap with HVN levels create powerful confluence zones. The key principle is using Volume Profile for structural levels and other indicators for timing and confirmation of entries.
Top Brokers
About the Author
Daniel Harrington
Senior Trading Analyst
Daniel Harrington is a Senior Trading Analyst with a MScF (Master of Science in Finance) specializing in quantitative asset and risk management. With over 12 years of experience in forex and derivatives markets, he covers MT5 platform optimization, algorithmic trading strategies, and practical insights for retail traders.
Use This Indicator
Risk Disclaimer
Trading financial instruments carries significant risk and may not be suitable for all investors. Past performance does not guarantee future results. This content is for educational purposes only and should not be considered investment advice. Always conduct your own research before trading.